. 2016 Jul 20;12(7):e1006185.
doi: 10.1371/journal.pgen.1006185. eCollection 2016 Jul.

A Natural Variant of the T Cell Receptor-Signaling Molecule Vav1 Reduces Both Effector T Cell Functions and Susceptibility to Neuroinflammation

Affiliations

A Natural Variant of the T Cell Receptor-Signaling Molecule Vav1 Reduces Both Effector T Cell Functions and Susceptibility to Neuroinflammation

Sahar Kassem et al. PLoS Genet. .

Abstract

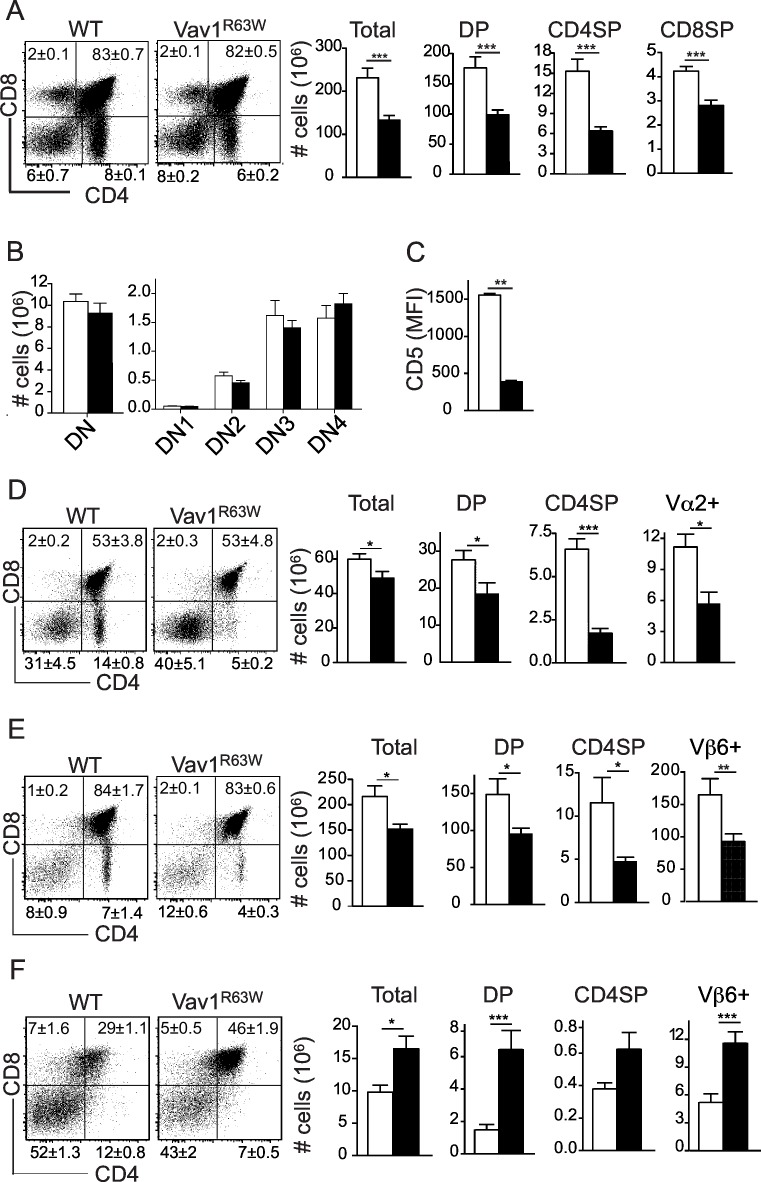
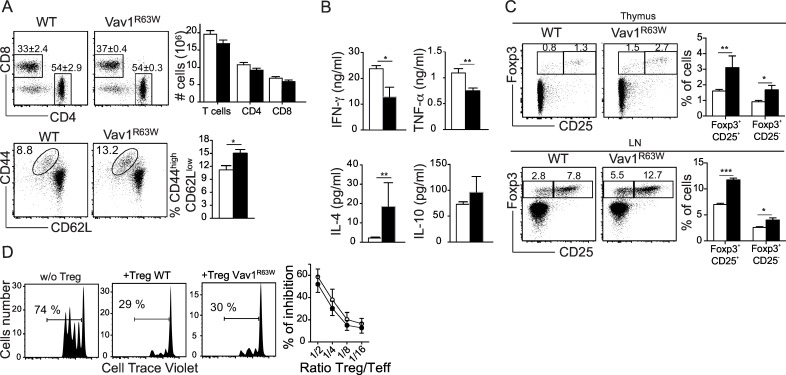
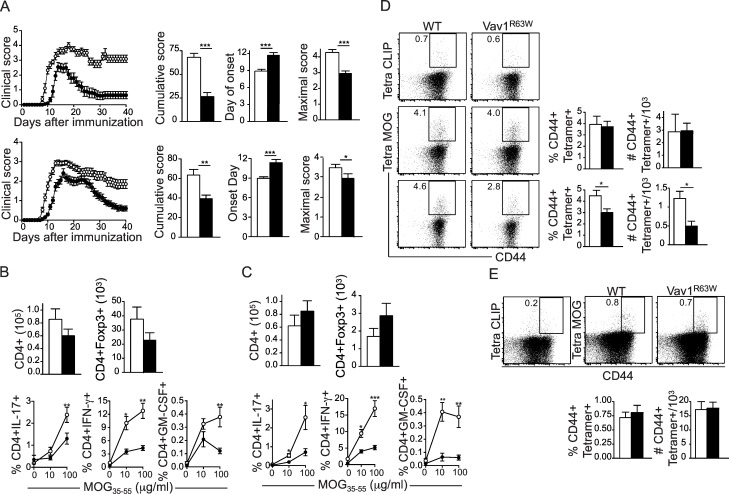
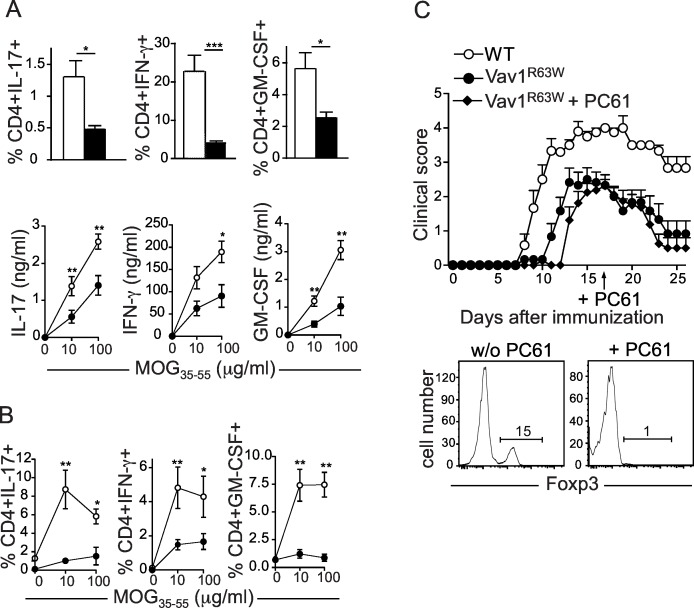
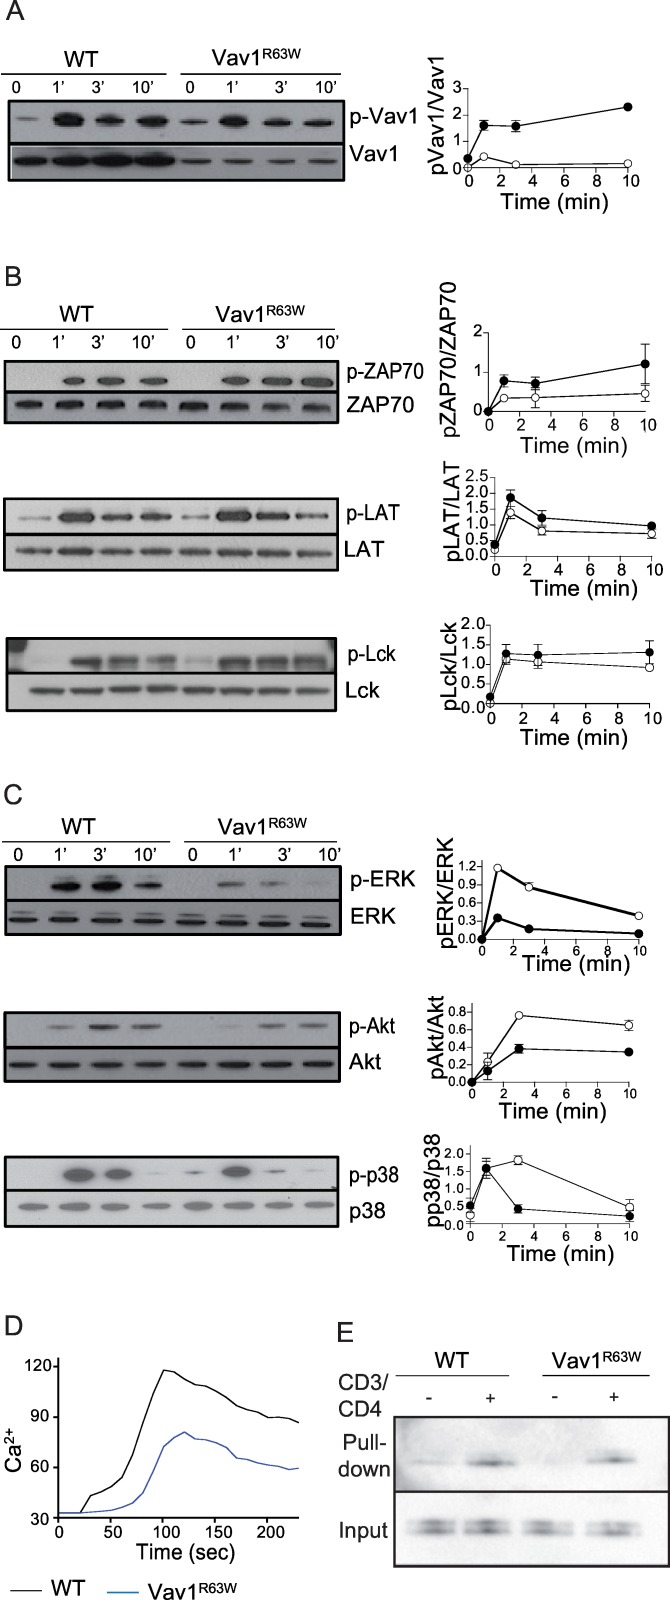
The guanine nucleotide exchange factor Vav1 is essential for transducing T cell antigen receptor signals and therefore plays an important role in T cell development and activation. Our previous genetic studies identified a locus on rat chromosome 9 that controls the susceptibility to neuroinflammation and contains a non-synonymous polymorphism in the major candidate gene Vav1. To formally demonstrate the causal implication of this polymorphism, we generated a knock-in mouse bearing this polymorphism (Vav1R63W). Using this model, we show that Vav1R63W mice display reduced susceptibility to experimental autoimmune encephalomyelitis (EAE) induced by MOG35-55 peptide immunization. This is associated with a lower production of effector cytokines (IFN-γ, IL-17 and GM-CSF) by autoreactive CD4 T cells. Despite increased proportion of Foxp3+ regulatory T cells in Vav1R63W mice, we show that this lowered cytokine production is intrinsic to effector CD4 T cells and that Treg depletion has no impact on EAE development. Finally, we provide a mechanism for the above phenotype by showing that the Vav1R63W variant has normal enzymatic activity but reduced adaptor functions. Together, these data highlight the importance of Vav1 adaptor functions in the production of inflammatory cytokines by effector T cells and in the susceptibility to neuroinflammation.


Conflict of interest statement

The authors have declared that no competing interests exist.

Figures

Fig 1
Fig 1. Impact of the Vav1R63W mutation on T cell development.
(A) Representative dot plots of CD4 and CD8 expression on thymocytes from WT (n = 16) and Vav1R63W (n = 13) mice. Graphs represent the absolute numbers of total thymocytes and of each indicated population. (B) Mean absolute numbers of the different double negative (DN) populations in the thymus of WT (n = 5) and Vav1R63W (n = 5) mice. (C) Mean fluorescence intensity (MFI) of CD5 expression on double positive (DP) thymocytes of WT (n = 16) and Vav1R63W (n = 13) mice. (D) Representative dot plots of CD4 and CD8 expression on thymocytes of TCR transgenic OTII WT (n = 6) and OTII Vav1R63W (n = 4) mice. Graphs show the absolute numbers of total thymocytes and of each indicated population. (E and F) Representative dot plots of CD4 and CD8 expression on thymocytes of female (E) and male (F) HY-TCR transgenic WT (n = 5 for females, n = 13 for males) and Vav1R63W mice (n = 10 for females, n = 12 for males). Graphs show the absolute numbers of total thymocytes and of each indicated population. The values in dot plots represent the mean percentages of each population ± SEM. For A, C, E and F, the data represents the pool of three independent experiments. ■: Vav1R63W mice; □: WT mice; *p≤0.05; **p≤0.01; ***p≤0.001.
Fig 2
Fig 2. Impact of Vav1R63W on T cell functions.
(A, upper panels) Representative dot plots of CD4 and CD8 T cells in the lymph nodes (LN) of WT (n = 10) and Vav1R63W (n = 8) mice. Graphs show absolute numbers of the indicated populations. (A, lower panels) Representative dot plots showing CD44 and CD62L expression on CD4 T cells in the LN of WT and Vav1R63W mice. The histogram shows the mean percentages of activated CD4+CD44highCD62Llow cells. Data are representative of two independent experiments. (B) CD4+CD62Lhigh T cells from WT (n = 7) and Vav1R63W (n = 7) mice were stimulated with anti-CD3 and anti-CD28 antibodies for 48h. Histograms show the mean concentration of IL-10, IL-4, IFN-γ and TNFα in the supernatants. (C) Representative analysis of the expression of Foxp3 and CD25 in CD4+ T cells in the thymus (upper panels) and the LN (lower panels) of WT (n = 10) and Vav1R63W (n = 10) mice. Histograms show mean percentages of CD4+Foxp3+ CD25+ and CD4+Foxp3+CD25- T cells. The data are from two independent experiments. (D) The suppressor activity of CD4+CD62L+CD25bright Treg cells was measured using assays of suppression of T cell proliferation. Treg cells from WT or Vav1R63W mice were co-cultured with WT effector T cells at various ratios. Results represent the % of inhibition and are representative of six independent experiments. ■: Vav1R63W mice; □: WT mice; *p≤0.05; **p≤0.01; ***p≤0.001.
Fig 3
Fig 3. Vav1R63W mice are less susceptible to EAE.
(A) EAE was induced in mice by immunization with MOG35-55 peptide, using either 50 μg (upper panels, n = 10) or 100 μg (lower panels, n = 32). Disease severity was monitored daily. Histograms show mean cumulative scores, onset day and maximal score for the indicated genotypes. (B, C) Histograms show the mean absolute numbers of CD4 T cells and CD4+Foxp3+ Treg cells in the brain (B) and spinal cord (C) at the peak of the disease (day 15, n = 7 to 9 mice per group). Cells were re-stimulated overnight with MOG35-55 and cytokine expression was analyzed by intracellular staining in CD4 T cells from the brain (B) and spinal cord (C). (D, E) Tetramer staining showing CD4+CD44+ T cells specific for the MOG35-55 peptide in the brain (D, middle panels), spinal cord (D, lower panels) and LN (E) of WT (n = 6) and Vav1R63W (n = 6) mice at day 15 after immunization. The tetramer staining showing CD4+CD44+ T cells specific for the CLIP peptide is used as control. Graphs show the mean percentages and absolute numbers of CD4+CD44highTetramer+ cells for the indicated genotypes. Results are representative of two independent experiments. ■: Vav1R63W mice; □: WT mice; *p≤0.05; **p≤0.01; ***p≤0.001.
Fig 4
Fig 4. Reduced susceptibility to EAE in Vav1R63W mice is due to an intrinsic defect in effector CD4 T cells.
(A) LN cells from MOG35-55 immunized WT (n = 9) and Vav1R63W (n = 8) mice were collected on day 15 after immunization and re-stimulated for 72 hours with MOG35-55 peptide. Graphs of the upper panels show intracellular cytokine expression by CD4+CD44high cells after stimulation with 10 μg of MOG35-55. Lower panels show cytokine concentrations (IL-17, IFN-γ and GM-CSF) in the supernatants after stimulation with 10 or 100μg of MOG35-55 peptide. (B) Mixed bone marrow chimera were generated by transferring bone marrow from both CD45.1 WT and CD45.1 x CD45.2 Vav1R63W into CD45.2 Vav1R63W recipients (n = 6). 8 weeks later, the chimera were immunized with MOG35-55 peptide and sacrificed 15 days later for the analysis of cytokine expression by draining LN CD4 T cells. The graphs show the proportion of CD4 T cells originating from either the WT or Vav1R63W bone marrow expressing IL-17, IFN-γ and GM-CSF after 72h of stimulation with MOG35-55. (C upper panel) EAE clinical scores analyzed after Treg cell depletion with PC61 i.p. injection at day 17 after MOG35-55 immunization (n = 10 for each group). (C lower panel) Representative analysis of the expression of Foxp3 in peripheral blood CD4+ T cells one week after PC61 administration. The data are representative of two independent experiments. ■: Vav1R63W mice; □: WT mice; *p≤0.05; **p≤0.01; ***p≤0.001.
Fig 5
Fig 5. Impact of the Vav1R63W mutation on Vav1 expression, functions and TCR signaling.
Phosphorylation of Vav1 (A), ZAP-70, LAT and LcK (B), Erk, Akt and p38 (C) were analyzed by western blot in CD4 T cells after anti-CD3 and anti-CD4 stimulation for the indicated times. The graphs show the relative abundance of p-Vav1, p-ZAP-70, p-LAT, pLcK, p-Akt, p-Erk and p-p38. (D) Analysis of Ca2+ influx in purified CD4 T cells from WT and Vav1R63W mice loaded with Indo-1 following stimulation with anti-CD3 mAb. Data are representative of three independent experiments. (E) Analysis of Rac1 activation in WT and Vav1R63W CD4 T cells stimulated or not with anti-CD3 and anti-CD4 mAbs using pull-down assay to detect the relative amounts of Rac1-GTP. Total Rac1 levels were used as loading controls. Data are representative of three independent experiments. ■: Vav1R63W mice; □: WT mice.

References

    1. Tybulewicz VL. Vav-family proteins in T-cell signalling. Curr Opin Immunol. 2005;17(3):267–74. . - PubMed
    1. Tarakhovsky A, Turner M, Schaal S, Mee PJ, Duddy LP, Rajewsky K, et al. Defective antigen receptor-mediated proliferation of B and T cells in the absence of Vav. Nature. 1995;374(6521):467–70. . - PubMed
    1. Fischer KD, Zmuldzinas A, Gardner S, Barbacid M, Bernstein A, Guidos C. Defective T-cell receptor signalling and positive selection of Vav-deficient CD4+ CD8+ thymocytes. Nature. 1995;374(6521):474–7. Epub 1995/03/30. 10.1038/374474a0 . - DOI - PubMed
    1. Zhang R, Alt FW, Davidson L, Orkin SH, Swat W. Defective signalling through the T- and B-cell antigen receptors in lymphoid cells lacking the vav proto-oncogene. Nature. 1995;374(6521):470–3. 10.1038/374470a0 . - DOI - PubMed
    1. Turner M, Mee PJ, Walters AE, Quinn ME, Mellor AL, Zamoyska R, et al. A requirement for the Rho-family GTP exchange factor Vav in positive and negative selection of thymocytes. Immunity. 1997;7(4):451–60. . - PubMed

Publication types

MeSH terms