Geographic Variation in Trends and Disparities in Acute Myocardial Infarction Hospitalization and Mortality by Income Levels, 1999-2013
- PMID: 27438103
- PMCID: PMC5459393
- DOI: 10.1001/jamacardio.2016.0382
Geographic Variation in Trends and Disparities in Acute Myocardial Infarction Hospitalization and Mortality by Income Levels, 1999-2013
Abstract
Importance: During the past decade, the incidence and mortality associated with acute myocardial infarction (AMI) in the United States have decreased substantially. However, it is unknown whether these improvements were consistent across communities of different economic status and geographic regions since efforts to improve cardiovascular disease prevention and management may have had variable impact.
Objective: To determine whether trends in US county-level, risk-standardized AMI hospitalization and mortality rates varied by county-based median income level.
Design, setting, and participants: In this observational study, county-level risk-standardized (age, sex, and race) hospitalization and 1-year mortality rates for AMI from January 1, 1999, to December 31, 2013, were measured for Medicare beneficiaries 65 years or older. Data analysis was performed from June 2 through December 1, 2015. Counties were stratified by median income percentile using 1999 US Census Bureau data adjusted for inflation: low- (<25th), average- (25th-75th), or high- (>75th) income groups.
Main outcomes and measures: The effect of income on the slope of AMI hospitalizations and mortality, measured as differences in the rate of change in AMI hospitalizations and mortality by county income and by the 4 US geographic regions, and a possible lag effect among low-income counties.
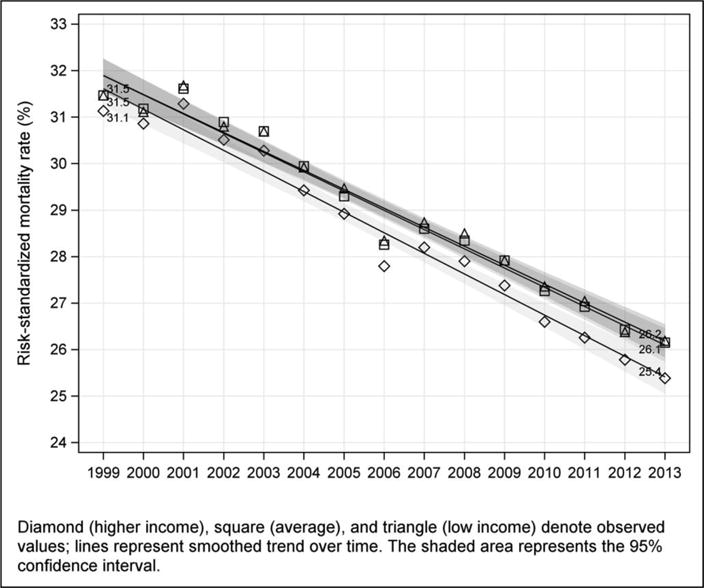
Results: In the 15-year study period, AMI risk-standardized hospitalization and mortality rates decreased significantly for all 3 county income groups. Mean hospitalization rates were significantly higher among low-income counties compared with high-income counties in 1999 (1353 vs 1123 per 100 000 person-years, respectively) and in 2013 (853 vs 648 per 100 000 person-years, respectively). One-year mortality rates after hospitalization for AMI were similar across county income groups, decreasing from 1999 (31.5%, 31.4%, and 31.1%, for high-, average-, and low-income counties, respectively) to 2013 (26.2%, 26.1%, and 25.4%, respectively). Income was associated with county-level, risk-standardized AMI hospitalization rates but not mortality rates. Increasing 1 interquartile range of median county consumer price index-adjusted income ($12 000) was associated with a decline in 46 and 37 hospitalizations per 100 000 person-years for 1999 and 2013, respectively; interaction between income and time was 0.56. The rate of decline in AMI hospitalizations was similar for all county income groups; however, low-income counties lagged behind high-income counties by 4.3 (95% CI, 3.1-5.9) years. There were no significant differences in trends across geographic regions.
Conclusions and relevance: Hospitalization and mortality rates of AMI declined among counties of all income levels, although hospitalization rates among low-income counties lag behind those of the higher income groups. These findings lend support for a more targeted, community-based approach to AMI prevention.
Figures


Comment in
-
Looking Beyond the Hospital to Reduce Acute Myocardial Infarction: Progress and Potential.JAMA Cardiol. 2016 Jun 1;1(3):251-3. doi: 10.1001/jamacardio.2016.0544. JAMA Cardiol. 2016. PMID: 27438101 No abstract available.
References
-
- Cooper R, Cutler J, Desvigne-Nickens P, et al. Trends and Disparities in Coronary Heart Disease, Stroke, and Other Cardiovascular Diseases in the United States Findings of the National Conference on Cardiovascular Disease Prevention. Circulation. 2000;102(25):3137–47. - PubMed
-
- Diez Roux AV, Merkin SS, Arnett D, et al. Neighborhood of residence and incidence of coronary heart disease. N Engl J Med. 2001;345(2):99–106. - PubMed
-
- Alter DA, Chong A, Austin PC, et al. Socioeconomic Status and Mortality after Acute Myocardial Infarction. Ann Intern Med. 2006;144(2):82–93. - PubMed
Publication types
MeSH terms
Grants and funding
LinkOut - more resources
Full Text Sources
Other Literature Sources
Medical
Miscellaneous