

Melatonin suppresses autophagy in type 2 diabetic osteoporosis
- PMID: 27438148
- PMCID: PMC5239543
- DOI: 10.18632/oncotarget.10538
Melatonin suppresses autophagy in type 2 diabetic osteoporosis
Abstract
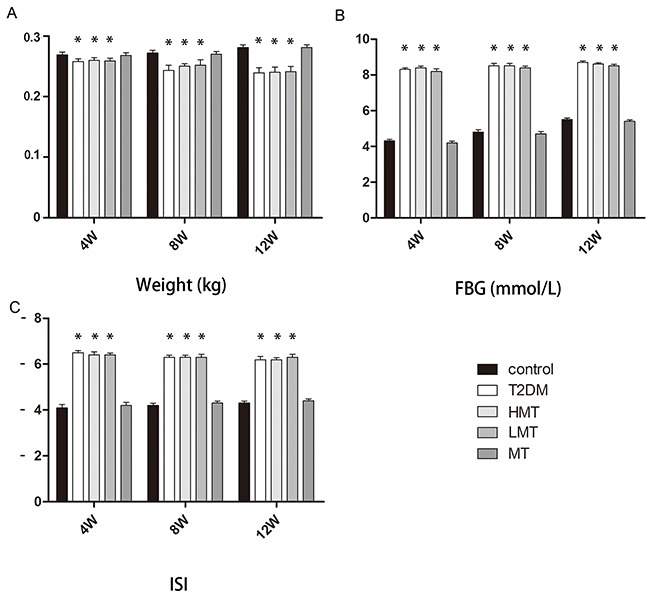
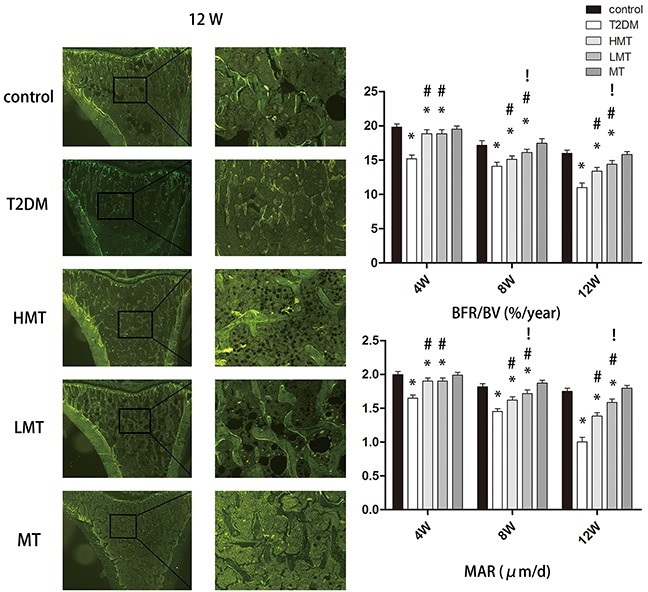
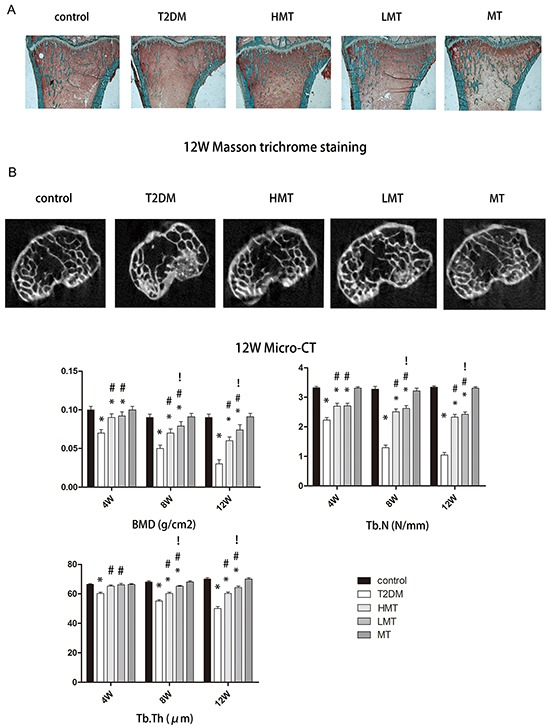
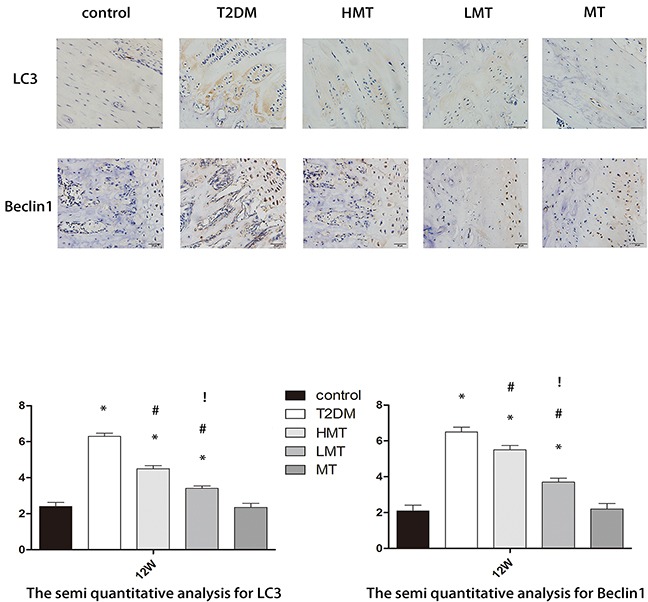
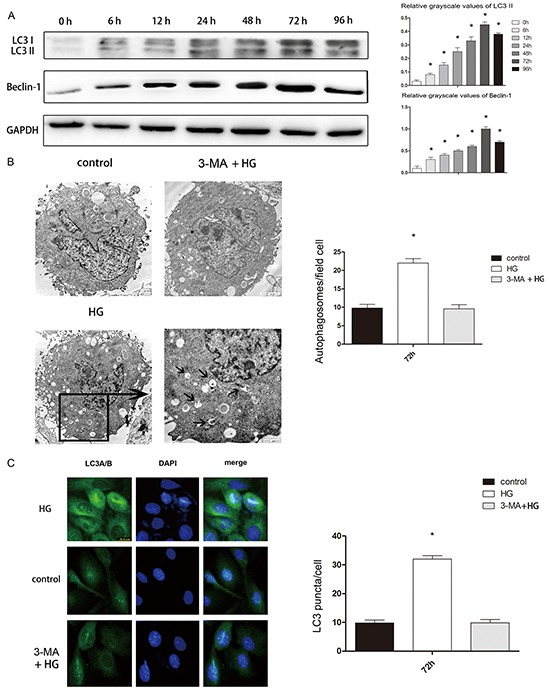
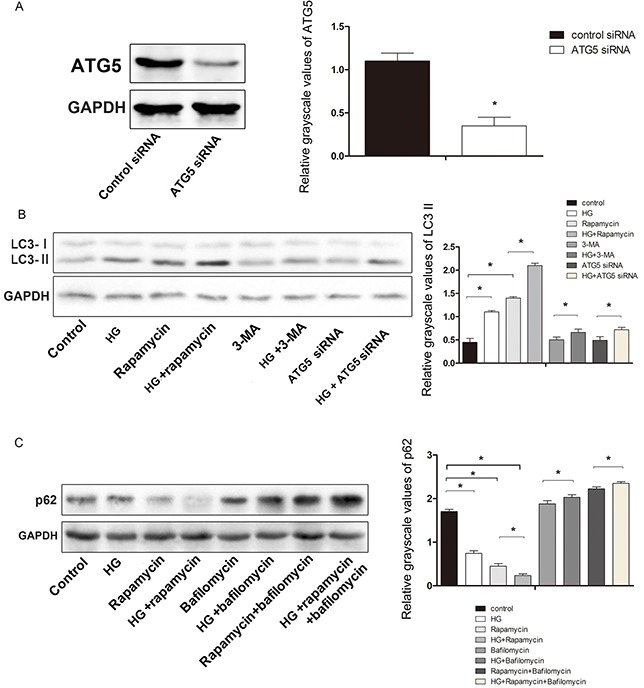
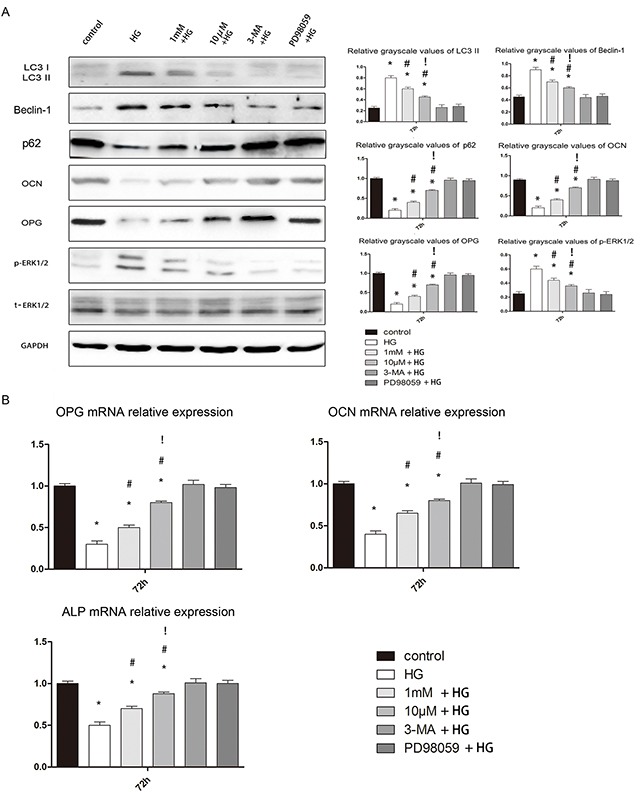
Type 2 diabetes mellitus is often complicated by osteoporosis, a process which may involve osteoblast autophagy. As melatonin suppresses autophagy under certain conditions, we its investigated the effects on bone autophagy during diabetes. We first assessed different body parameters in a diabetic rat model treated with various concentrations of melatonin. Dynamic biomechanicalmeasurements, bone organization hard slice dyeing and micro-CT were used to observe the rat bone microstructure, and immunohistochemistry was used to determine levels of autophagy biomarkers. We also performed in vitro experiments on human fetal osteoblastic (hFOB1.19) cells cultured with high glucose, different concentrations of melatonin, and ERK pathway inhibitors. And we used Western blotting and immunofluorescence to measure the extent of osteogenesis and autophagy. We found that melatonin improved the bone microstructure in our rat diabetes model and reduced the level of autophagy(50 mg/kg was better than 100 mg/kg). Melatonin also enhanced osteogenesis and suppressed autophagy in osteoblasts cultured at high glucose levels (10 μM was better than 1 mM). This suggests melatonin may reduce the level of autophagy in osteoblasts and delay diabetes-induced osteoporosis by inhibiting the ERK signaling pathway.
Keywords: ERK; autophagy; melatonin; osteoblast; type 2 diabetes osteoporosis.
Conflict of interest statement
The authors declare that there is no conflict of interest associated with this manuscript.
Figures
Similar articles
-
Melatonin Suppresses Ferroptosis Induced by High Glucose via Activation of the Nrf2/HO-1 Signaling Pathway in Type 2 Diabetic Osteoporosis.Oxid Med Cell Longev. 2020 Dec 4;2020:9067610. doi: 10.1155/2020/9067610. eCollection 2020. Oxid Med Cell Longev. 2020. PMID: 33343809 Free PMC article.
-
Selenium nanoparticles stimulate osteoblast differentiation via BMP-2/MAPKs/β-catenin pathway in diabetic osteoporosis.Nanomedicine (Lond). 2022 Apr;17(9):607-625. doi: 10.2217/nnm-2021-0401. Epub 2022 Apr 25. Nanomedicine (Lond). 2022. PMID: 35465693
-
Melatonin Suppresses Autophagy Induced by Clinostat in Preosteoblast MC3T3-E1 Cells.Int J Mol Sci. 2016 Apr 8;17(4):526. doi: 10.3390/ijms17040526. Int J Mol Sci. 2016. PMID: 27070587 Free PMC article.
-
[The effect of melatonin on bone tissue metabolism].Fiziol Zh (1994). 2014;60(2):102-9. Fiziol Zh (1994). 2014. PMID: 25007529 Review. Ukrainian.
-
Novel bromomelatonin derivatives as potentially effective drugs to treat bone diseases.J Pineal Res. 2008 Oct;45(3):229-34. doi: 10.1111/j.1600-079X.2008.00623.x. Epub 2008 Aug 5. J Pineal Res. 2008. PMID: 18691356 Review.
Cited by
-
Melatonin Protects Neural Stem Cells Against Tri-Ortho-Cresyl Phosphate-Induced Autophagy.Front Mol Neurosci. 2020 Mar 6;13:25. doi: 10.3389/fnmol.2020.00025. eCollection 2020. Front Mol Neurosci. 2020. PMID: 32210763 Free PMC article.
-
Efficacy of Opportunistic Screening with Chest CT in Identifying Osteoporosis and Osteopenia in Patients with T2DM.Diabetes Metab Syndr Obes. 2024 May 27;17:2155-2163. doi: 10.2147/DMSO.S462065. eCollection 2024. Diabetes Metab Syndr Obes. 2024. PMID: 38827165 Free PMC article.
-
Insight into the roles of melatonin in bone tissue and bone‑related diseases (Review).Int J Mol Med. 2021 May;47(5):82. doi: 10.3892/ijmm.2021.4915. Epub 2021 Mar 24. Int J Mol Med. 2021. PMID: 33760138 Free PMC article. Review.
-
eIF2α signaling regulates autophagy of osteoblasts and the development of osteoclasts in OVX mice.Cell Death Dis. 2019 Dec 4;10(12):921. doi: 10.1038/s41419-019-2159-z. Cell Death Dis. 2019. PMID: 31801950 Free PMC article.
-
Melatonin Suppresses Ferroptosis Induced by High Glucose via Activation of the Nrf2/HO-1 Signaling Pathway in Type 2 Diabetic Osteoporosis.Oxid Med Cell Longev. 2020 Dec 4;2020:9067610. doi: 10.1155/2020/9067610. eCollection 2020. Oxid Med Cell Longev. 2020. PMID: 33343809 Free PMC article.
References
-
- Fonseca BM, Almada M, Costa MA, Teixeira NA, Correia-da-Silva G. Rat spontaneous foetal resorption: altered alpha2-macroglobulin levels and uNK cell number. Histochemistry and cell biology. 2014;142:693–701. - PubMed
-
- Uslu S, Uysal A, Oktem G, Yurtseven M, Tanyalcin T, Basdemir G. Constructive effect of exogenous melatonin against osteoporosis after ovariectomy in rats. Anal Quant Cytol Histol. 2007;29:317–325. - PubMed
-
- Park KH, Kang JW, Lee EM, Kim JS, Rhee YH, Kim M, Jeong SJ, Park YG, Kim SH. Melatonin promotes osteoblastic differentiation through the BMP/ERK/Wnt signaling pathways. Journal of pineal research. 2011;51:187–194. - PubMed
-
- Maria S, Witt-Enderby PA. Melatonin effects on bone: potential use for the prevention and treatment for osteopenia, osteoporosis, and periodontal disease and for use in bone-grafting procedures. Journal of pineal research. 2014;56:115–125. - PubMed
MeSH terms
Substances
LinkOut - more resources
Full Text Sources
Other Literature Sources
Medical
Research Materials
Miscellaneous
