. 2017 Jan;282(1):182-193.
doi: 10.1148/radiol.2016151391. Epub 2016 Jul 20.

Predictors of CT Radiation Dose and Their Effect on Patient Care: A Comprehensive Analysis Using Automated Data

Affiliations

Predictors of CT Radiation Dose and Their Effect on Patient Care: A Comprehensive Analysis Using Automated Data

Rebecca Smith-Bindman et al. Radiology. 2017 Jan.

Abstract

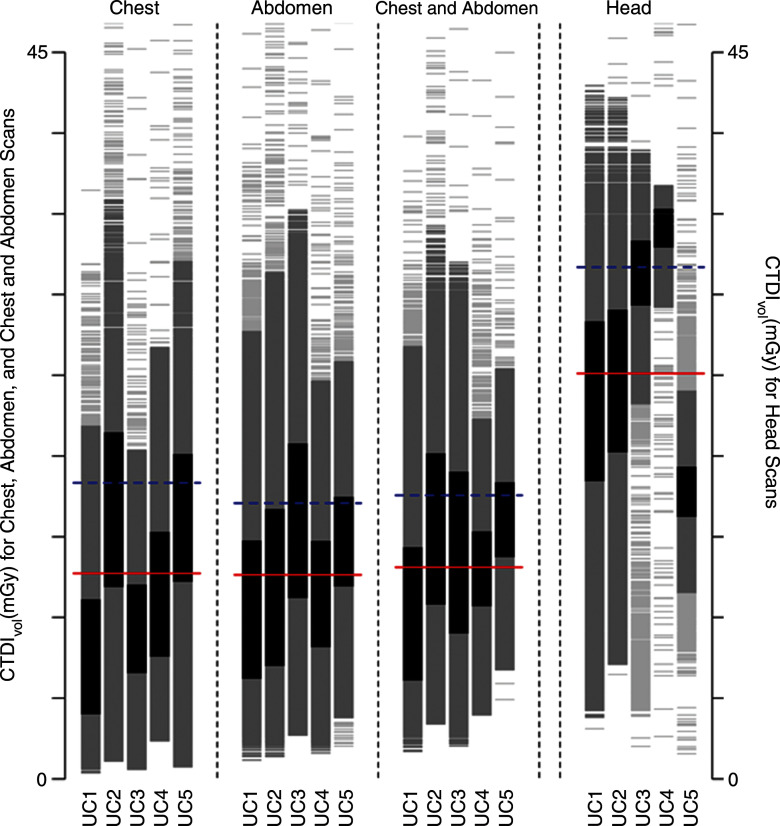
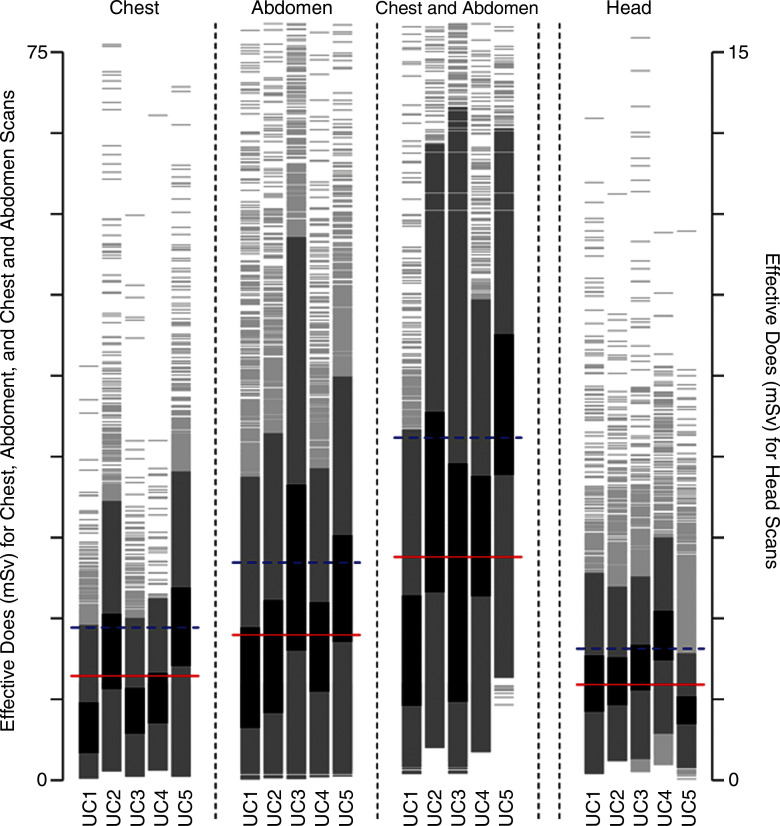
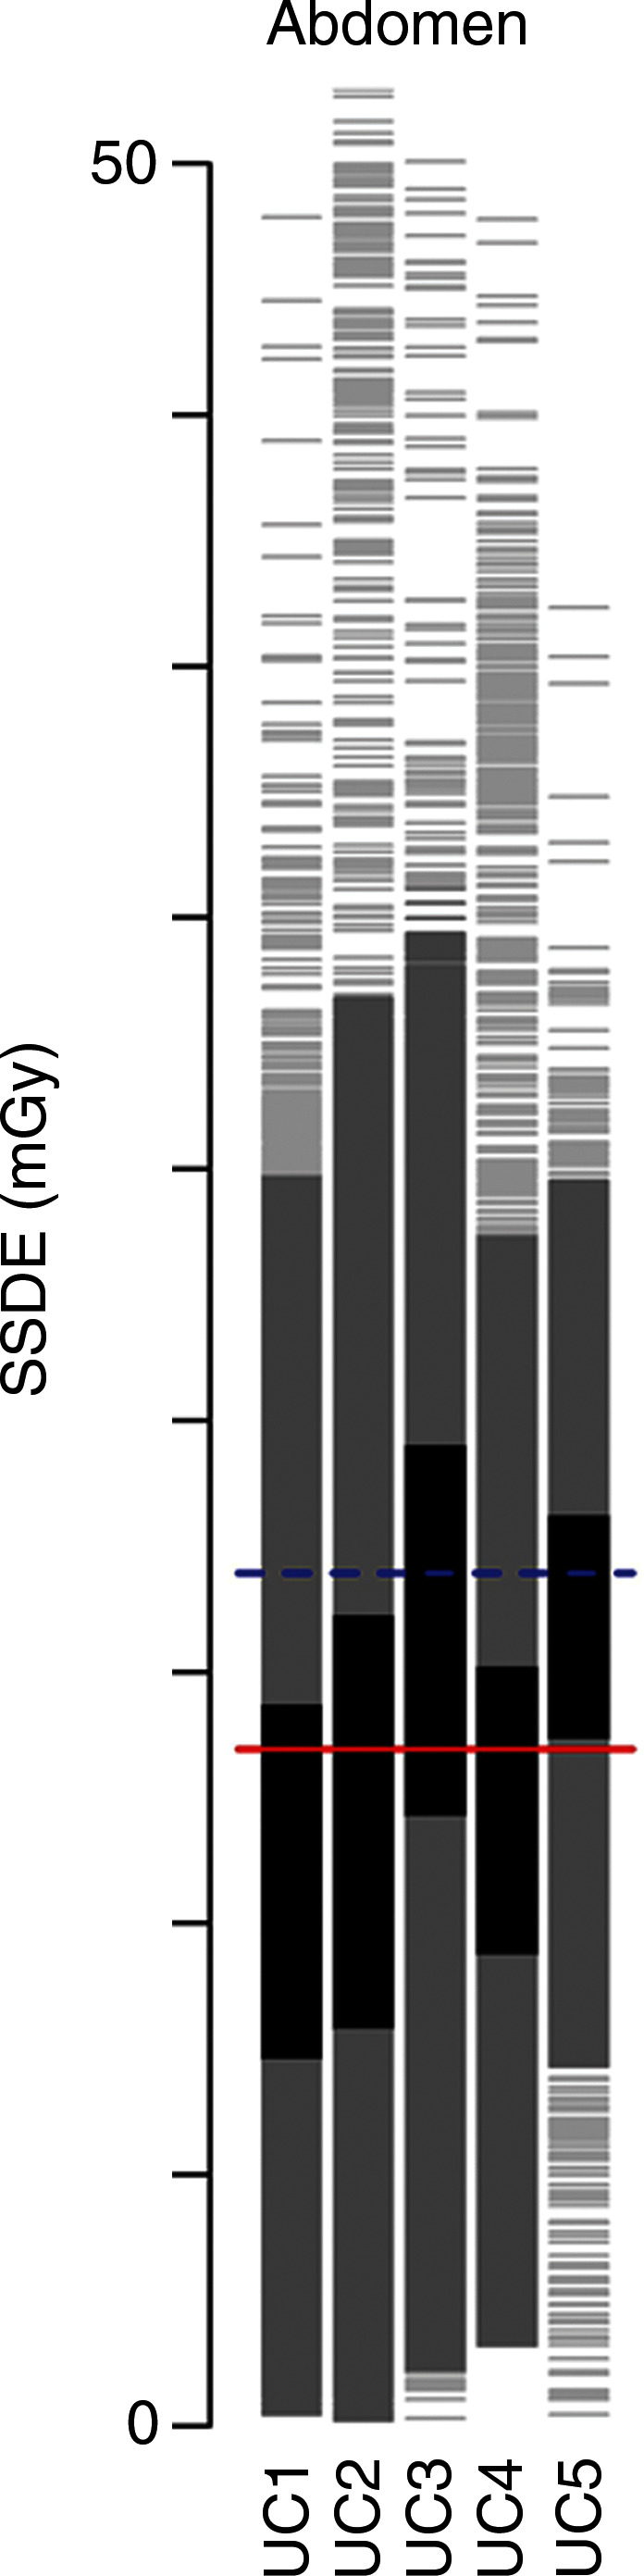
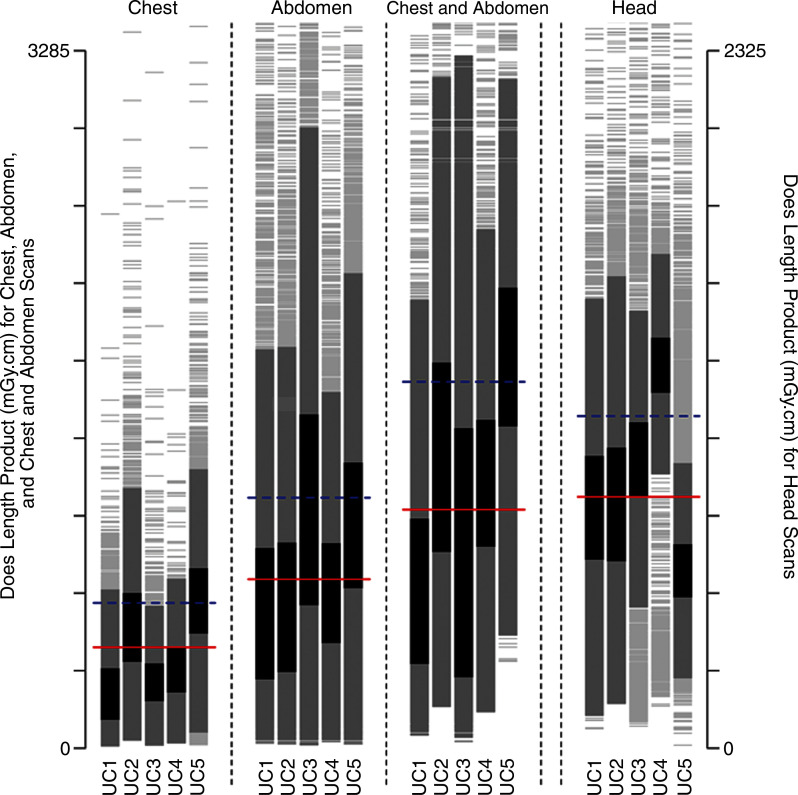
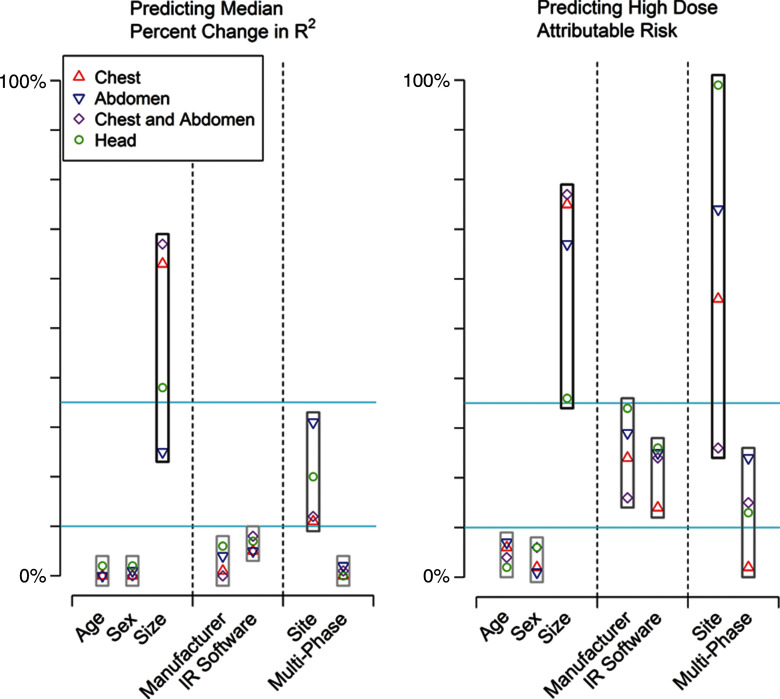
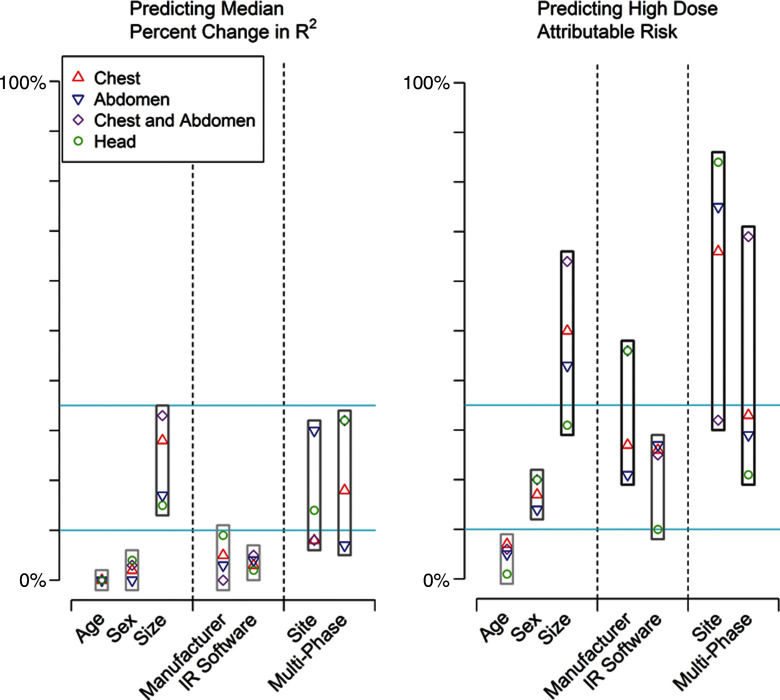
Purpose To determine patient, vendor, and institutional factors that influence computed tomography (CT) radiation dose. Materials and Methods The relevant institutional review boards approved this HIPAA-compliant study, with waiver of informed consent. Volume CT dose index (CTDIvol) and effective dose in 274 124 head, chest, and abdominal CT examinations performed in adult patients at 12 facilities in 2013 were collected prospectively. Patient, vendor, and institutional characteristics that could be used to predict (a) median dose by using linear regression after log transformation of doses and (b) high-dose examinations (top 25% of dose within anatomic strata) by using modified Poisson regression were assessed. Results There was wide variation in dose within and across medical centers. For chest CTDIvol, overall median dose across all institutions was 11 mGy, and institutional median dose was 7-16 mGy. Models including patient, vendor, and institutional factors were good for prediction of median doses (R2 = 0.31-0.61). The specific institution where the examination was performed (reflecting the specific protocols used) accounted for a moderate to large proportion of dose variation. For chest CTDIvol, unadjusted median CTDIvol was 16.5 mGy at one institution and 6.7 mGy at another (adjusted relative median dose, 2.6 mGy [95% confidence interval: 2.5, 2.7]). Several variables were important predictors that a patient would undergo high-dose CT. These included patient size, the specific institution where CT was performed, and the use of multiphase scanning. For example, while 49% of patients (21 411 of 43 696) who underwent multiphase abdominal CT had a high-dose examination, 8% of patients (4977 of 62 212) who underwent single-phase CT had a high-dose examination (adjusted relative risk, 6.20 [95% CI: 6.17, 6.23]). If all patients had been examined with single-phase CT, 69% (18 208 of 26 388) of high-dose examinations would have been eliminated. Patient size, institutional-specific protocols, and multiphase scanning were the most important predictors of dose (change in R2 = 8%-32%), followed by manufacturer and iterative reconstruction (change in R2, 0.2%-15.0%). Conclusion CT doses vary considerably within and across facilities. The primary factors that influenced dose variation were multiphase scanning and institutional protocol choices. It is unknown if the variation in these factors influenced diagnostic accuracy. © RSNA, 2016.


Conflict of interest statement

Disclosures of Conflicts of Interest: R.S. disclosed no relevant relationships. Y.W. disclosed no relevant relationships. T.R.N. disclosed no relevant relationships. M.M. disclosed no relevant relationships. N.W. disclosed no relevant relationships. R.G. disclosed no relevant relationships. A.S. Activities related to the present article: disclosed no relevant relationships. Activities not related to the present article: is a Bayer-Radimetrics advisory board member, with supported travel costs to one meeting. Other relationships: disclosed no relevant relationships. J.M.B. Activities related to the present article: disclosed no relevant relationships. Activities not related to the present article: disclosed no relevant relationships. Other relationships: holds patent 7,627,079, with royalties received from Samsung. M.K. disclosed no relevant relationships. R.L. disclosed no relevant relationships. D.J.H. disclosed no relevant relationships. D.L.M. disclosed no relevant relationships.

Figures

Figure 1a:
Figure 1a:
Distribution of dose metrics across the University of California Medical Centers for (a) CTDIvol and (b) effective dose. Vertical lines show the distribution of dose within an institution. Examinations between the 25th and 75th percentiles of each institution are darkest gray; examinations within 1.5 standard deviations of the median are medium gray; remaining examinations are light gray. Red lines show the median dose calculated across the five medical centers; blue lines show the 75th percentile in dose distribution calculated across all medical centers. (c) The 75th percentile in dose was defined for CTDIvol as 17.8 mGy for chest, 17.2 mGy for abdomen, 17.2 mGy for combined chest and abdomen, and 59.4 mGy for head. (d) The 75th percentile in dose was defined for effective dose as 14.9 mSv for chest, 21.2 mSv for abdomen, 33.1 mSv for combined chest and abdomen, and 2.8 mSv for head. The 75th percentile in dose for SSDE was defined as 19.2 mGy. Distribution of dose within each institution and anatomic area is shown with a vertical line, and horizontal lines indicate median dose (red line) and 75th percentile in dose (blue line) calculated across all five University of California medical centers for that anatomic area.
Figure 1b:
Figure 1b:
Distribution of dose metrics across the University of California Medical Centers for (a) CTDIvol and (b) effective dose. Vertical lines show the distribution of dose within an institution. Examinations between the 25th and 75th percentiles of each institution are darkest gray; examinations within 1.5 standard deviations of the median are medium gray; remaining examinations are light gray. Red lines show the median dose calculated across the five medical centers; blue lines show the 75th percentile in dose distribution calculated across all medical centers. (c) The 75th percentile in dose was defined for CTDIvol as 17.8 mGy for chest, 17.2 mGy for abdomen, 17.2 mGy for combined chest and abdomen, and 59.4 mGy for head. (d) The 75th percentile in dose was defined for effective dose as 14.9 mSv for chest, 21.2 mSv for abdomen, 33.1 mSv for combined chest and abdomen, and 2.8 mSv for head. The 75th percentile in dose for SSDE was defined as 19.2 mGy. Distribution of dose within each institution and anatomic area is shown with a vertical line, and horizontal lines indicate median dose (red line) and 75th percentile in dose (blue line) calculated across all five University of California medical centers for that anatomic area.
Figure 1c:
Figure 1c:
Distribution of dose metrics across the University of California Medical Centers for (a) CTDIvol and (b) effective dose. Vertical lines show the distribution of dose within an institution. Examinations between the 25th and 75th percentiles of each institution are darkest gray; examinations within 1.5 standard deviations of the median are medium gray; remaining examinations are light gray. Red lines show the median dose calculated across the five medical centers; blue lines show the 75th percentile in dose distribution calculated across all medical centers. (c) The 75th percentile in dose was defined for CTDIvol as 17.8 mGy for chest, 17.2 mGy for abdomen, 17.2 mGy for combined chest and abdomen, and 59.4 mGy for head. (d) The 75th percentile in dose was defined for effective dose as 14.9 mSv for chest, 21.2 mSv for abdomen, 33.1 mSv for combined chest and abdomen, and 2.8 mSv for head. The 75th percentile in dose for SSDE was defined as 19.2 mGy. Distribution of dose within each institution and anatomic area is shown with a vertical line, and horizontal lines indicate median dose (red line) and 75th percentile in dose (blue line) calculated across all five University of California medical centers for that anatomic area.
Figure 1d:
Figure 1d:
Distribution of dose metrics across the University of California Medical Centers for (a) CTDIvol and (b) effective dose. Vertical lines show the distribution of dose within an institution. Examinations between the 25th and 75th percentiles of each institution are darkest gray; examinations within 1.5 standard deviations of the median are medium gray; remaining examinations are light gray. Red lines show the median dose calculated across the five medical centers; blue lines show the 75th percentile in dose distribution calculated across all medical centers. (c) The 75th percentile in dose was defined for CTDIvol as 17.8 mGy for chest, 17.2 mGy for abdomen, 17.2 mGy for combined chest and abdomen, and 59.4 mGy for head. (d) The 75th percentile in dose was defined for effective dose as 14.9 mSv for chest, 21.2 mSv for abdomen, 33.1 mSv for combined chest and abdomen, and 2.8 mSv for head. The 75th percentile in dose for SSDE was defined as 19.2 mGy. Distribution of dose within each institution and anatomic area is shown with a vertical line, and horizontal lines indicate median dose (red line) and 75th percentile in dose (blue line) calculated across all five University of California medical centers for that anatomic area.
Figure 2a:
Figure 2a:
Importance of patient, vendor, and institutional variables in explaining variation in median change in R2 and high dose as attributable risk. IR = iterative reconstruction. For median (a) CTDIvol and (b) median effective dose, we categorized change in R2 and attributable risk as small (<10%), moderate (10%–25%), or large (>25%). Blue lines correspond to 10% and 25% values.
Figure 2b:
Figure 2b:
Importance of patient, vendor, and institutional variables in explaining variation in median change in R2 and high dose as attributable risk. IR = iterative reconstruction. For median (a) CTDIvol and (b) median effective dose, we categorized change in R2 and attributable risk as small (<10%), moderate (10%–25%), or large (>25%). Blue lines correspond to 10% and 25% values.

References

    1. Smith-Bindman R , Lipson J , Marcus R , et al . Radiation dose associated with common computed tomography examinations and the associated lifetime attributable risk of cancer . Arch Intern Med 2009. ; 169 ( 22 ): 2078 – 2086 . - PMC - PubMed
    1. Smith-Bindman R , Miglioretti DL , Johnson E , et al . Use of diagnostic imaging studies and associated radiation exposure for patients enrolled in large integrated health care systems, 1996–2010 . JAMA 2012. ; 307 ( 22 ): 2400 – 2409 . - PMC - PubMed
    1. Lukasiewicz A , Bhargavan-Chatfield M , Coombs L , et al . Radiation dose index of renal colic protocol CT studies in the United States: a report from the American College of Radiology National Radiology Data Registry . Radiology 2014. ; 271 ( 2 ): 445 – 451 . - PMC - PubMed
    1. Smith-Bindman R , Moghadassi M , Wilson N , et al . Radiation doses in consecutive CT examinations from five University of California medical centers . Radiology 2015. ; 277 ( 1 ): 134 – 141 . - PMC - PubMed
    1. Radimetrics Enterprise Platform. Bayer Web site. https://www.radiologysolutions.bayer.com/products/ct/dosemanagement/rep/. Updated June 2016. Accessed June 29, 2016 .