. 2016 Jul 21:6:30088.
doi: 10.1038/srep30088.

New Magnetic Resonance Imaging Index for Renal Fibrosis Assessment: A Comparison between Diffusion-Weighted Imaging and T1 Mapping with Histological Validation

Affiliations

New Magnetic Resonance Imaging Index for Renal Fibrosis Assessment: A Comparison between Diffusion-Weighted Imaging and T1 Mapping with Histological Validation

I Friedli et al. Sci Rep. .

Abstract

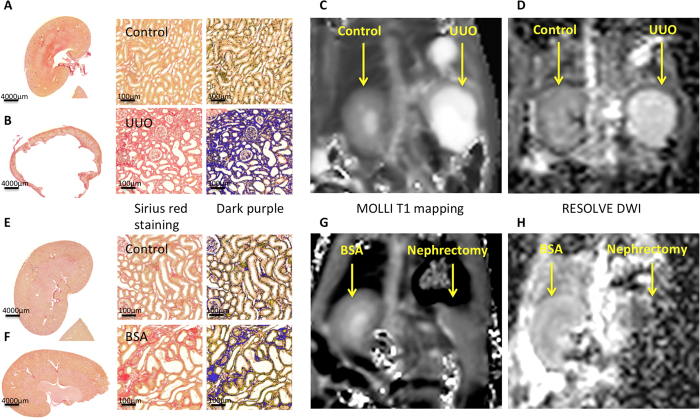
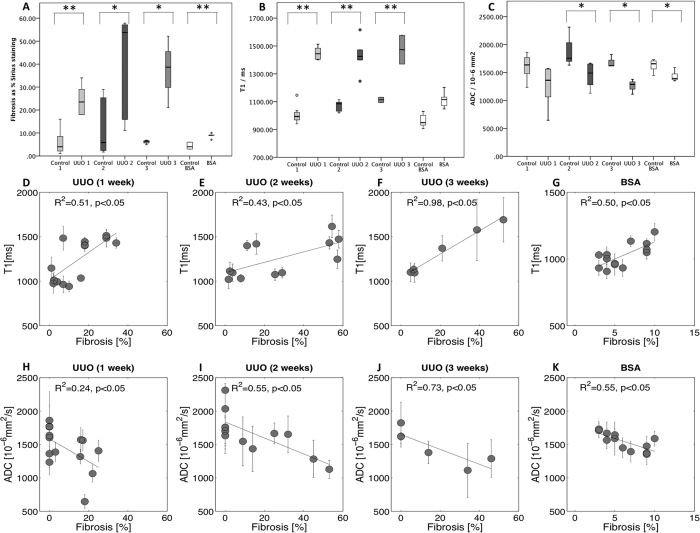
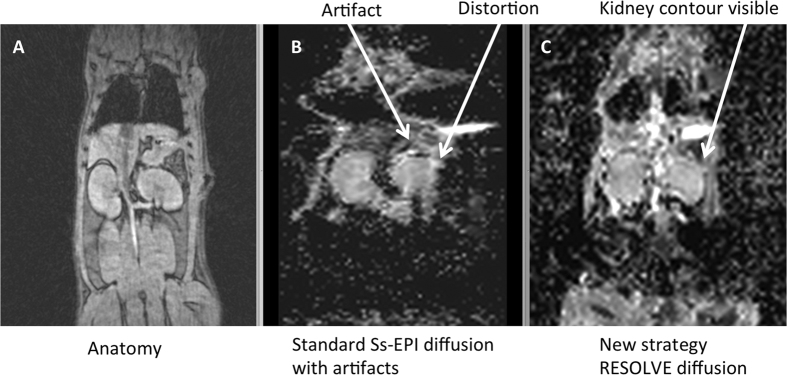
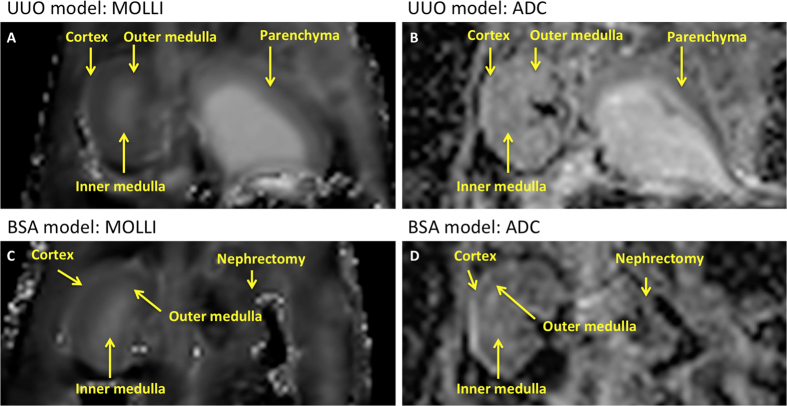
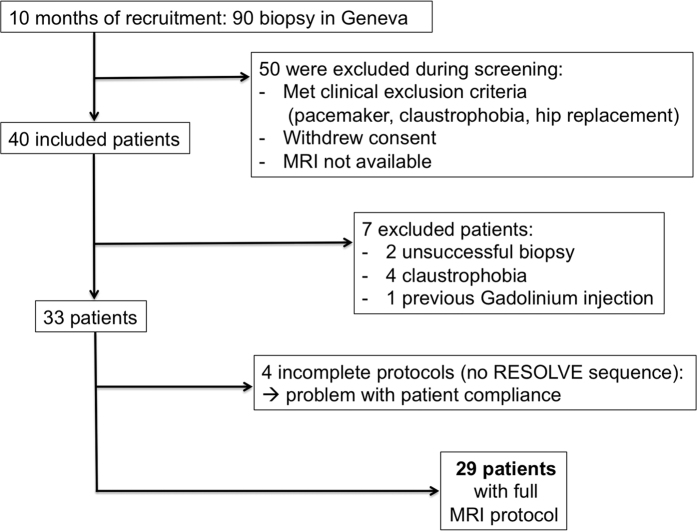
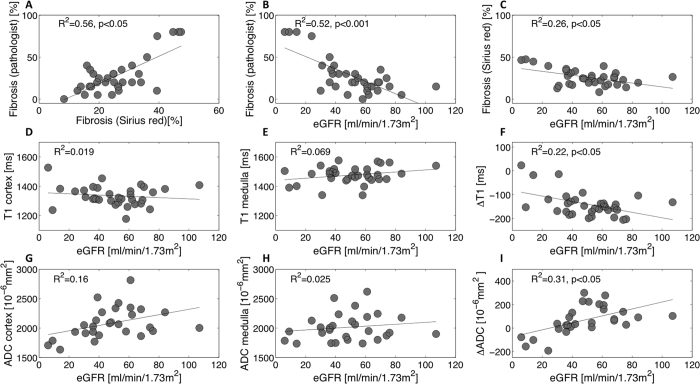
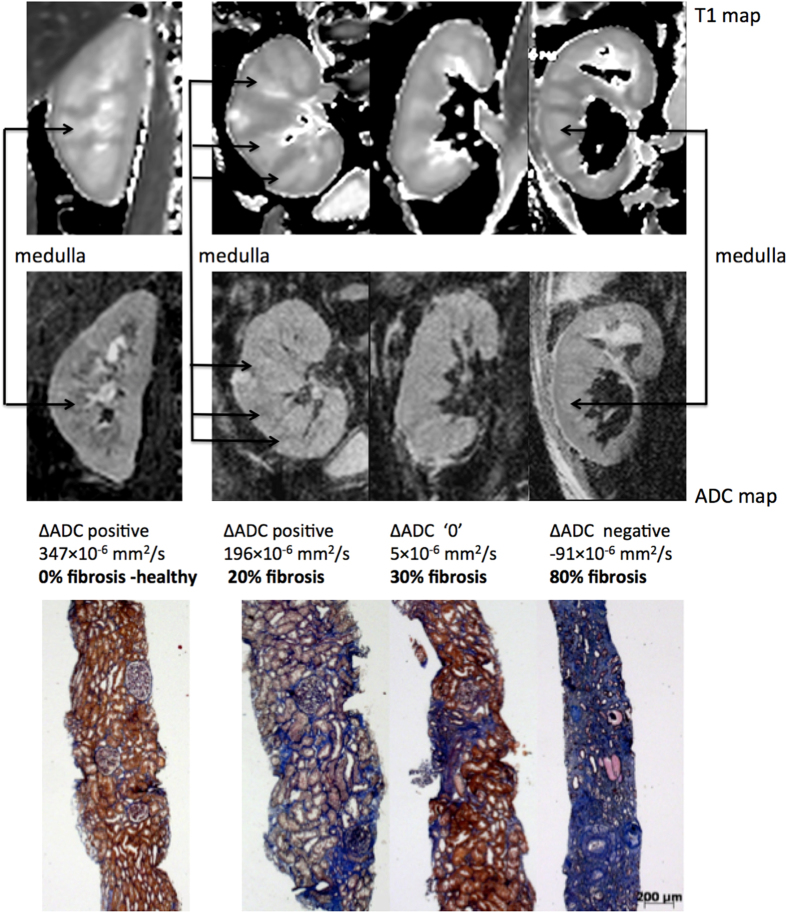
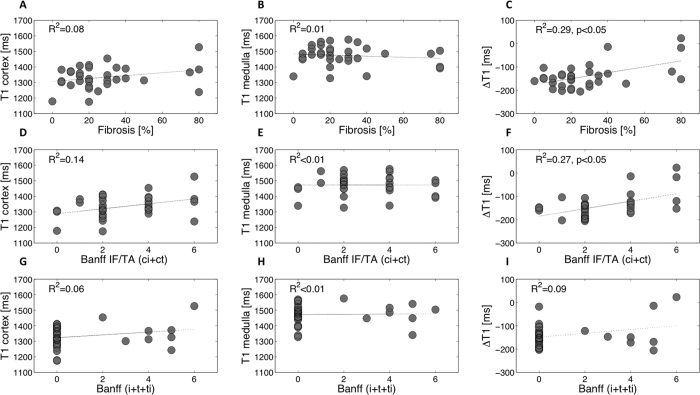
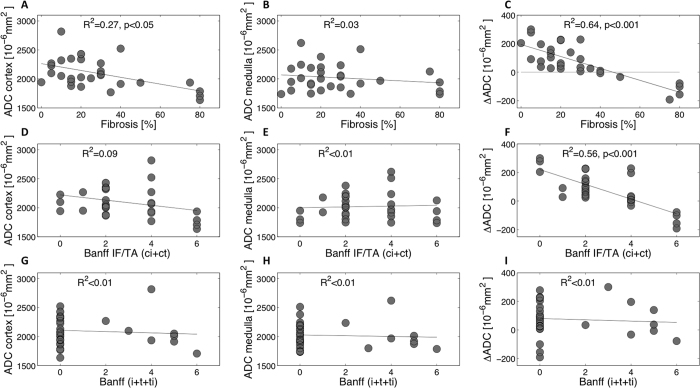
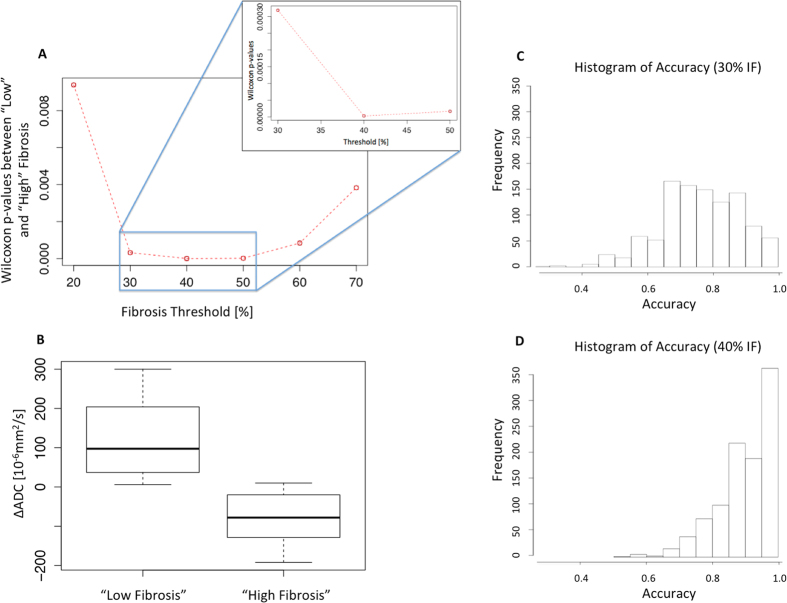
A need exists to noninvasively assess renal interstitial fibrosis, a common process to all kidney diseases and predictive of renal prognosis. In this translational study, Magnetic Resonance Imaging (MRI) T1 mapping and a new segmented Diffusion-Weighted Imaging (DWI) technique, for Apparent Diffusion Coefficient (ADC), were first compared to renal fibrosis in two well-controlled animal models to assess detection limits. Validation against biopsy was then performed in 33 kidney allograft recipients (KARs). Predictive MRI indices, ΔT1 and ΔADC (defined as the cortico-medullary differences), were compared to histology. In rats, both T1 and ADC correlated well with fibrosis and inflammation showing a difference between normal and diseased kidneys. In KARs, MRI indices were not sensitive to interstitial inflammation. By contrast, ΔADC outperformed ΔT1 with a stronger negative correlation to fibrosis (R(2) = 0.64 against R(2) = 0.29 p < 0.001). ΔADC tends to negative values in KARs harboring cortical fibrosis of more than 40%. Using a discriminant analysis method, the ΔADC, as a marker to detect such level of fibrosis or higher, led to a specificity and sensitivity of 100% and 71%, respectively. This new index has potential for noninvasive assessment of fibrosis in the clinical setting.


Figures

Figure 1
Figure 1
Representative histological and MR images of the unilateral ureteral obstruction (UUO) model at 2 weeks (A–D) and bovine serum albumin (BSA) nephritis model (E–H). Macroscopy of the contralateral normal (A) and obstructed kidneys (B) in the UUO model and the BSA (F) and sham kidneys (E) was followed by the zoomed Sirius red staining, and its threshold quantified in dark purple, showing severe fibrosis in the UUO model and moderate bands of fibrosis in the BSA model. Good quality coronal MRI images of MOLLI T1 maps (C,G) and RESOLVE ADC maps (D,H) were obtained for both the UUO and BSA models.
Figure 2
Figure 2. Histological and MRI results box plot for the UUO and BSA model.
The 3 boxes plot illustrate the differences between the control and the model for histological results (A), the mean T1 [ms] (B) and mean ADC [10−6 mm2/s] (C) for UUO and BSA: UUO at time point 1 week (UUO1), 2 weeks (UUO2), 3 weeks (UUO3) and BSA at time point 3 weeks. In UUO, the contralateral kidney served as control. Data were obtained in 29 rats (7 for UUO1, 6 for UUO2, 3 for UUO3, 5 in the BSA group and 8 controls), with p < 0.001 (**) and with p < 0.05 (*). (B) A highly significant difference in T1 was revealed between the control and obstructed kidneys in the UUO model at the three time points but only a trend was observed for the BSA model (p = 0.06). In all case, T1 strongly correlated with the percentage of cortical IF as assessed by Sirius red staining (R2 = 0.51 at 1 week (D), R2 = 0.43 at 2 weeks (E), R2 = 0.98 at 3 weeks (F), p < 0.05) and R2 = 0.50, p < 0.05 for the BSA 3 weeks (G). ADC was significantly different between the control and both the UUO model at 2 and 3 weeks (p = 0.013 and p = 0.014) and the BSA model (p = 0.007). The difference in ADC was not significant in the mild UUO model at time point 1 week (p = 0.052) (C). In all cases, ADC inversely correlated with the percentage of cortical IF as assessed by Sirius red staining (R2 = 0.24 at 1 week (H), R2 = 0.55 at 2 weeks (I), R2 = 0.73 at 3 weeks (J), p < 0.05) and R2 = 0.55, p < 0.05 for the BSA 3 weeks (K).
Figure 3
Figure 3. Comparison between single-shot (ss-EPI) and RESOLVE DWI MR sequences in a small animal.
Both DWI images were compared to GRE anatomical MR images (A). Standard ss-EPI MR sequences showed severe distortion at the kidney edges (B). In 14% of kidneys, for the ss-EPI images, the parenchyma completely disappeared due to distortions. RESOLVE MR sequences (C) considerably reduced artifact, enabling therefore analysis.
Figure 4
Figure 4
Representative T1 maps and ADC maps of the unilateral ureteral obstruction (UUO) model (A,B) and bovine serum albumin (BSA) nephritis model (C,D). First column, coronal MOLLI T1 maps in the UUO model (A) and in the BSA example (C) followed by coronal ADC map obtained with RESOLVE sequence (B,D). The renal cortex, and the outer and inner medulla were identified on the BSA model and sham, as well as the contralateral unobstructed kidney of the UUO rats. Layers were not distinguished on the left obstructed UUO kidney due to renal parenchyma atrophy.
Figure 5
Figure 5. Flowchart illustrating patient recruitment.
Figure 6
Figure 6. eGFR versus Fibrosis, T1 and ADC in kidney allograft recipients undergoing routine kidney biopsy (n = 32, 28 and 32).
eGFR was calculated using the CKD-EPI equation, except in one patient presenting with AKI at the time of biopsy. A strong positive correlation between IF estimated by pathologist-assessed Masson trichrome and IF quantified by Sirius red staining was measured (R2 = 0.56, p < 0.05) (A). Negative correlations were measured between IF (Masson trichrome) and eGFR (R2 = 0.52, p < 0.001) (B) and between IF (Sirius red) and eGFR (R2 = 0.26, p = 0.002) (C). T1 (cortex, medulla) and eGFR were non-correlated (R2 = 0.019 in the cortex (D) and R2 = 0.069 in the medulla (E)). However, the cortico-medullary difference ΔT1 showed a negative tendency with the increase of eGFR (F). Compared to cortex or medulla alone (G,H), ΔADC also improved the correlation with eGFR (R2 = 0.31, p < 0.05) (I).
Figure 7
Figure 7. Representative biopsy and MR images patients.
Morphological MOLLI T1 map used for the positioning of the regions of interest (top row) and ADC maps (lower row) for 3 patients showing the different ΔADC cases: positive, zero and negative; along with the corresponding fibrosis levels from histology (Masson trichrome staining).
Figure 8
Figure 8
Correlations between histopathological results (fibrosis estimated by pathological assessment of Masson trichrome (A–C), Banff IF/TA (ci+ct) (D–F) and Banff (i+t+ti) (G–I)) and T1 values in the cortex and medulla, and ΔT1 in 33 KARs. ΔT1 (in ms) was calculated as the difference between cortical and medullary T1. In all case, no correlation was found when comparing T1 to histopathological results in the cortex and medulla alone. A moderate correlation was found between ΔT1 and the percentage of cortical IF estimated by pathological assessment of Masson trichrome (C) and also, between ΔT1 and fibrosis estimated by Banff IF/TA (ci+ct) with respectively (R2 = 0.29 and R2 = 0.27, p < 0.05) (F).
Figure 9
Figure 9
Correlations between histopathological results (fibrosis estimated by pathological assessment of Masson trichrome (A–C), Banff IF/TA (ci+ct) (D–F) and Banff (i+t+ti) (G–I)) and ADC values in the cortex and medulla, and ΔADC of 29 KARs. ΔADC (in 10−6 mm2/s) was calculated as the difference between cortical and medullary ADC. Cortical IF (estimated by pathological assessment of Masson trichrome) was moderately correlated with cortical ADC (A) but strongly with ΔADC (R2 = 0.64, p < 0.001) (C). All patients with more than 40% IF presented a negative ΔADC. A strong negative correlation was also measured with Banff IF/TA (ci+ct), whereas no correlation with interstitial inflammation assessed by Banff (i+t+ti) was measured (G–I).
Figure 10
Figure 10. Evaluation of the limit at 40% IF for the definition of “Low Fibrosis” versus “High Fibrosis” detectable using the ΔADC index.
The percentage of IF was defined as binary factor using 2 groups: ‘Low Fibrosis’ and ‘High Fibrosis’. (A) Wilcoxon p-values between ‘Low Fibrosis’ and ‘High Fibrosis’ groups were computed for IF thresholds between 10% and 70% by increment of 10% (with zoom shown for 30% to 50%). The best separation between groups “Low Fibrosis” and “High Fibrosis” was found at a limit of 40% with the lowest p-value computed (p = 2.6 × 10−6). The other separating limits were 10% (p = 2.0 × 10−2), 20% (p = 9.4 × 10−3), 30% (p = 3.2 × 10−4), 40% (p = 2.6 × 10−6), 50%(p = 1.7 × 10−5), 60% (p = 8.4 × 10−5), 70% (p = 3.4 × 10−3). Due to the large p-value the 10% threshold is not included on the plot to keep the vertical scale of the remaining points visible. (B) Classification of each ΔADC with this limit at 40% into separate groups as ‘Low Fibrosis’ and ‘High Fibrosis’ groups. At this level of IF, KARs with positive ΔADC and KARs with negative ΔADC can be separated without overlap between the interquartile range (boxes). (C,D) The accuracy of the limit of 40% IF to separate ‘Low Fibrosis’ to ‘High Fibrosis’ groups according to the ΔADC was 91% with 95% CI [0.77–0.99]. Bootstrap values were shifted close to 1.0 at a level of 40% (D) compared to the accuracy distribution at 30% (C), indicating that 40% IF was more accurate to separate “Low” to “High” fibrosis.

References

    1. Risdon R. A., Sloper J. C. & De Wardener H. E. Relationship between renal function and histological changes found in renal-biopsy specimens from patients with persistent glomerular nephritis. Lancet 2, 363–366 (1968). - PubMed
    1. Nankivell B. J. et al.. Effect of histological damage on long-term kidney transplant outcome. Transplantation 71, 515–523 (2001). - PubMed
    1. Grimm P. C. et al.. Computerized image analysis of Sirius Red-stained renal allograft biopsies as a surrogate marker to predict long-term allograft function. Journal of the American Society of Nephrology: JASN 14, 1662–1668 (2003). - PubMed
    1. Cosio F. G. et al.. Kidney allograft fibrosis and atrophy early after living donor transplantation. American journal of transplantation: official journal of the American Society of Transplantation and the American Society of Transplant Surgeons 5, 1130–1136, doi: 10.1111/j.1600-6143.2005.00811.x (2005). - DOI - PubMed
    1. Cosio F. G. et al.. Predicting subsequent decline in kidney allograft function from early surveillance biopsies. American journal of transplantation: official journal of the American Society of Transplantation and the American Society of Transplant Surgeons 5, 2464–2472, doi: 10.1111/j.1600-6143.2005.01050.x (2005). - DOI - PubMed

Publication types