. 2016 Sep 1;197(5):2027-38.
doi: 10.4049/jimmunol.1600727. Epub 2016 Jul 20.

A Simple, Versatile Antibody-Based Barcoding Method for Flow Cytometry

Affiliations

A Simple, Versatile Antibody-Based Barcoding Method for Flow Cytometry

Billur Akkaya et al. J Immunol. .

Abstract

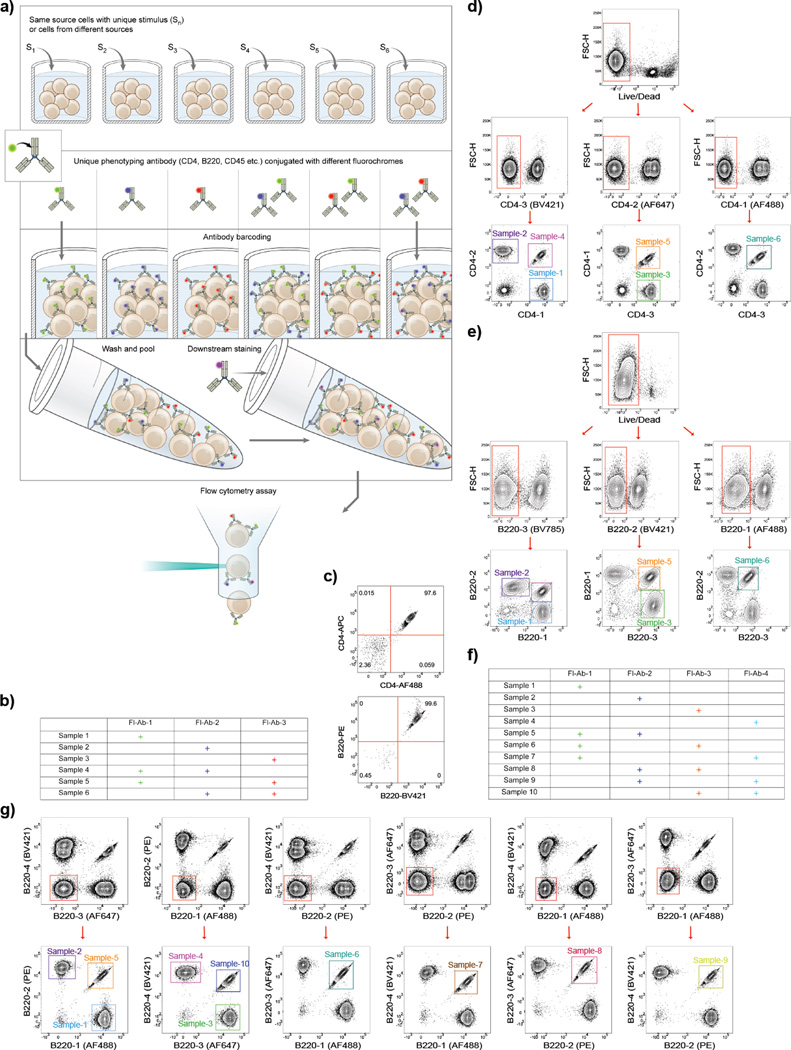
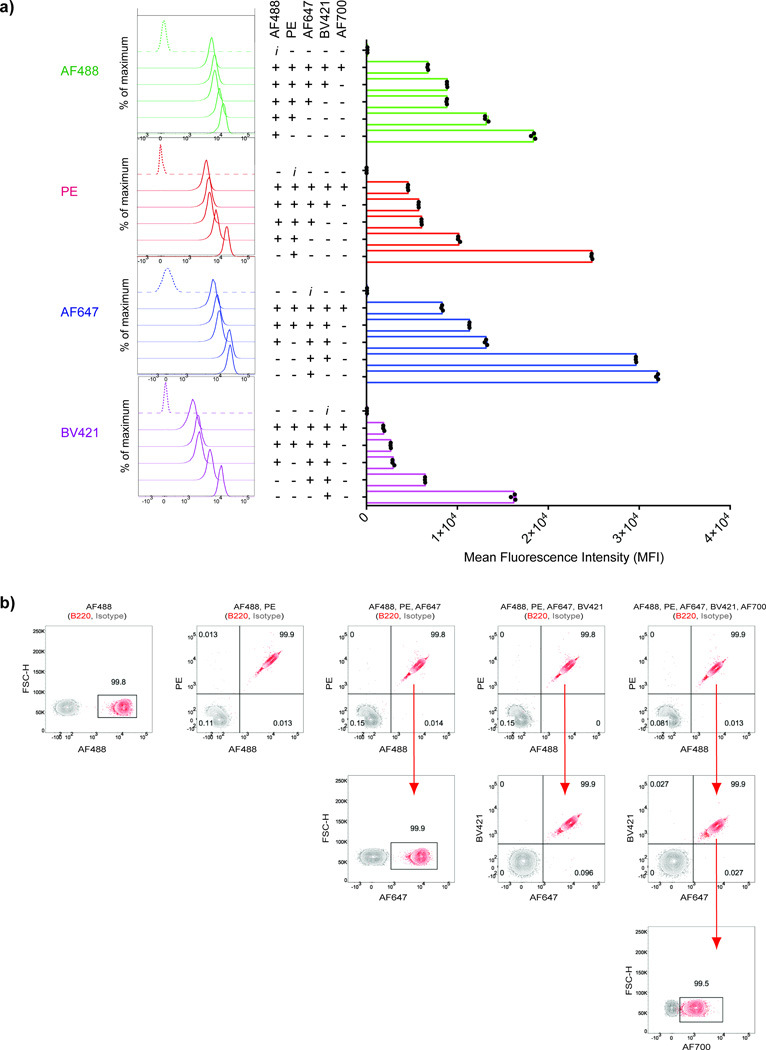
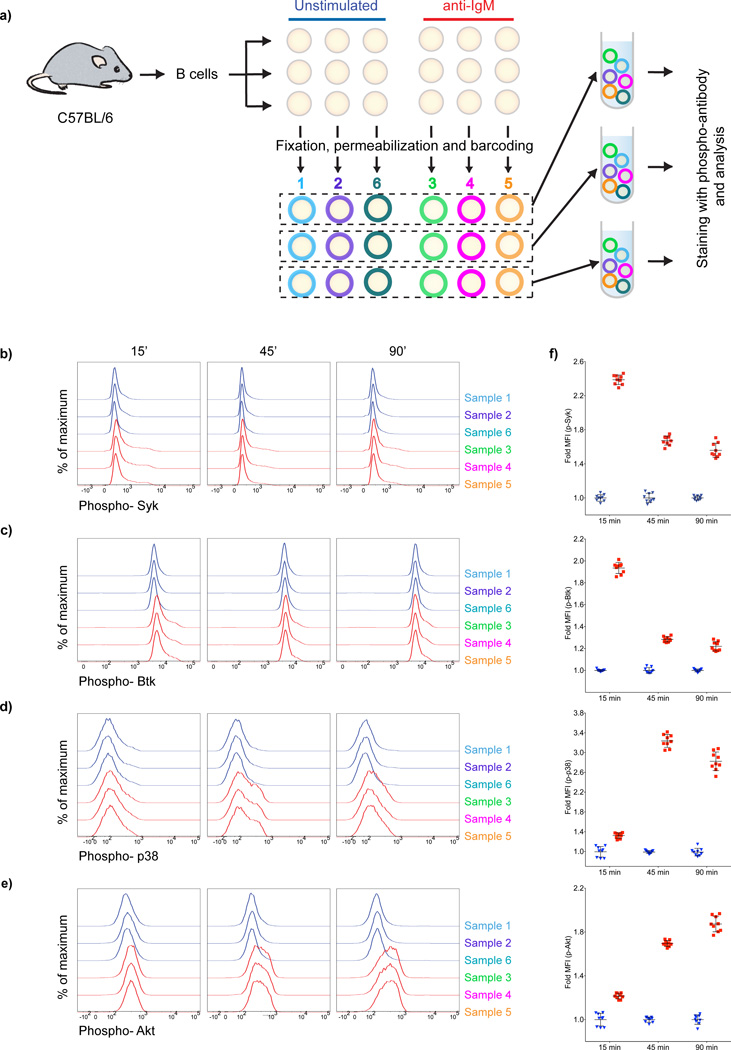
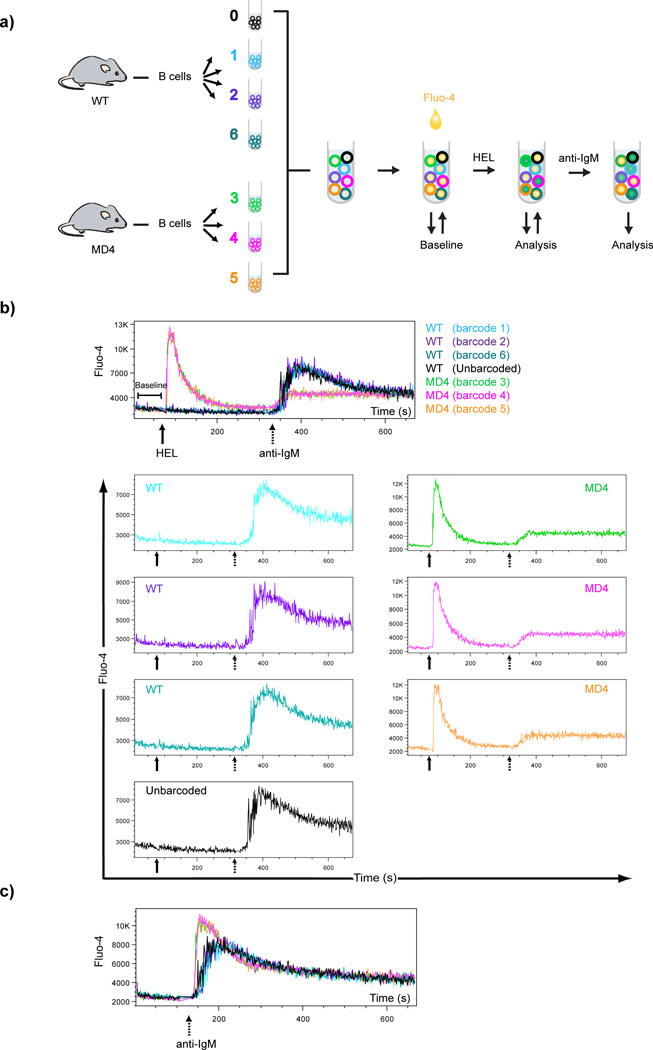
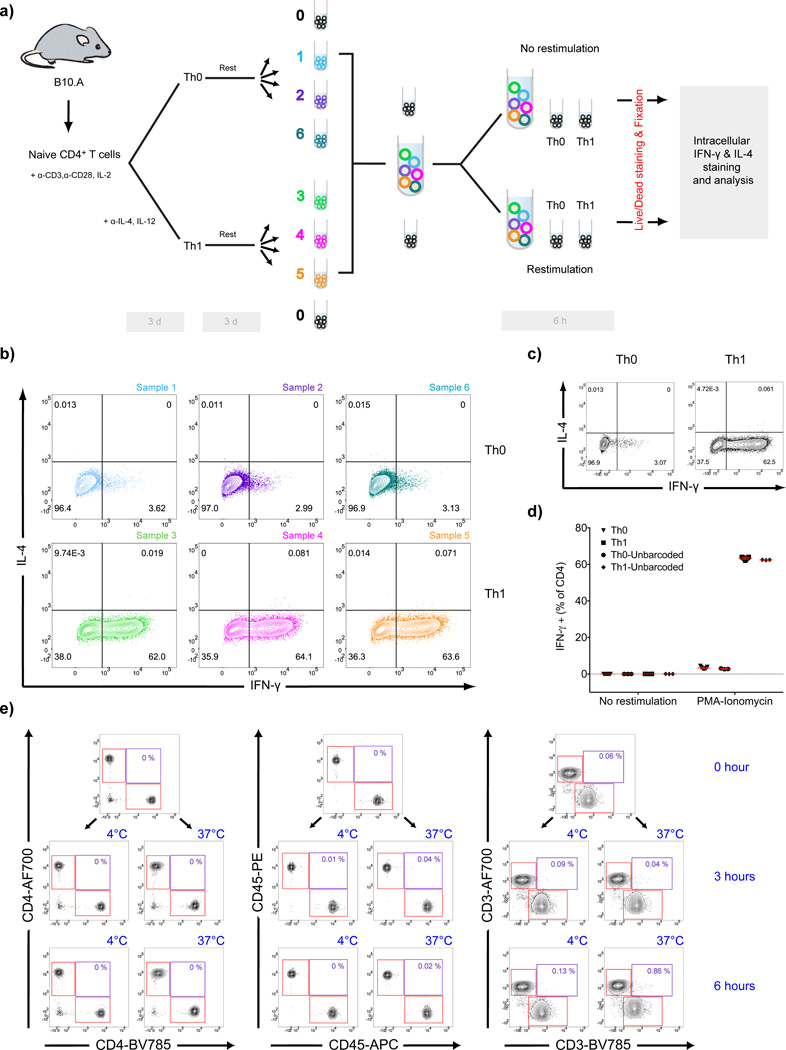
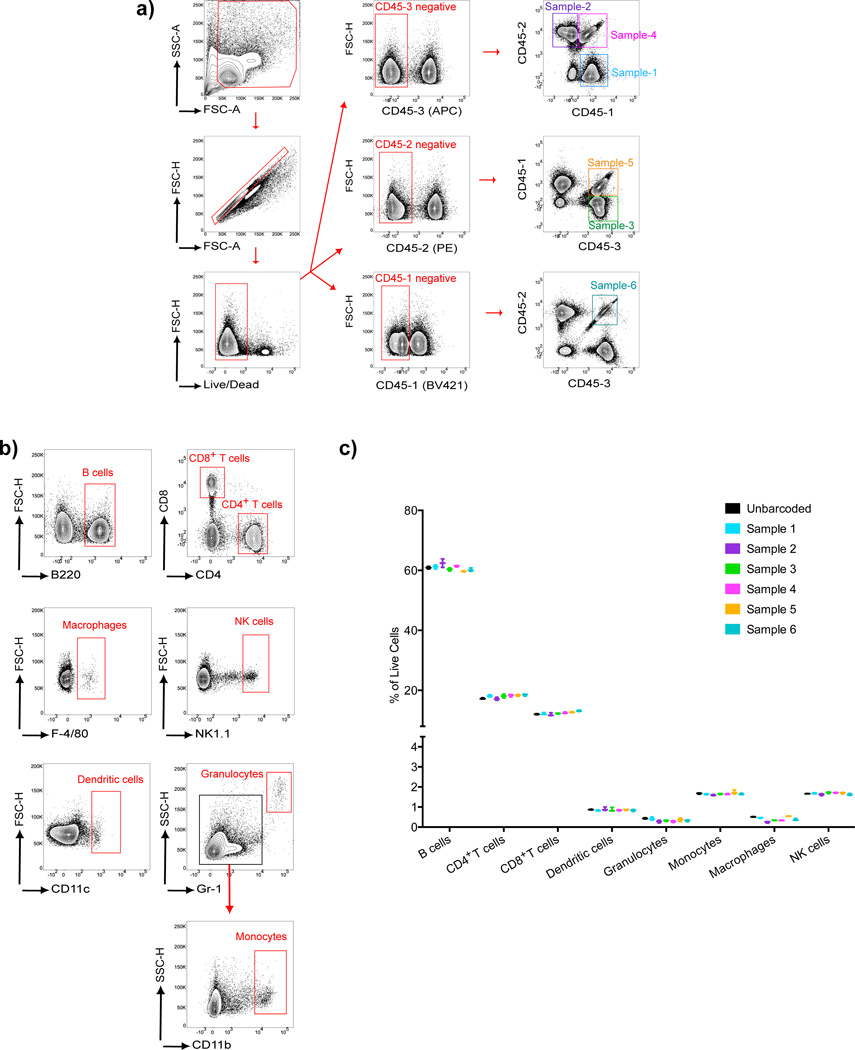
Barcoding of biological samples is a commonly used strategy to mark or identify individuals within a complex mixture. However, cell barcoding has not yet found wide use in flow cytometry that would benefit greatly from the ability to analyze pooled experimental samples simultaneously. This is due, in part, to technical and practical limitations of current fluorescent dye-based methods. In this study, we describe a simple, versatile barcoding strategy that relies on combinations of a single Ab conjugated to different fluorochromes and thus in principle can be integrated into any flow cytometry application. To demonstrate the efficacy of the approach, we describe the results of a variety of experiments using live cells as well as fixed and permeabilized cells. The results of these studies show that Ab-based barcoding provides a simple, practical method for identifying cells from individual samples pooled for analysis by flow cytometry that has broad applications in immunological research.


Conflict of interest statement

The authors declare that there are no conflicts of interest.

Figures

Figure 1
Figure 1
Ab-barcoding allows identification of T cells and B cells pooled from multiple samples. a) Key steps in barcoding cells using single- or double- stained combinations of three different Fl-Abs for flow cytometry are illustrated. b) Assignment of Fl-Abs to samples to generate six unique barcodes. c) Representative examples of uniformly double stained CD4+ T cells (top) and B cells (bottom) are shown. d–e) Stepwise gating strategy to identify individual populations T cells (d) and B cells (e) in a pool of cells containing six uniquely barcoded samples illustrated in (b) using anti-CD4-Fl-Abs for T cells and anti-B220-Fl-Abs for B cells. Gating steps prior to Live/Dead stage are as shown in (Supplementary Fig. 1). f–g) Representative example of barcoding using four different anti-B220-Fl-Abs in single- or double- stained combinations generating ten unique barcoding patterns as outlined in (f) and demonstrated in (g).
Figure 2
Figure 2
The decrease in the fluorescence intensity of individual Fl-Ab when combined with multiple other Fl-Abs does not interfere with the identification of barcoded populations. a) anti-B220-Fl-Abs conjugated to either AF488, PE, AF647, BV421 or AF700 and their isotype-matched controls were used to stain purified B cell populations in multiple combinations. The histograms (left) and the MFI values (right) for each fluorochrome are given in comparison with the fluorescently-labeled isotype control Ab. Individual values of triplicate observations are shown as black dots on the MFI column graph. b) B cell samples were stained using the combinations of anti-B220-Fl-Abs (red contour plots) or appropriate fluorescently-labeled isotype control Ab (grey contour plots) and analyzed by flow cytometry. Contour plots are superimposed to determine the boundaries of positive gates. Numbers refer to the percentages of cells positively stained with anti-B220-Fl-Abs for each flow cytometry plot. Results are representative of three independent observations.
Figure 3
Figure 3
Ab-based barcoding is effective in standardizing experiments using phospho-flow. (a) Purified mouse splenic B cells were divided into three sets of six samples each for each of three time points that were either unstimulated or stimulated with 10 µg/ml anti-IgM. Fifteen, 45 and 90 min later samples were fixed, permeabilized barcoded and pooled as shown. Pooled samples were stained with specific Abs and analyzed in flow cytometry. (b–e) Time-dependent changes in phosphorylation of Syk (b), Btk (c), p38 (d) and Akt (e) are shown as histogram overlays for both unstimulated cells (blue histograms corresponding to samples 1,2,6) and anti-IgM stimulated cells (red histograms corresponding to samples 3,4,5). f) Fold MFI with time after anti-IgM stimulation (red squares) and unstimulated controls (blue triangles). Each symbol represent one sample of the barcoded replicates. Error bars indicate the standard deviation. Results are representative of more than three independent experiments.
Figure 4
Figure 4
Ab-based barcoding as a means to standardize conditions in real time Ca2+ flux assays. a) Samples of B cells purified from WT C57BL/6 mice (barcodes 1,2,6 and unbarcoded) and HEL transgenic MD4 mice (barcodes 3,4,5) were barcoded, pooled and stained with Fluo4 as shown. After a baseline measurement, pooled sample were stimulated with approximately 2 µg/ml HEL protein and Ca2+ uptake analyzed for 5 min. Cells were then stimulated with approximately 10 µg/ml anti-IgM and Ca2+ uptake and analyzed for 5 min. b) Fluo4 intensity histogram overlays of all samples (top panel) as well as individual histograms (bottom panels) over time are shown. Continuous (HEL) and dotted (IgM) arrows indicate the time points when stimuli were added. c) Histograms of Fluo4 intensity for all samples treated with anti-IgM are shown. Data shown are representative of at least four independent experiments.
Figure 5
Figure 5
Ab-based barcoding is compatible with experiments requiring culturing in vitro to activate cells. a) Naïve CD4+ T cells obtained from B10.A mice were stimulated for 3 days by plate bound anti-CD3 and anti-CD28 in the presence of IL-2 alone to facilitate TH0 differentiation or in the presence of IL-2 plus anti-IL-4 and IL-12 to drive Th1 differentiation. Cells were then rested for an additional 3 days. Th0- and Th1-differentiated cells were divided into three samples that were barcoded, pooled and then either restimulated with cell stimulation cocktail or left unstimulated for 6 h. Separate aliquots of unbarcoded Th0- and Th1-differentiated cells were treated similarly. At the end of 6 h, cells were stained with Live/Dead marker, fixed, permeabilized, stained with anti-IL-4 and anti-IFN-γ and analyzed by flow cytometry. b) Representative flow cytometry plots showing the percentages of IFN-γ and/or IL-4 expressing barcoded cells for both Th0- (samples 1,2,6) and Th1- (samples 3,4,5) differentiated, restimulated cells. c) Representative flow cytometry plots showing the percentage of IL-4 and/or IFN-γ producing cells for unbarcoded, restimulated Th0- and Th1-differentiated cells. d) Percentages of IFN-γ+ cells for three sets of barcoded samples (yielding nine samples per condition) and three sets of unbarcoded samples (yielding three samples per condition) for Th0- and Th1-differentiated cells that were restimulated or not. Error bars indicate the standard deviation. e) T cell barcoding antibodies do not detach during short term culturing of live cells. Freshly isolated mouse CD4+ T cells were divided into two groups that were single stained with a different fluorochrome conjugation of the same barcoding antibody. Cells were washed and combined. Flow cytometry plots showing the initial staining of the mixture (0 hour) as well as the levels after incubation at either 4 °C or 37 °C for 3 or 6 hours are shown for CD4 (left panel), CD45 (middle panel) and CD3 (right panel). Single stained populations are shown with red rectangular gates and the double stained populations are shown with purple gates. Percentages refer to the frequency of double stained cells in the mixture. Data shown are representative of three independent experiments.
Figure 6
Figure 6
Ab-based barcoding applied to immune cell phenotyping. Splenocytes harvested from C57BL/6 mice were divided into six samples that were barcoded using three different anti-CD45-Fl-Abs and then pooled. The pooled samples and a separate unbarcoded sample of splenocytes were stained with immune cell phenotyping Abs specific for: B220, CD4, CD8, F4/80, NK1.1, CD11c, Gr1 or CD11b. a) Flow cytometry plots showing the gating strategy for the identification of the six uniquely barcoded cell samples. b) Gating strategy used for identification of B cells, T cells, macrophages, NK cells, dendritic cells, granulocytes and monocytes within the mixed splenocyte population. c) Cell subsets were quantified as the percentage of live cells within each barcoded sample and the unbarcoded sample and values obtained from three parallel sets of barcodes and three unbarcoded samples are given. Error bars show the range between the minimum and maximum of observed values. Results are representative of three independent experiments.

References

    1. Laerum OD, Farsund T. Clinical application of flow cytometry: a review. Cytometry. 1981;2:1–13. - PubMed
    1. Shapiro HM. Flow cytometric estimation of DNA and RNA content in intact cells stained with Hoechst 33342 and pyronin Y. Cytometry. 1981;2:143–150. - PubMed
    1. Shapiro HM. Flow cytometric probes of early events in cell activation. Cytometry. 1981;1:301–312. - PubMed
    1. Christensen ME, Jansen ES, Sanchez W, Waterhouse NJ. Flow cytometry based assays for the measurement of apoptosis-associated mitochondrial membrane depolarisation and cytochrome c release. Methods. 2013;61:138–145. - PubMed
    1. Krutzik PO, Clutter MR, Trejo A, Nolan GP. Fluorescent cell barcoding for multiplex flow cytometry. Curr Protoc Cytom. 2011;Chapter 6(Unit 6):31. - PMC - PubMed