. 2016 Dec;6(1):70.
doi: 10.1186/s13613-016-0167-z. Epub 2016 Jul 21.

Accuracy, reliability, feasibility and nurse acceptance of a subcutaneous continuous glucose management system in critically ill patients: a prospective clinical trial

Affiliations

Accuracy, reliability, feasibility and nurse acceptance of a subcutaneous continuous glucose management system in critically ill patients: a prospective clinical trial

Tobias Wollersheim et al. Ann Intensive Care. 2016 Dec.

Abstract

Background: Continuous glucose monitoring (CGM) has not yet been implemented in the intensive care unit (ICU) setting. The purpose of this study was to evaluate reliability, feasibility, nurse acceptance and accuracy of the Medtronic Sentrino(®) CGM system in critically ill patients.

Methods: Sensors were inserted into the subcutaneous tissue of the patient's thigh, quantifying interstitial glucose concentration for up to 72 h per sensor. Reliability and feasibility analysis included frequency of data display, data gaps and reasons for sensor removal. We surveyed nurse acceptance in a questionnaire. For the accuracy analysis, we compared sensor values to glucose values obtained via blood gas analysis. Potential benefits of CGM were investigated in intra-individual analyses of factors, such as glycemic variability or time in target range achieved with CGM compared to that achieved with intermittent glucose monitoring.

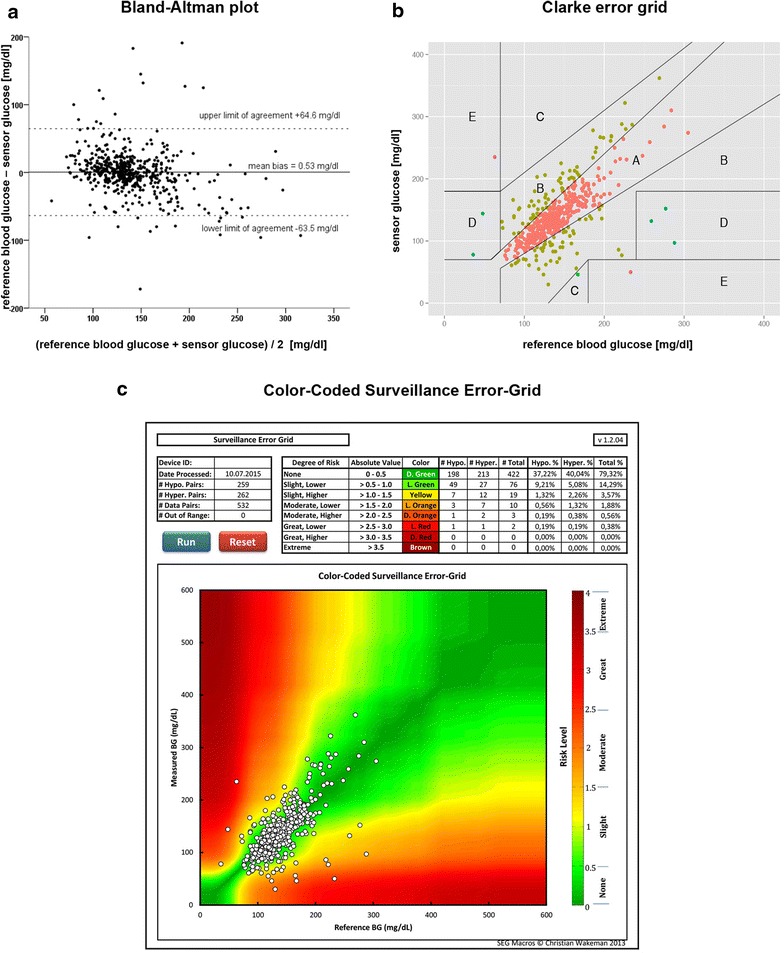
Results: The device generated 68,655 real-time values from 31 sensors in 20 critically ill patients. 532 comparative blood glucose values were collected. Data were displayed during 32.5 h [16.0/62.4] per sensor, which is 45.1 % of the expected time of 72 h and 84.8 % of 37.9 h actual monitoring time. 21 out of 31 sensors were removed prematurely. 79.1 % of the nursing staff rated the device as not beneficial; the response rate was one-third. Mean absolute relative difference was 15.3 % (CI 13.5-17.0 %). Clarke error grid: 76.9 % zone A, 21.6 % zone B, 0.2 % zone C, 0.9 % zone D, 0.4 % zone E. Bland-Altman plot: mean bias +0.53 mg/dl, limits of agreement +64.6 and -63.5 mg/dl. Accuracy deteriorated during elevated glycemic variability and in the hyperglycemic range. There was no reduction in dysglycemic events during CGM compared to 72 h before and after CGM. If CGM was measuring accurately, it identified more hyperglycemic events when compared to intermittent measurements. This study was not designed to evaluate potential benefits of CGM on glucose control.

Conclusions: The subcutaneous CGM system did not perform with satisfactory accuracy, feasibility, or nursing acceptance when evaluated in 20 medical-surgical ICU patients. Low point accuracy and prolonged data gaps significantly limited the potential clinical usefulness of the CGM trend data. Accurate continuous data display, with a MARD < 14 %, showed potential benefits in a subgroup of our patients. Trial registration NCT02296372; Ethic vote Charité EA2/095/14.

Keywords: Accuracy; Continuous glucose monitoring; Critically ill patients; Evaluation; Feasibility; ICU; Interstitial; Medtronic Sentrino®; Nurse acceptance; Reliability; Subcutaneous.


Figures

Fig. 1
Fig. 1
Study procedure. We included n = 20 patients during 57 days of recruiting. One patient was excluded from the accuracy analysis due to a lack of comparative blood glucose samples. Ten patients required a second sensor to achieve the minimum number of comparative samples or a minimum running time of 48 h. We used an optional second sensor in one patient
Fig. 2
Fig. 2
Analysis criteria. Detailed criteria for the evaluation of subcutaneous CGM in the ICU
Fig. 3
Fig. 3
Bland–Altman plot, Clarke error grid, Color-coded Surveillance Error-Grid. n = 532 comparative samples. a Bland–Altman plot. The mean bias indicates whether there is a systematic error. Upper and lower limits were calculated by mean bias ±1.96 × standard deviation of the difference between BG and sensor glucose and represent random variations around the mean bias. If there is a Gaussian distribution, 95 % of points are located between these limits. [22, 41]. b Clarke error grid. Distribution: A = 76.9 %, B = 21.6 %, C = 0.2 %, D = 0.9 %, E = 0.4 %. Zones A (CGM data ≤20 % deviation from BG) and B are considered as clinically acceptable zones, whereas values in zones C, D and E are increasingly dangerous for the patient, and zone E may lead to adverse therapeutic decisions. [23]. c Color-coded Surveillance Error-Grid. The Surveillance Error-Grid software is available at http://www.diabetestechnology.org/SEGsoftware/Surveillance-Error-Grid-Analysis.xlsm. Last Accessed: Dec 11 2015 [24]
Fig. 4
Fig. 4
Confounding factors on MARD. a (left): Association between MARD and individual daily blood glucose variability shown in first and second standard deviation of reference glucose. First boxplot The CGM device shows acceptable accuracy* (MARD median 10.9 %) if the blood glucose variability is low (first standard deviation). Second boxplot Accuracy deteriorates (MARD median 24 %) during increased blood glucose variability (second standard deviation). b (right): Association between MARD and blood glucose ranges. Second boxplot The CGM device shows acceptable accuracy* (MARD median 8.8 %) in blood glucose ranges between 80 and 179 mg/dl. First and Third boxplots Accuracy deteriorates in the hypoglycemic range (MARD median 65.8 %) and during severe hyperglycemia (MARD median 16 %). *According to criteria specified within the consensus recommendations [20], MARD should be <14 %

Similar articles

Cited by

References

    1. McCowen KC, Malhotra A, Bistrian BR. Stress-induced hyperglycemia. Crit Care Clin. 2001;17:107–124. doi: 10.1016/S0749-0704(05)70154-8. - DOI - PubMed
    1. Preiser J-C, Ichai C, Orban J-C, Groeneveld ABJ. Metabolic response to the stress of critical illness. Br J Anaesth. 2014;113:945–954. doi: 10.1093/bja/aeu187. - DOI - PubMed
    1. Weber-Carstens S, Schneider J, Wollersheim T, Assmann A, Bierbrauer J, Marg A, et al. Critical illness myopathy and GLUT4: significance of insulin and muscle contraction. Am J Respir Crit Care Med. 2013;187:387–396. doi: 10.1164/rccm.201209-1649OC. - DOI - PubMed
    1. Krinsley JS. Association between hyperglycemia and increased hospital mortality in a heterogeneous population of critically ill patients. Mayo Clin Proc. 2003;78:1471–1478. doi: 10.4065/78.12.1471. - DOI - PubMed
    1. Krinsley JS. Glycemic variability: a strong independent predictor of mortality in critically ill patients*. Crit Care Med. 2008;36:3008–3013. doi: 10.1097/CCM.0b013e31818b38d2. - DOI - PubMed

Associated data

LinkOut - more resources