. 2016 Aug 2;113(31):E4541-7.
doi: 10.1073/pnas.1601485113. Epub 2016 Jul 20.

Constituents and functional implications of the rat default mode network

Affiliations

Constituents and functional implications of the rat default mode network

Li-Ming Hsu et al. Proc Natl Acad Sci U S A. .

Abstract

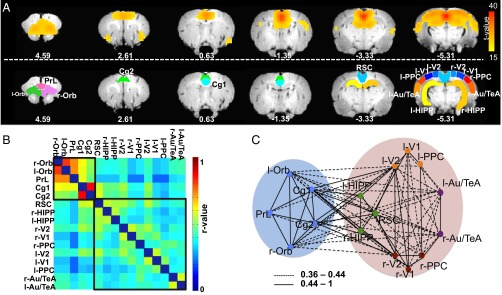
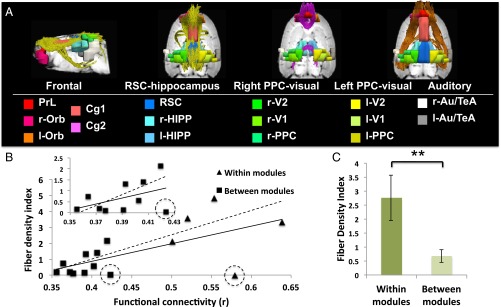
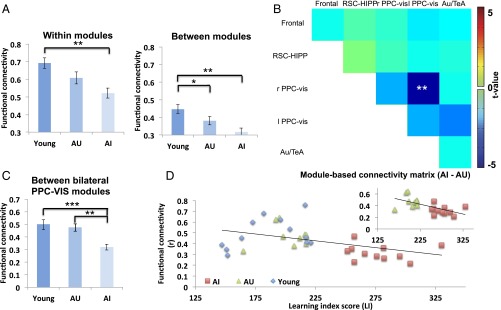
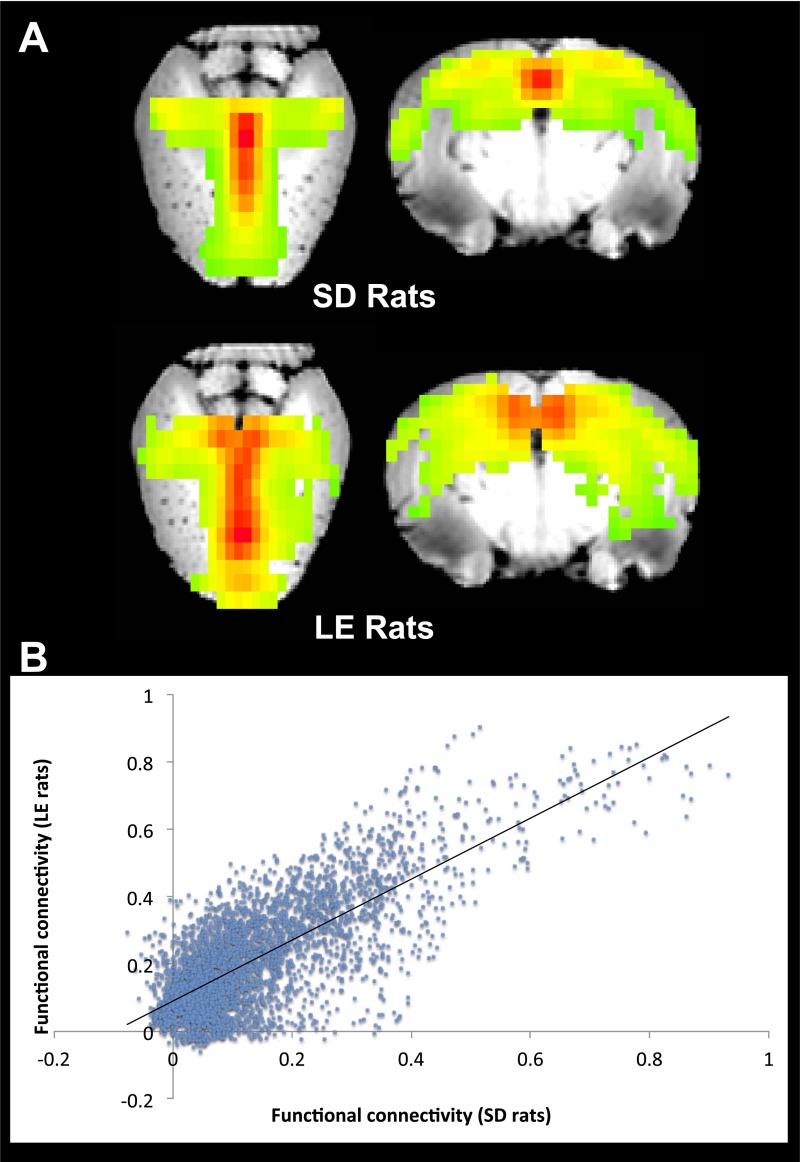
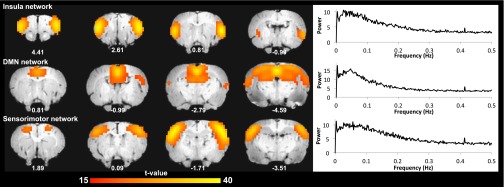
The default mode network (DMN) has been suggested to support a variety of self-referential functions in humans and has been fractionated into subsystems based on distinct responses to cognitive tasks and functional connectivity architecture. Such subsystems are thought to reflect functional hierarchy and segregation within the network. Because preclinical models can inform translational studies of neuropsychiatric disorders, partitioning of the DMN in nonhuman species, which has previously not been reported, may inform both physiology and pathophysiology of the human DMN. In this study, we sought to identify constituents of the rat DMN using resting-state functional MRI (rs-fMRI) and diffusion tensor imaging. After identifying DMN using a group-level independent-component analysis on the rs-fMRI data, modularity analyses fractionated the DMN into an anterior and a posterior subsystem, which were further segregated into five modules. Diffusion tensor imaging tractography demonstrates a close relationship between fiber density and the functional connectivity between DMN regions, and provides anatomical evidence to support the detected DMN subsystems. Finally, distinct modulation was seen within and between these DMN subcomponents using a neurocognitive aging model. Taken together, these results suggest that, like the human DMN, the rat DMN can be partitioned into several subcomponents that may support distinct functions. These data encourage further investigation into the neurobiological mechanisms of DMN processing in preclinical models of both normal and disease states.

Keywords: aging; default mode network; functional connectivity; modularity; rat brain.


Conflict of interest statement

The authors declare no conflict of interest.

Figures

Fig. 1.
Fig. 1.
(A, Upper) Components of the DMN identified from gICA. (Lower) Anatomical definitions of ROIs manually drawn within the putative DMN: auditory/temporal association cortex (Au/TeA), cingulate cortex (Cg), hippocampus formation (HIPP), orbital cortex (Orb), posterior parietal cortex (PPC), prelimbic cortex (PrL), retrosplenial cortex (RSC), association visual cortex (V1 and V2). Distance from bregma (in millimeters) is labeled below each slice. Overlapping regions between the ICA-driven DMN mask (Upper) and anatomical ROIs (Lower) were set as nodes in the modularity analyses. (B) Resting-state functional connectivity matrix from 16 DMN nodes. Black squares outline two subnetworks based upon modularity analysis thresholded at 83% connection density, which includes an anterior and a posterior subnetwork. (C) Five modules were detected from modularity analysis at 20% connection density, including the frontal module (blue dots), the RSC-HIPP module (green dots), the right and left PPC-visual module (dark red and orange dots), and the Au/TeA module (purple dots). The blue and pink filled circles show the anterior and posterior subnetworks, respectively.
Fig. 2.
Fig. 2.
(A) Mean DTI-based tractography results across rats. Three major fiber tracks, including the frontoparietal fasciculus (orange fiber), the corpus callosum (purple fiber), and the cingulate tract (yellow fiber) were identified that connect the regions within and between the five identified DMN modules. Regional definitions are as in Fig. 1. (B) Correlation between functional connectivity and fiber bundle strength within and between DMN modules (solid line, r = 0.64, P < 0.05). The triangles represent the connections within modules and squares indicate the connections between modules. The circled data points denote two outliers that show low fiber connections but high functional connectivity, one between the left and right PPC-visual module (square with dotted circle) and the other within the Au/TeA module (triangle with dotted circle). After excluding these two outliers, correlations between structural and functional connectivity increased (dotted line, r = 0.87, P < 0.001). (Inset) Expanded the scale of the structural and functional connectivity between modules, which correlate moderately (solid line, r = 0.44, P = 0.1) and significantly after removing the outlier point (dotted line, r = 0.73, P < 0.05). (C) The mean fiber density index within modules are significantly higher than those between modules (**P < 0.01).
Fig. 3.
Fig. 3.
(A) The averaged functional connectivity within the five DMN modules was significantly less in the aged-impaired (AI) compared with the young (Y) group. The averaged functional connectivity between the five DMN modules was significantly less in the AI and AU groups compared with the Y group (one-way ANOVA, F test = 8.19, P < 0.005). (B) The functional connectivity between left and right PPC-visual modules was significantly reduced between the AI and the AU rats. (C) The connectivity between left and right PPC-visual modules was significant reduced in the AI compared with the AU and Y groups (one-way ANOVA, F test = 10.5, P < 0.005). (D) The functional connectivity between left and right PPC-visual modules was significantly negatively correlated with LI score across Y, AU, and AI rats (r = 0.44, P < 0.05). (Inset) After excluding young rats, the correlations increased across AU and AI rats (r = 0.62, P < 0.005). *P < 0.05, **P < 0.01, ***P < 0.001, corrected.
Fig. S1.
Fig. S1.
The reproducibility of DMN subnetworks derived from different number of rats. Modular analysis was conducted on DMN networks generated from randomly selected subgroups consisting of 2–33 rats from the original cohort (each random selection was repeated 100 times). The normalized mutual information (NMI), which measures similarity between two sets of partitions, was computed between the resultant DMN subnetwork patterns and the one we obtained using the original 34 rats (*P < 0.05).
Fig. S2.
Fig. S2.
The reproducibility of DMN subnetworks derived from nonoverlapping subsets of rats. Modular analysis was conducted on DMN networks generated from randomly selected, nonoverlapping subsets consisting of one through six rats per subsets. The result showed that the mean similarity of these subsets ranged from 0.41 (one rat per set) monotonically to 0.67 (six rats per set).
Fig. S3.
Fig. S3.
The DMN parcellation from ROI-wise, voxelwise, and modified voxelwise network, in which the different colors indicate different modules.
Fig. S4.
Fig. S4.
The DMN subcomponents from modularity analysis (Left) and gICA (Right).
Fig. S5.
Fig. S5.
Head motion parameters in six directions, which included the rotation about the inferior–superior (roll), right–left (pitch), and anterior–posterior (yaw) axis and the displacement in the superior (dS), left (dL), and posterior direction (dP). The results indicate that there was no significant difference in head motion parameters between SD and young group of LE rats.
Fig. S6.
Fig. S6.
(A) The DMN from 15-components ICA analysis in SD and young group of LE rats. (B) Functional connectivity among DMN structures correlated significantly (r = 0.76, P < 0.0001) between SD and young group of LE rats.
Fig. S7.
Fig. S7.
The frequency distribution from three brain network time courses. The frequency range where the major power of the rat rs-fMRI data resided was much wider than the typically observed 0.01–0.1-Hz range in human data (P < 0.001).

References

    1. Raichle ME, et al. A default mode of brain function. Proc Natl Acad Sci USA. 2001;98(2):676–682. - PMC - PubMed
    1. Vincent JL, et al. Intrinsic functional architecture in the anaesthetized monkey brain. Nature. 2007;447(7140):83–86. - PubMed
    1. Lu H, et al. Rat brains also have a default mode network. Proc Natl Acad Sci USA. 2012;109(10):3979–3984. - PMC - PubMed
    1. Stafford JM, et al. Large-scale topology and the default mode network in the mouse connectome. Proc Natl Acad Sci USA. 2014;111(52):18745–18750. - PMC - PubMed
    1. Schwarz AJ, et al. Anti-correlated cortical networks of intrinsic connectivity in the rat brain. Brain Connect. 2013;3(5):503–511. - PMC - PubMed

Publication types

LinkOut - more resources