. 2016 Sep 2;119(6):718-30.
doi: 10.1161/CIRCRESAHA.116.308689. Epub 2016 Jul 20.

AMP-Activated Protein Kinase Alpha 2 Deletion Induces VSMC Phenotypic Switching and Reduces Features of Atherosclerotic Plaque Stability

Affiliations

AMP-Activated Protein Kinase Alpha 2 Deletion Induces VSMC Phenotypic Switching and Reduces Features of Atherosclerotic Plaque Stability

Ye Ding et al. Circ Res. .

Abstract

Rationale: AMP-activated protein kinase (AMPK) has been reported to play a protective role in atherosclerosis. However, whether AMPKα2 controls atherosclerotic plaque stability remains unknown.

Objective: The aim of this study was to evaluate the impact of AMPKα2 deletion on atherosclerotic plaque stability in advanced atherosclerosis at the brachiocephalic arteries and to elucidate the underlying mechanisms.

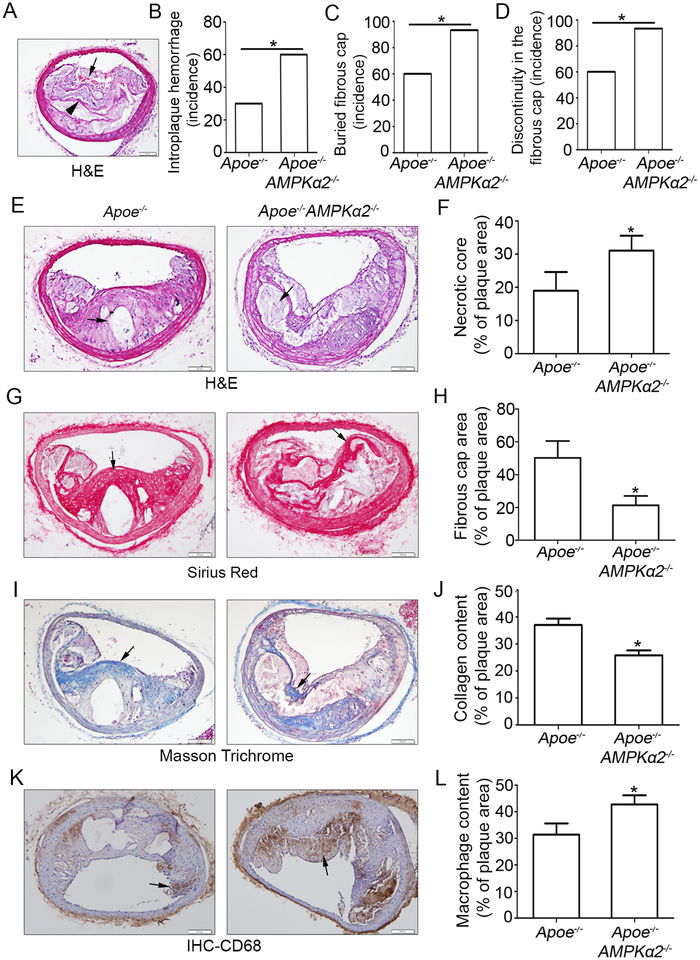
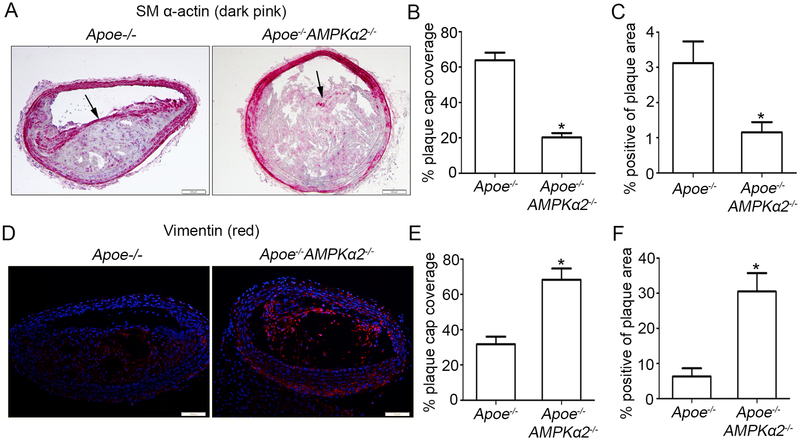
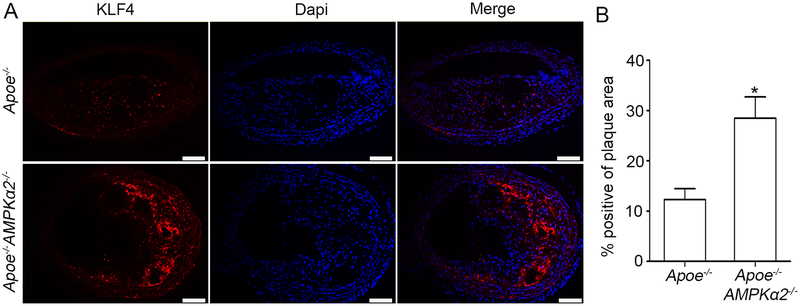
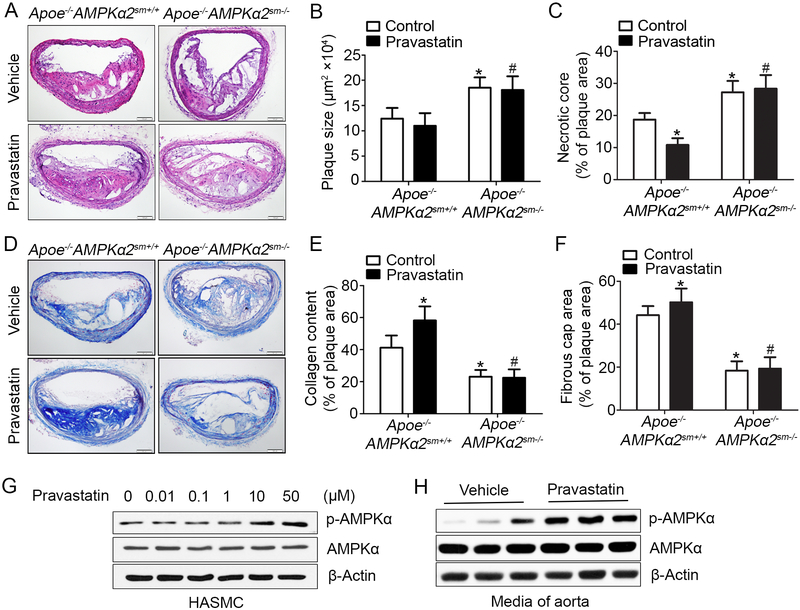
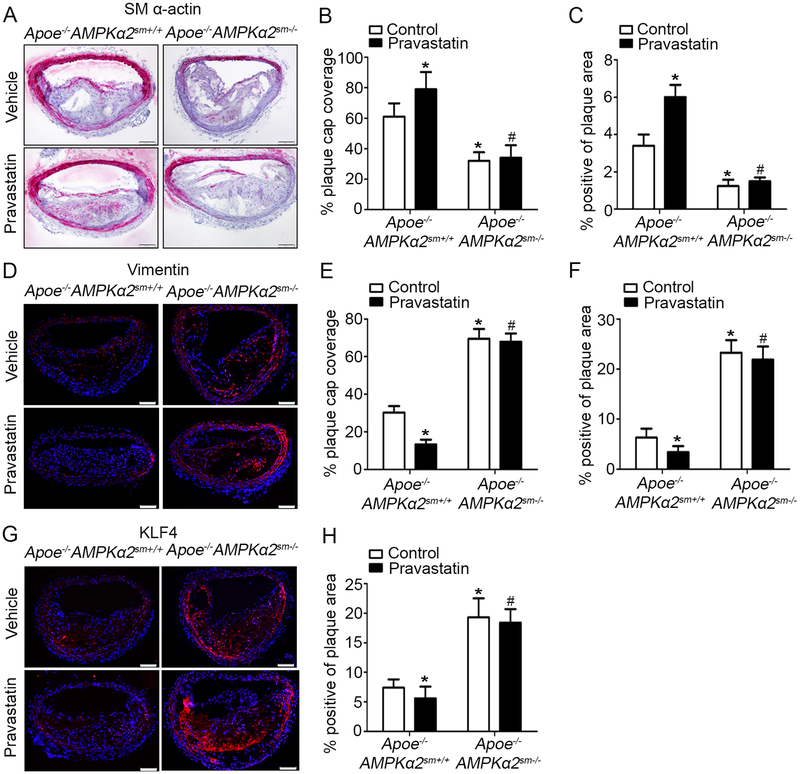
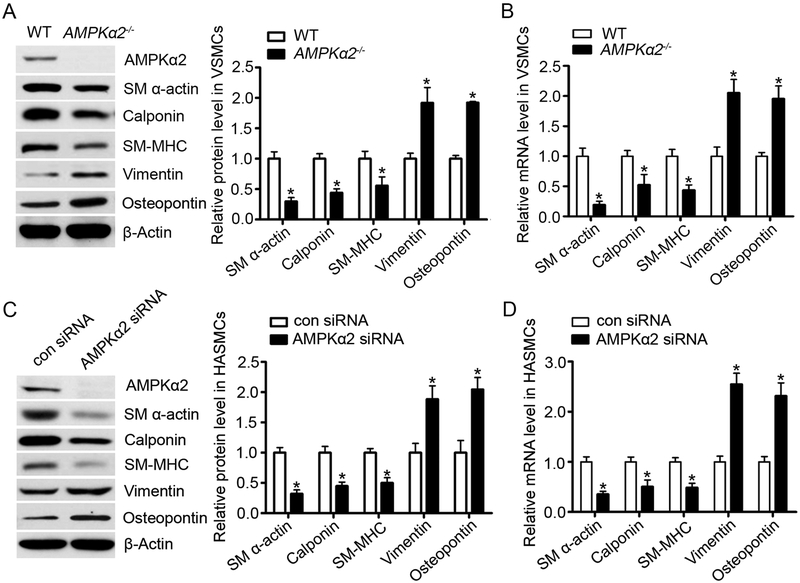
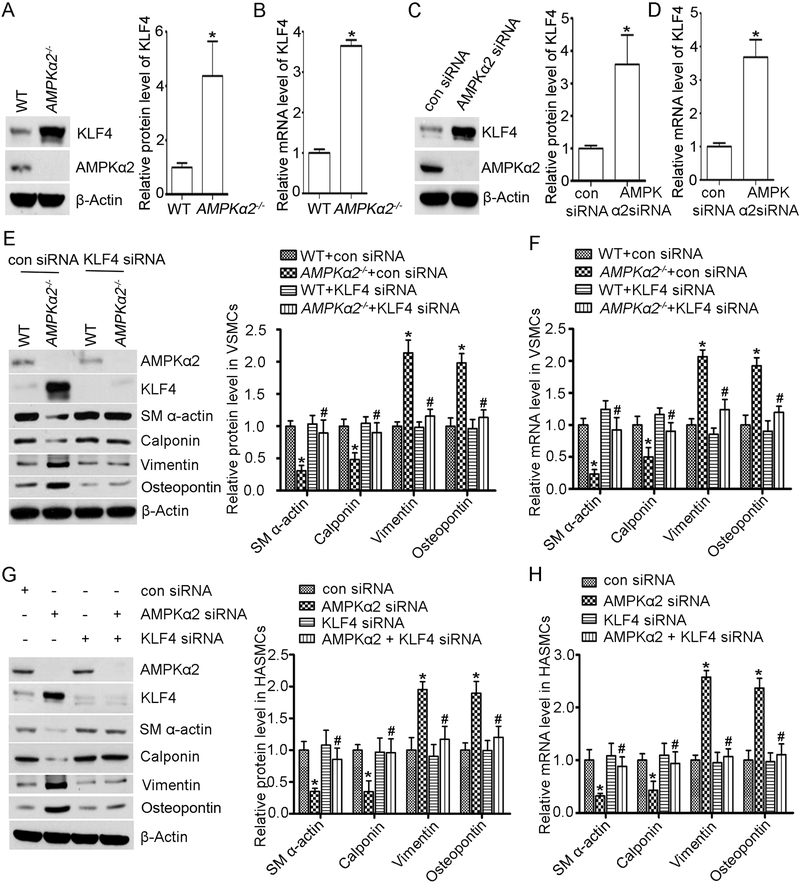
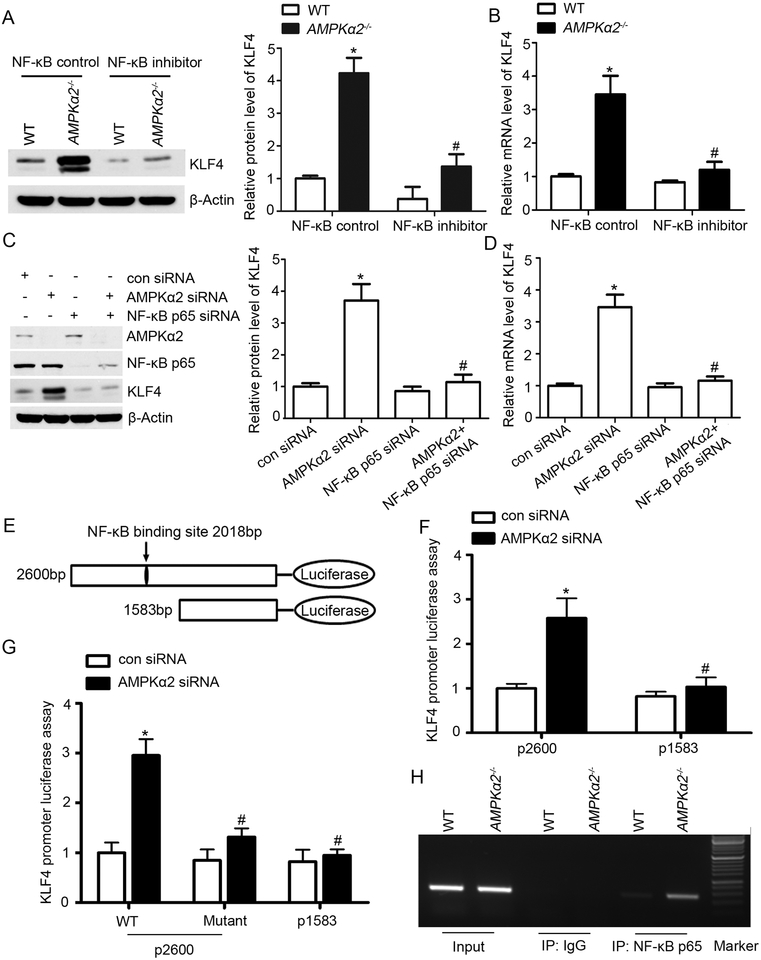
Methods and results: Features of atherosclerotic plaque stability and the markers for contractile or synthetic vascular smooth muscle cell (VSMC) phenotypes were monitored in the brachiocephalic arteries from Apoe(-/-)AMPKα2(-/-) mice or VSMC-specific AMPKα2(-/-) mice in an Apoe(-/-) background (Apoe(-/-)AMPKα2(sm-/-)) fed Western diet for 10 weeks. We identified that Apoe(-/-)AMPKα2(-/-) mice and Apoe(-/-)AMPKα2(sm-/-) mice exhibited similar unstable plaque features, aggravated VSMC phenotypic switching, and significant upregulation of Kruppel-like factor 4 (KLF4) in the plaques located in the brachiocephalic arteries compared with those found in Apoe(-/-) and Apoe(-/-)AMPKα2(sm+/+) control mice. Pravastatin, an AMPK activator, suppressed VSMC phenotypic switching and alleviated features of atherosclerotic plaque instability in Apoe(-/-)AMPKα2(sm+/+) mice, but not in Apoe(-/-)AMPKα2(sm-/-) mice. VSMC isolated from AMPKα2(-/-) mice displayed a significant reduction of contractile proteins(smooth muscle actin-α, calponin, and SM-MHC [smooth muscle-mysion heavy chain]) in parallel with increased detection of synthetic proteins (vimentin and osteopontin) and KLF4, as observed in vivo. KLF4-specific siRNA abolished AMPKα2 deletion-induced VSMC phenotypic switching. Furthermore, pharmacological or genetic inhibition of nuclear factor-κB significantly decreased KLF4 upregulation in VSMC from AMPKα2(-/-) mice. Finally, we found that AMPKα2 deletion markedly promoted the binding of nuclear factor-κBp65 to KLF4 promoter.

Conclusions: This study demonstrated that AMPKα2 deletion induces VSMC phenotypic switching and promotes features of atherosclerotic plaque instability in nuclear factor-κB-KLF4-dependent manner.

Keywords: AMP-activated protein kinases; atherosclerosis.


Figures

Figure 1.
Figure 1.. AMPKα2 deletion enhances western diet-induced features of atherosclerotic plaque instability in the BA.
(A) Representative images from BA lesions of Apoe−/− and Apoe−/−AMPKα2−/− mice with H&E staining for intraplaque hemorrhage (black arrow) and buried fibrous cap (black arrowhead). (B-D) Incidence for intraplaque hemorrhage (B), presence of buried fibrous cap (C) and presence of fibrous cap discontinuity (D) in the BA of Apoe−/− and Apoe−/−AMPKα2−/− mice. (E-F) Representative images and quantification of necrotic core area in the BA based on H&E staining (black arrow) of Apoe−/− and Apoe−/−AMPKα2−/− mice. (G-H) Representative images and quantification for the area of fibrous cap staining (black line) in BA based on Sirius Red staining (red staining) of Apoe−/− and Apoe−/−AMPKα2−/− mice. (I-J) Representative images and quantification of plaque collagen content in BA based on Masson trichrome staining (Blue staining, black arrow)) of Apoe−/− and Apoe−/−AMPKα2−/− mice. (K-L) Representative images and quantification of plaque macrophage content in BA based on CD68 IHC staining (Brown staining, black arrow)) of Apoe−/− and Apoe−/−AMPKα2−/− mice. n=20–21 in each group. Values represent the mean ± SEM. *, P<0.05 vs. Apoe−/− mice. Scale bar=100 μm.
Figure 2.
Figure 2.. AMPKα2 deletion induces VSMC phenotypic switching in advanced atherosclerotic plaque in the BA.
(A) Representative images of IHC staining of SM α-actin (dark pink) in BA of Apoe−/− and Apoe−/−AMPKα2−/− mice. Arrow represents representative staining of SM α-actin. Scale bar=100 μm. (B) Quantification of plaque SM α-actin coverage on the plaque cap in BA of Apoe−/− and Apoe−/−AMPKα2−/− mice. (C) Quantification of total plaque SM α-actin content in BA of Apoe−/− and Apoe−/−AMPKα2−/− mice. (D) Representative images of IF staining of vimentin (red) in BA of Apoe−/− and Apoe−/−AMPKα2−/− mice. Dapi = blue staining of nucleus. Scale bar=100 μm. (E) Quantification of plaque vimentin coverage on the plaque cap in BA of Apoe−/− and Apoe−/−AMPKα2−/− mice. (F) Quantification of total plaque vimentin content in BA of Apoe−/− and Apoe−/−AMPKα2−/− mice. n=10 in each group. Values represent the mean ± SEM. *, P<0.05 vs. Apoe−/− mice.
Figure 3.
Figure 3.. AMPKα2 deletion upregulates KLF4 expression in advanced atherosclerotic plaque in the BA.
(A) IF staining of KLF4 (red) in BA of Apoe−/− and Apoe−/−AMPKα2−/− mice. Dapi = blue staining of nucleus. Scale bar=100 μm. (B) Quantification of KLF4 expression in BA of Apoe−/− and Apoe−/−AMPKα2−/− mice. n=10 in each group. Values represent the mean ± SEM. *, P<0.05 vs. Apoe−/− mice.
Figure 4.
Figure 4.. Pravastatin treatment alleviates western diet-induced plaque instability in Apoe−/−AMPKα2sm+/+ mice, but not in Apoe−/−AMPKα2sm−/− mice.
(A) Representative images from H&E staining of the BA in Apoe−/−AMPKα2sm+/+ and Apoe−/−AMPKα2sm−/− mice treated with or without pravastatin. Scale bar=100 μm. (B) Quantification of plaque size and (C) necrotic core size in the BA of Apoe−/−AMPKα2sm+/+ and Apoe−/−AMPKα2sm−/− mice treated with or without pravastatin. (D-E) Representative images and quantification of plaque collagen content in the BA based on Masson trichrome staining of Apoe−/−AMPKα2sm+/+ and Apoe−/−AMPKα2sm−/− mice treated with or without pravastatin. Scale bar=100 μm. (F) Quantification of fibrous cap area in the BA of Apoe−/−AMPKα2sm+/+ and Apoe−/−AMPKα2sm−/− mice treated with or without pravastatin. n=10 in each group. Values represent the means ± SEM. *, P<0.05 vs. Apoe−/−AMPKα2sm+/+ mice without pravastatin treatment. #, P<0.05 vs. Apoe−/−AMPKα2sm+/+ mice with pravastatin treatment. (G) Western blot analysis of pAMPKα (Thr172) in HASMC treated with 0.01–50 μM pravastatin for 24 hours. (H) Western blot analysis of pAMPKα (Thr172) in aorta from Apoe−/−AMPKα2sm+/+ mice fed with western diet for 10 weeks and treated with or without pravastatin for 4 weeks.
Figure 5.
Figure 5.. VSMC AMPKα2 knockdown eliminates the effect of Pravastatin treatment on VSMC phenotypic switching signaling in vivo.
(A) Representative images of IHC staining of SM α-actin (dark pink) in the BA of Apoe−/−AMPKα2sm+/+ and Apoe−/−AMPKα2sm−/− mice treated with or without pravastatin. Scale bar=100 μm. (B-C) Quantification of plaque SM α-actin coverage on the plaque cap (B) and total plaque SM α-actin content (C) in BA of Apoe−/−AMPKα2sm+/+ and Apoe−/−AMPKα2sm−/− mice treated with or without pravastatin. (D) Representative images of IF staining of Vimentin (red) in the BA of Apoe−/−AMPKα2sm+/+ and Apoe−/−AMPKα2sm−/− mice treated with or without pravastatin. Dapi = blue staining of nucleus. Scale bar=100 μm (E-F) Quantification of plaque vimentin coverage on the plaque cap (E) and total plaque vimentin content (F) in BA of Apoe−/−AMPKα2sm+/+ and Apoe−/−AMPKα2sm−/− mice treated with or without pravastatin. (G) Representative images of IF staining of KLF4 (red) in the BA of Apoe−/−AMPKα2sm+/+ and Apoe−/−AMPKα2sm−/− mice treated with or without pravastatin. Dapi = blue staining of nucleus. Scale bar=100 μm. (H) Quantification of KLF4 expression in BA of Apoe−/−AMPKα2sm+/+ and Apoe−/−AMPKα2sm−/− mice treated with or without pravastatin. n=10 in each group. Values represent the means ± SEM. *, P<0.05 vs. Apoe−/−AMPKα2sm+/+ mice without pravastatin treatment. #, P<0.05 vs. Apoe−/−AMPKα2sm+/+ mice with pravastatin treatment.
Figure 6.
Figure 6.. AMPKα2 deficiency induces VSMC phenotypic switching in vitro.
(A) Western blot analysis of contractile (SM α-actin, calponin and SM-MHC) and synthetic proteins (vimentin and osteopontin) in VSMC isolated from WT and AMPKα2−/− mice (n=5). Values represent the means ± SEM. *, P<0.05 vs. WT. (B) Quantitative real-time PCR of contractile (SM α-actin, calponin and SM-MHC) and synthetic markers (vimentin and osteopontin) in VSMC isolated from WT and AMPKα2−/− mice (n=5). Values represent the means ± SEM. *, P<0.05 vs. WT. (C) Western blot analysis of contractile and synthetic proteins in HASMC treated with con siRNA and AMPKα2 siRNA (n=5). Values represent the means ± SEM. *, P<0.05 vs. con siRNA. (D) Quantitative real-time PCR of contractile and synthetic markers in HASMC treated with con siRNA and AMPKα2 siRNA (n=5). Values represent the means ± SEM. *, P<0.05 vs. con siRNA.
Figure 7.
Figure 7.. AMPKα2 deficiency-induced VSMC phenotype switching is in KLF4-dependent manner.
(A) Western blot analysis of KLF4 protein expression in WT and AMPKα2−/− mouse VSMC (n=5). *, P<0.05 vs. WT. (B) Quantitative real-time PCR analysis of KLF4 mRNA level in WT and AMPKα2−/− mouse VSMC (n=5). *, P<0.05 vs. WT. (C) Western blot analysis of KLF4 protein expression in HASMC treated with con siRNA and AMPKα2 siRNA (n=5). *, P<0.05 vs. con siRNA. (D) Quantitative real-time PCR analysis of KLF4 mRNA level in HASMC treated with con siRNA and AMPKα2 siRNA (n=5). *, P<0.05 vs. con siRNA. (E) Western blot analysis of protein expression of SM α-actin, calponin, vimentin and osteopontin in WT and AMPKα2−/− mouse VSMC treated with con siRNA and KLF4 siRNA for 48 hours (n=5). *, P<0.05 vs. WT+con siRNA. #, P<0.05 vs. AMPKα2−/− +con siRNA. (F) Quantitative real-time PCR analysis of mRNA level of SM α-actin, calponin, vimentin and osteopontin in WT and AMPKα2−/− mouse VSMC treated with con siRNA and KLF4 siRNA for 48 hours (n=5). *, P<0.05 vs. WT+con siRNA. #, P<0.05 vs. AMPKα2−/− +con siRNA. (G) Western blot analysis of protein expression of SM α-actin, calponin, vimentin and osteopontin in HASMC treated with con siRNA, AMPKα2 siRNA and KLF4 siRNA for 48 hours (n=5). *, P<0.05 vs. con siRNA. #, P<0.05 vs. AMPKα2 siRNA. (H) Quantitative real-time PCR analysis of mRNA level of SM α-actin, calponin, vimentin and osteopontin in HASMC treated with con siRNA, AMPKα2 siRNA and KLF4 siRNA for 48 hours (n=5). *, P<0.05 vs. con siRNA. #, P<0.05 vs. AMPKα2 siRNA.
Figure 8.
Figure 8.. AMPKα2 deletion upregulates KLF4 through NF-κB signaling.
(A) Western blot analysis of KLF4 expression in WT and AMPKα2−/− mouse VSMC treated with NF-κB control and NF-κB inhibitor (n=5). *, P<0.05 vs. WT VSMC treated with NF-κB control. #, P<0.05 vs. AMPKα2−/− VSMC treated with NF-κB control. (B) Quantitative real-time PCR analysis of mRNA level of KLF4 in WT and AMPKα2−/− mouse VSMC treated with NF-κB control and NF-κB inhibitor (n=5). *, P<0.05 vs. WT VSMC treated with NF-κB control. #, P<0.05 vs. AMPKα2−/− VSMC treated with NF-κB control. (C) Western blot analysis of KLF4 expression in HASMC treated with NF-κBp65 siRNA and AMPKα2 siRNA (n=5). *, P<0.05 vs. con siRNA. #, P<0.05 vs. AMPKα2 siRNA. (D) Quantitative real-time PCR analysis of mRNA level of KLF4 in HASMC treated with NF-κBp65 siRNA and AMPKα2 siRNA (n=5). *, P<0.05 vs. con siRNA. #, P<0.05 vs. AMPKα2 siRNA. (E) The KLF4 promoter was analyzed using the Transcription Factor Database software, suggesting one binding site within the promoter. 2,600-bp and 1,583-bp KLF4 promoter luciferase constructs are shown. (F) HASMC were transfected with 2,600-bp and 1,583-bp KLF4 promoter luciferase constructs and treated with con siRNA or AMPKα2 siRNA, and luciferase activity was measured after 24 hours. Results of the luciferase reporter assay are presented as fold changes ±SEM of the Firefly/Renilla luciferase activities (n=5). *, P<0.05 vs. HASMC transfected with 2,600-bp KLF4 promoter luciferase construct and con siRNA. #, P<0.05 vs. HASMC transfected with 2,600-bp KLF4 promoter luciferase construct and AMPKα2 siRNA. (G) HASMC were transfected with either WT or the mutant KLF4 promoter reporter and treated with con siRNA or AMPKα2 siRNA for 24 hours to detect the luciferase activity (n=5). *, P<0.05 vs. HASMC transfected with WT 2,600-bp KLF4 promoter reporter and con siRNA. #, P<0.05 vs. HASMC transfected with WT 2,600-bp KLF4 promoter reporter and AMPKα2 siRNA. (H) ChIP assay for NF-κBp65 binding with KLF4 promoter in WT and AMPKα2−/− mouse VSMC.

Similar articles

Cited by

References

    1. Lusis AJ. Atherosclerosis. Nature. 2000;407:233–241 - PMC - PubMed
    1. Hansson GK. Inflammation, atherosclerosis, and coronary artery disease. N Engl J Med. 2005;352:1685–1695 - PubMed
    1. Yla-Herttuala S, Bentzon JF, Daemen M, Falk E, Garcia-Garcia HM, Herrmann J, Hoefer I, Jukema JW, Krams R, Kwak BR, Marx N, Naruszewicz M, Newby A, Pasterkamp G, Serruys PW, Waltenberger J, Weber C, Tokgozoglu L. Stabilisation of atherosclerotic plaques. Position paper of the european society of cardiology (esc) working group on atherosclerosis and vascular biology. Thromb Haemost. 2011;106:1–19 - PubMed
    1. Rzucidlo EM, Martin KA, Powell RJ. Regulation of vascular smooth muscle cell differentiation. J Vasc Surg. 2007;45 Suppl A:A25–32 - PubMed
    1. Bennett MR. Apoptosis of vascular smooth muscle cells in vascular remodelling and atherosclerotic plaque rupture. Cardiovasc Res. 1999;41:361–368 - PubMed