

Characterization of AD-like phenotype in aged APPSwe/PS1dE9 mice
- PMID: 27439903
- PMCID: PMC5061676
- DOI: 10.1007/s11357-016-9929-7
Characterization of AD-like phenotype in aged APPSwe/PS1dE9 mice
Abstract
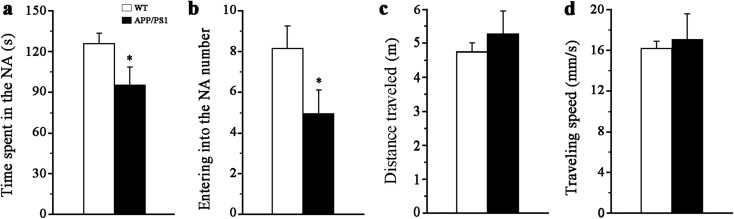
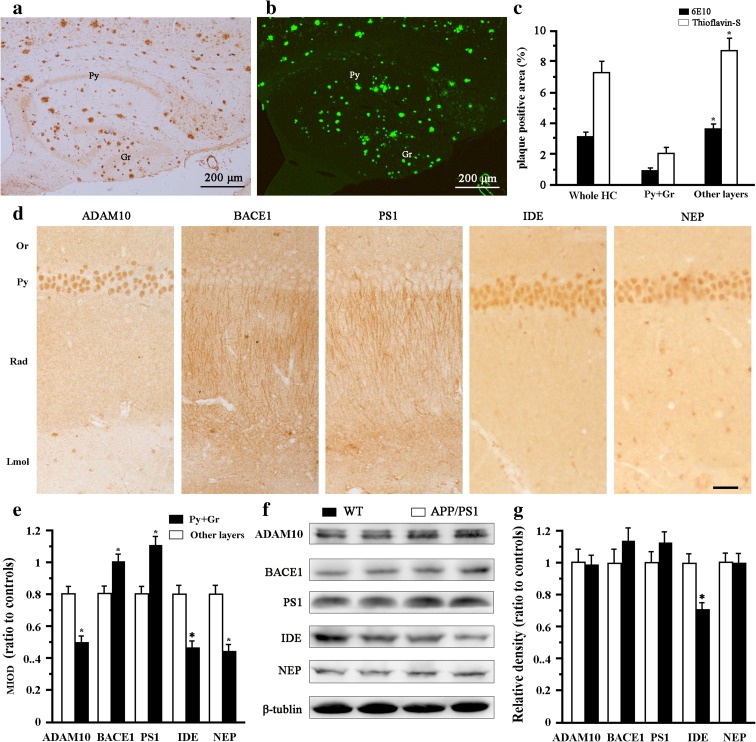
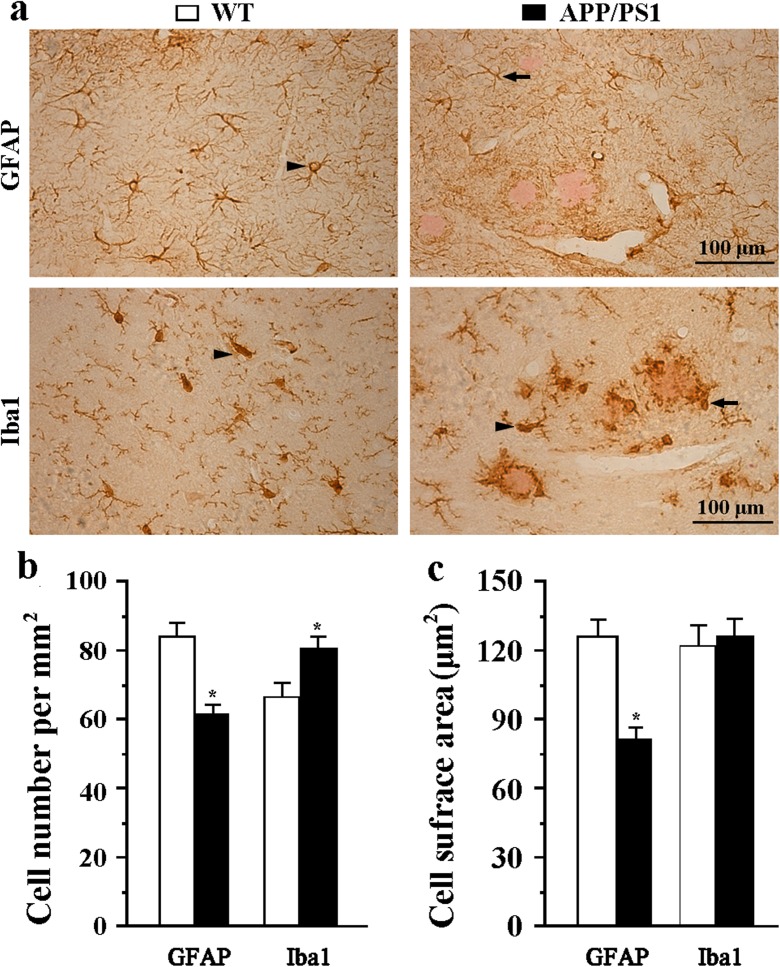
Transgenic APPSwe/PS1dE9 (APP/PS1) mice that overproduce amyloid beta (Aβ) are extensively used in the studies of pathogenesis and experimental therapeutics and new drug screening for Alzheimer's disease (AD). However, most of the current literature uses young or adult APP/PS1 mice. In order to provide a broader view of AD-like phenotype of this animal model, in this study, we systematically analyzed behavioral and pathological profiles of 24-month-old male APP/PS1 mice. Aged APP/PS1 mice had reference memory deficits as well as anxiety, hyperactivity, and social interaction impairment. Consistently, there was obvious deposition of amyloid plaques in the dorsal hippocampus with decreased expression of insulin-degrading enzyme, a proteolytic enzyme responsible for degradation of intracellular Aβ. Furthermore, decreases in hippocampal volume, neuronal number and synaptophysin expression, and astrocyte atrophy were also observed in aged APP/PS1 mice. This finding suggests that aged APP/PS1 mice can well replicate cognitive and noncognitive behavioral abnormalities, hippocampal atrophy, and neuronal and astrocyte degeneration in AD patients, to enable more objective and refined preclinical evaluation of therapeutic drugs and strategies for AD treatment.
Keywords: APP/PS1 mice; Aged; Alzheimer’s disease; Hippocampal atrophy; Noncognitive abnormalities; β-amyloid.
Figures


Similar articles
-
HDAC3 negatively regulates spatial memory in a mouse model of Alzheimer's disease.Aging Cell. 2017 Oct;16(5):1073-1082. doi: 10.1111/acel.12642. Epub 2017 Aug 3. Aging Cell. 2017. PMID: 28771976 Free PMC article.
-
Age-related changes in hippocampal AD pathology, actin remodeling proteins and spatial memory behavior of male APP/PS1 mice.Behav Brain Res. 2019 Dec 30;376:112182. doi: 10.1016/j.bbr.2019.112182. Epub 2019 Aug 28. Behav Brain Res. 2019. PMID: 31472195
-
ApoA-I deficiency increases cortical amyloid deposition, cerebral amyloid angiopathy, cortical and hippocampal astrogliosis, and amyloid-associated astrocyte reactivity in APP/PS1 mice.Alzheimers Res Ther. 2019 May 13;11(1):44. doi: 10.1186/s13195-019-0497-9. Alzheimers Res Ther. 2019. PMID: 31084613 Free PMC article.
-
Transgenic mouse models for APP processing and Alzheimer's disease: early and late defects.Subcell Biochem. 2005;38:45-63. doi: 10.1007/0-387-23226-5_2. Subcell Biochem. 2005. PMID: 15709472 Review.
-
Preclinical Models of Alzheimer's Disease: Relevance and Translational Validity.Curr Protoc Pharmacol. 2019 Mar;84(1):e57. doi: 10.1002/cpph.57. Epub 2019 Feb 25. Curr Protoc Pharmacol. 2019. PMID: 30802363 Review.
Cited by
-
Addressing Blood-Brain Barrier Impairment in Alzheimer's Disease.Biomedicines. 2022 Mar 22;10(4):742. doi: 10.3390/biomedicines10040742. Biomedicines. 2022. PMID: 35453494 Free PMC article. Review.
-
Anxiety and Alzheimer's disease: Behavioral analysis and neural basis in rodent models of Alzheimer's-related neuropathology.Neurosci Biobehav Rev. 2021 Aug;127:647-658. doi: 10.1016/j.neubiorev.2021.05.005. Epub 2021 May 9. Neurosci Biobehav Rev. 2021. PMID: 33979573 Free PMC article. Review.
-
Reconfiguration of the cortical-hippocampal interaction may compensate for Sharp-Wave Ripple deficits in APP/PS1 mice and support spatial memory formation.PLoS One. 2020 Dec 31;15(12):e0243767. doi: 10.1371/journal.pone.0243767. eCollection 2020. PLoS One. 2020. PMID: 33382724 Free PMC article.
-
Enriched physical environment reverses spatial cognitive impairment of socially isolated APPswe/PS1dE9 transgenic mice before amyloidosis onset.CNS Neurosci Ther. 2018 Mar;24(3):202-211. doi: 10.1111/cns.12790. Epub 2017 Dec 23. CNS Neurosci Ther. 2018. PMID: 29274291 Free PMC article.
-
The Impact of the Exposome on Alzheimer's Disease: The Influence of Nutrition.Int J Mol Sci. 2025 Mar 26;26(7):3015. doi: 10.3390/ijms26073015. Int J Mol Sci. 2025. PMID: 40243652 Free PMC article. Review.
References
-
- Allen NJ, Barres BA (2009) Neuroscience: glia—more than just brain glue. Nature 457(7230):675–677 - PubMed
-
- Arbel-Ornath M, Hudry E, Eikermann-Haerter K, Hou S, Gregory JL, Zhao L, Betensky RA, Frosch MP, Greenberg SM, Bacskai BJ. Interstitial fluid drainage is impaired in ischemic stroke and Alzheimer’s disease mouse models. Acta Neuropathol. 2013;126(3):353–364. doi: 10.1007/s00401-013-1145-2. - DOI - PMC - PubMed
MeSH terms
Substances
LinkOut - more resources
Full Text Sources
Other Literature Sources
Medical