

High-Resolution Mapping of Postinfarction Reentrant Ventricular Tachycardia: Electrophysiological Characterization of the Circuit
- PMID: 27440005
- PMCID: PMC5072375
- DOI: 10.1161/CIRCULATIONAHA.116.021955
High-Resolution Mapping of Postinfarction Reentrant Ventricular Tachycardia: Electrophysiological Characterization of the Circuit
Abstract
Background: In vivo description of ventricular tachycardia (VT) circuits is limited by insufficient spatiotemporal resolution. We used a novel high-resolution mapping technology to characterize the electrophysiological properties of the postinfarction reentrant VT circuit.
Methods: In 15 swine, myocardial infarction was induced by left anterior descending artery balloon occlusion. Animals were studied 6 to 8 weeks after myocardial infarction. Activation mapping of VTs was performed by using the Rhythmia mapping system. Activation time was based on a combination of bipolar and unipolar electrograms. The response to overdrive pacing from different zones of the circuit was examined.
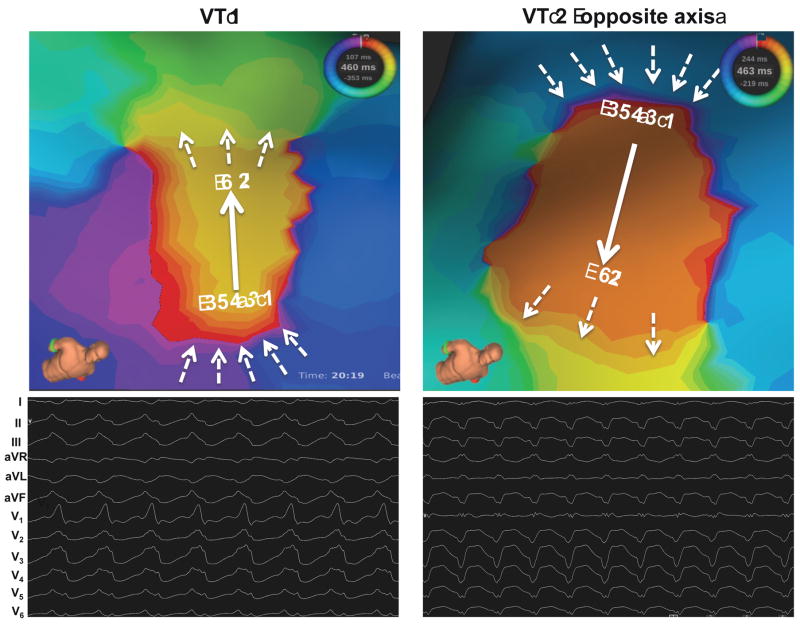
Results: A total of 56 monomorphic VTs were induced (3.8±2.1 per animal). Among these, 21 (37.5%) were hemodynamically stable and allowed mapping of the circuit. Isthmuses were 16.4±7.2 mm long and 7.4±2.8 mm wide. Conduction velocities were slowest at the inward curvature into the isthmus entrance (0.28±0.2 m/s), slightly faster at the outward curvature exit (0.40±0.3 m/s) and nearly normal at the central isthmus (0.62±0.2 m/s). In 3 animals, 2 VT morphologies with opposite axes sharing the same isthmus were mapped. Conduction velocities within the shared isthmus were dependent on the activation vector, consistently slower at the proximal curvature. Overdrive pacing from isthmus sites determined by activation mapping was consistent with entrainment criteria for isthmus. However, dimensions of the isthmus defined by entrainment exceeded dimensions of the isthmus measured by activation mapping by 32±18%.
Conclusions: In postinfarction reentrant VT, conduction velocities are slowest at the proximal and distal curvatures. Entrainment mapping overestimates the true size of the isthmus. High-resolution activation mapping of VT may better guide ablation therapy.
Keywords: cardiac ablation; electrophysiology; intracardiac electrograms; mapping; myocardial infarction; ventricular tachycardia.
© 2016 American Heart Association, Inc.
Figures


References
-
- Ciaccio EJ, Ashikaga H, Kaba RA, Cervantes D, Hopenfeld B, Wit AL, Peters NS, McVeigh ER, Garan H, Coromilas J. Model of reentrant ventricular tachycardia based on infarct border zone geometry predicts reentrant circuit features as determined by activation mapping. Heart rhythm : the official journal of the Heart Rhythm Society. 2007;4:1034–45. - PMC - PubMed
-
- de Bakker JM, van Capelle FJ, Janse MJ, Tasseron S, Vermeulen JT, de Jonge N, Lahpor JR. Slow conduction in the infarcted human heart. ‘Zigzag’ course of activation. Circulation. 1993;88:915–26. - PubMed
-
- Peters NS, Wit AL. Myocardial architecture and ventricular arrhythmogenesis. Circulation. 1998;97:1746–54. - PubMed
-
- Wit AL, Peters NS. The role of gap junctions in the arrhythmias of ischemia and infarction. Heart rhythm : the official journal of the Heart Rhythm Society. 2012;9:308–11. - PubMed
-
- Fenoglio JJ, Jr, Pham TD, Harken AH, Horowitz LN, Josephson ME, Wit AL. Recurrent sustained ventricular tachycardia: structure and ultrastructure of subendocardial regions in which tachycardia originates. Circulation. 1983;68:518–33. - PubMed
Publication types
MeSH terms
Grants and funding
LinkOut - more resources
Full Text Sources
Other Literature Sources
Medical
