

Control theory meets synthetic biology
- PMID: 27440256
- PMCID: PMC4971224
- DOI: 10.1098/rsif.2016.0380
Control theory meets synthetic biology
Abstract
The past several years have witnessed an increased presence of control theoretic concepts in synthetic biology. This review presents an organized summary of how these control design concepts have been applied to tackle a variety of problems faced when building synthetic biomolecular circuits in living cells. In particular, we describe success stories that demonstrate how simple or more elaborate control design methods can be used to make the behaviour of synthetic genetic circuits within a single cell or across a cell population more reliable, predictable and robust to perturbations. The description especially highlights technical challenges that uniquely arise from the need to implement control designs within a new hardware setting, along with implemented or proposed solutions. Some engineering solutions employing complex feedback control schemes are also described, which, however, still require a deeper theoretical analysis of stability, performance and robustness properties. Overall, this paper should help synthetic biologists become familiar with feedback control concepts as they can be used in their application area. At the same time, it should provide some domain knowledge to control theorists who wish to enter the rising and exciting field of synthetic biology.
Keywords: control theory; feedback; gene regulation; genetic circuits; robustness; synthetic biology.
© 2016 The Author(s).
Figures
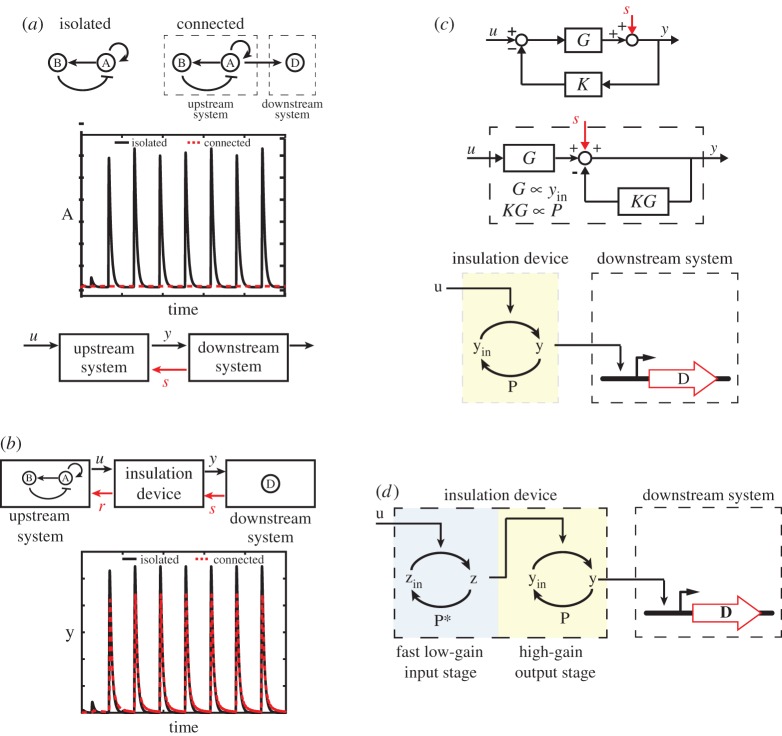
 (c) High-gain negative feedback can lead to oscillations and amplifies high-frequency disturbances. The open loop system is simulated as before by setting z = u. The closed loop system is simulated with G large and K = 1. The left-hand plot shows the time response of the system. The right-hand plot shows the frequency response of y to disturbance d. The horizontal axis represents the frequency ω of a periodic disturbance d(t) = sin(ωt) and the vertical axis shows the amplitude of the resulting y(t) signal. (d) Negative integral feedback completely rejects disturbances. The open loop system is as in panel (b) and simulated similarly. The closed loop system is simulated for two different values of G (as shown) and for K = 1. In all diagrams, the circle represents a summing junction: the outgoing arrow is a signal given by the weighted sum with the indicated signs of the signals on the incoming arrows. Also, we have used the shortened notation
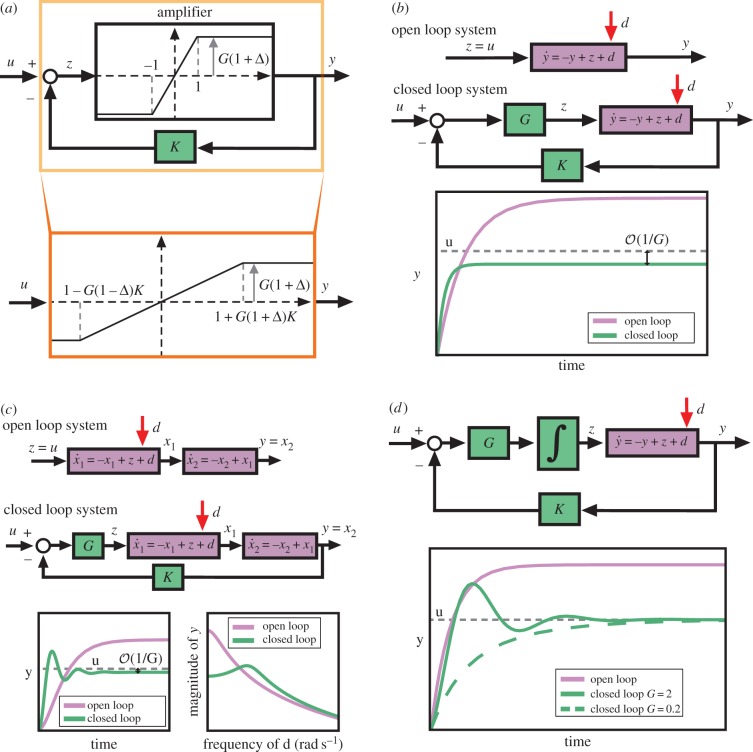
  . The simulation codes used to generate this figure are available in the electronic supplementary material.
References
-
- Ăström KJ, Kumar PR. 2014. Control: a perspective. Automatica 50, 3–43. (10.1016/j.automatica.2013.10.012) - DOI
-
- Hatano T, Sluder G. Time lapse series of hTERT-RPE1 cells. CIL:25708. The Cell: An Image Library. See www.cellimagelibrary.org .
Publication types
MeSH terms
LinkOut - more resources
Full Text Sources
Other Literature Sources
Miscellaneous