. 2016 Sep 1;311(3):C418-36.
doi: 10.1152/ajpcell.00001.2016. Epub 2016 Jul 20.

High glucose promotes the migration of retinal pigment epithelial cells through increased oxidative stress and PEDF expression

Affiliations

High glucose promotes the migration of retinal pigment epithelial cells through increased oxidative stress and PEDF expression

Mitra Farnoodian et al. Am J Physiol Cell Physiol. .

Abstract

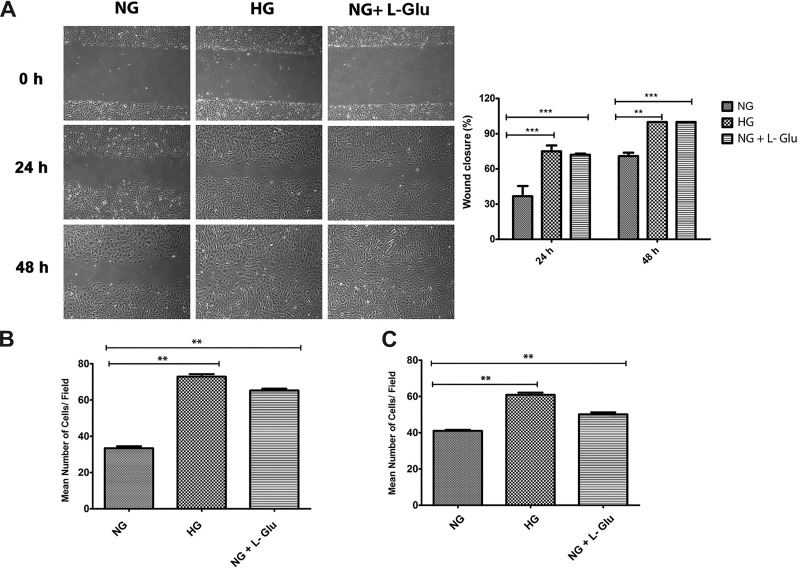
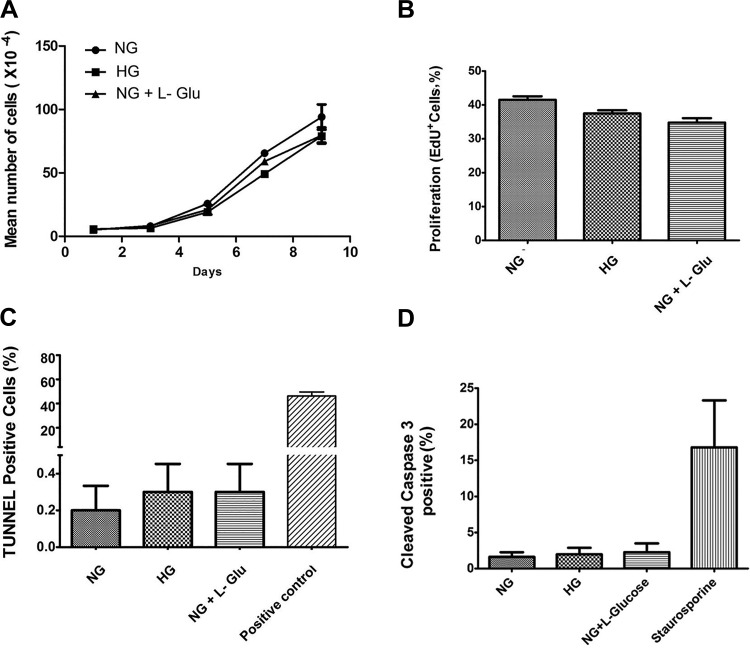
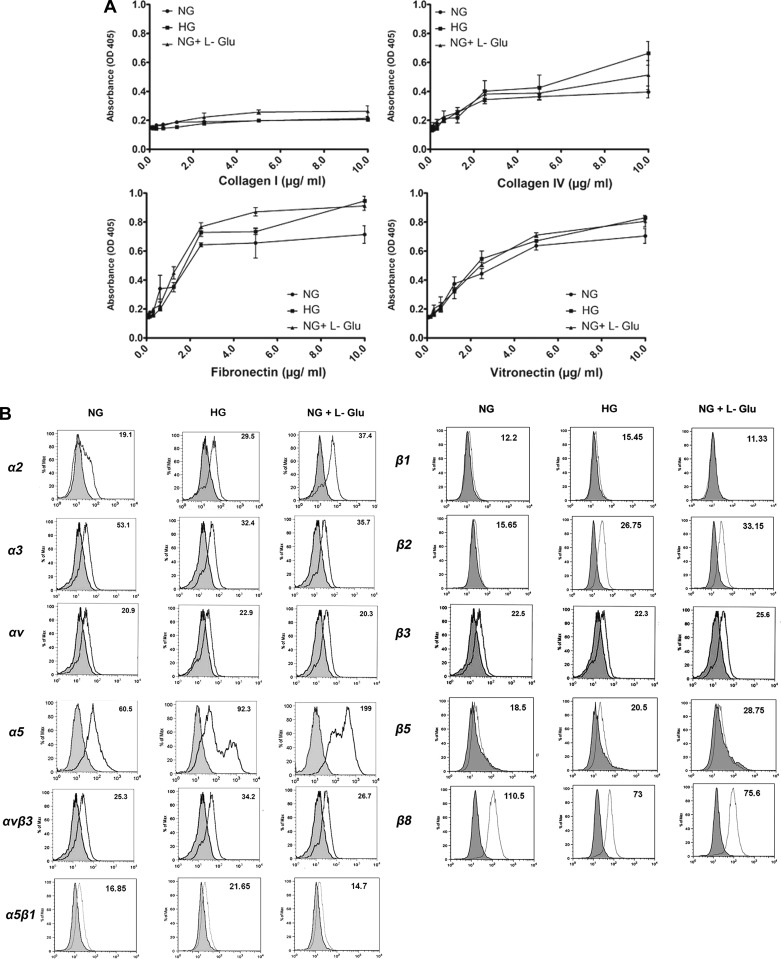
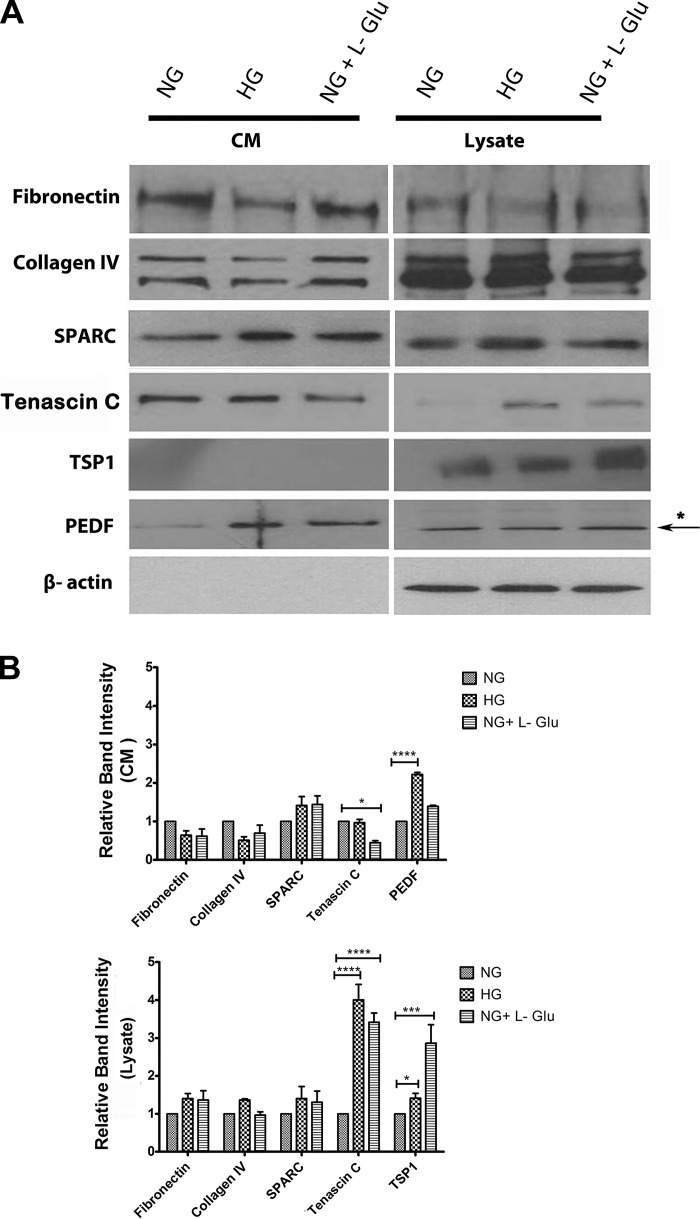
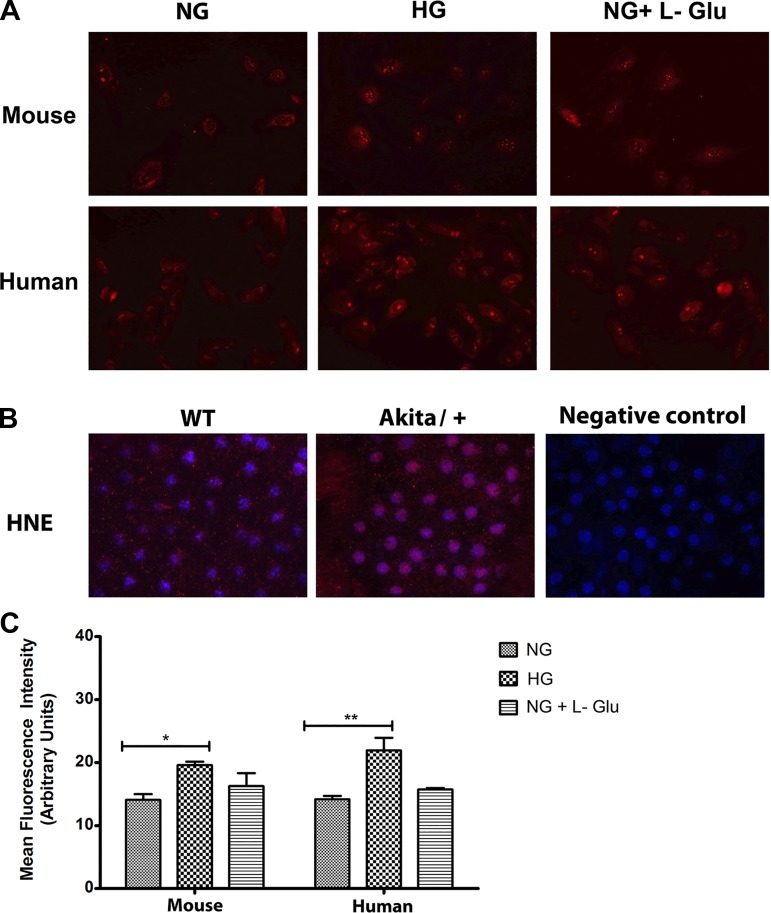
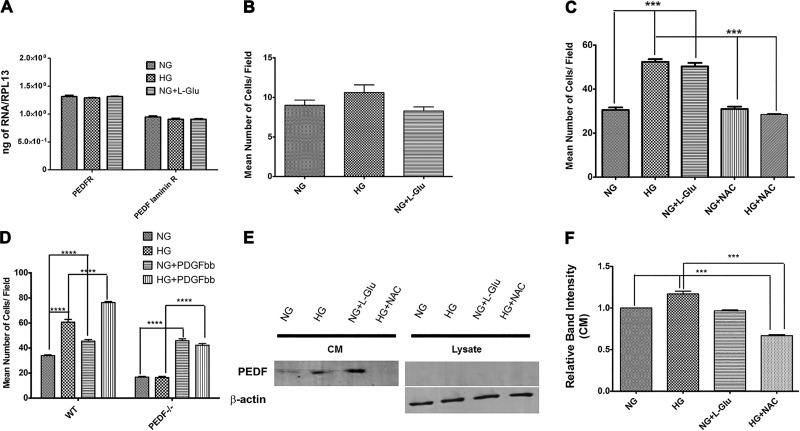
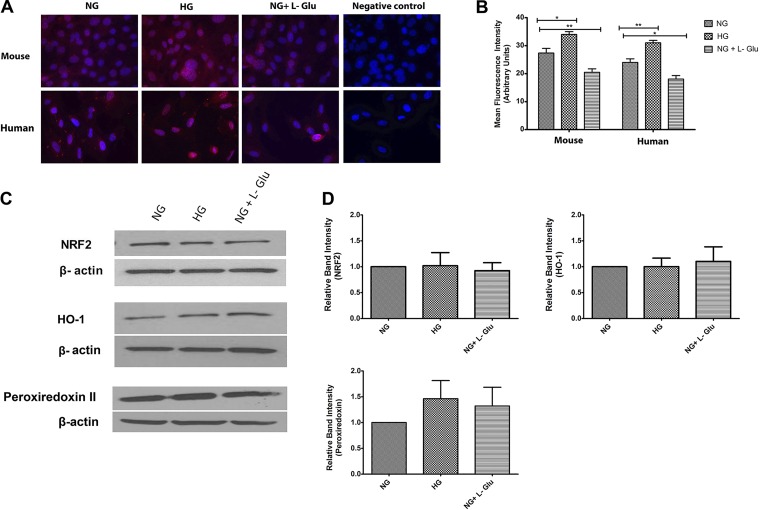
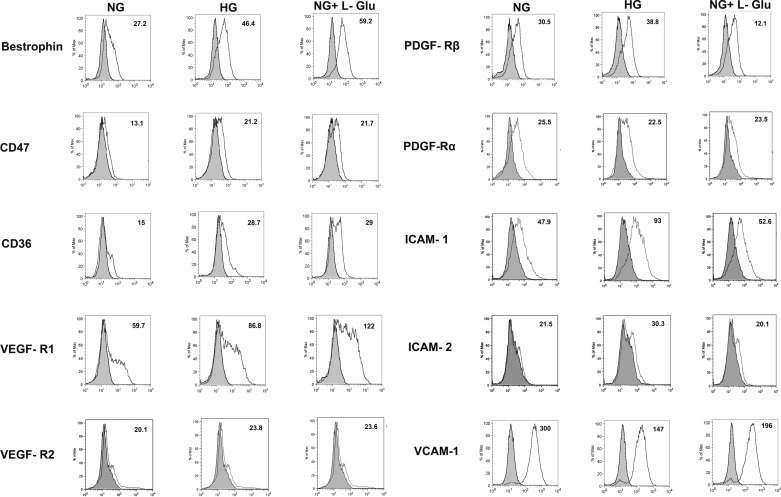
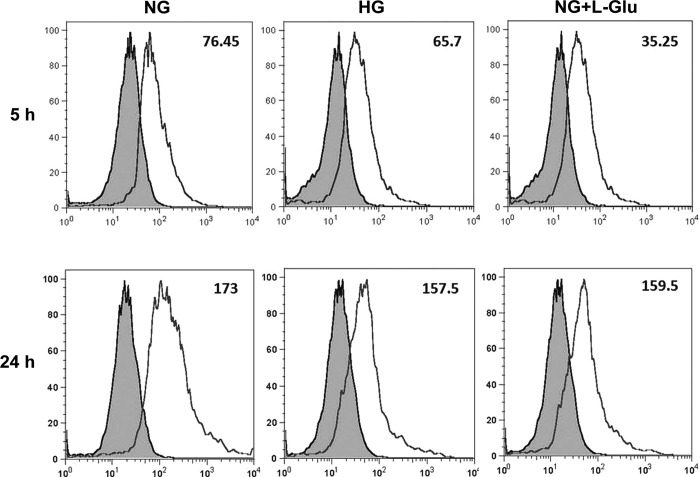
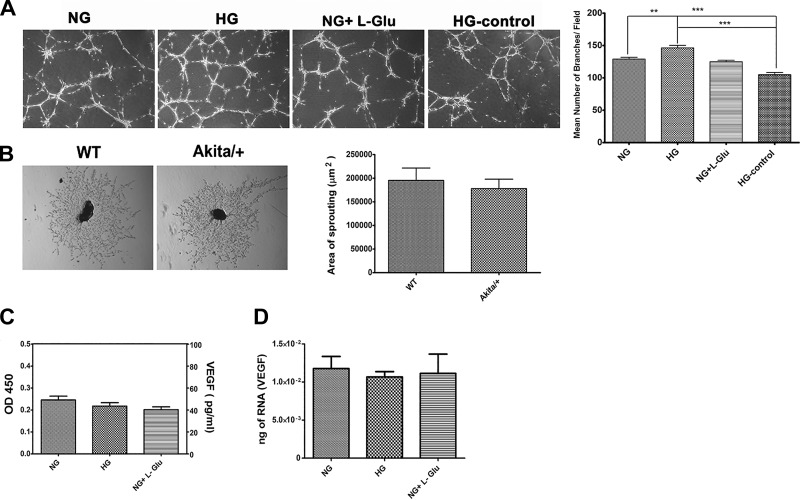
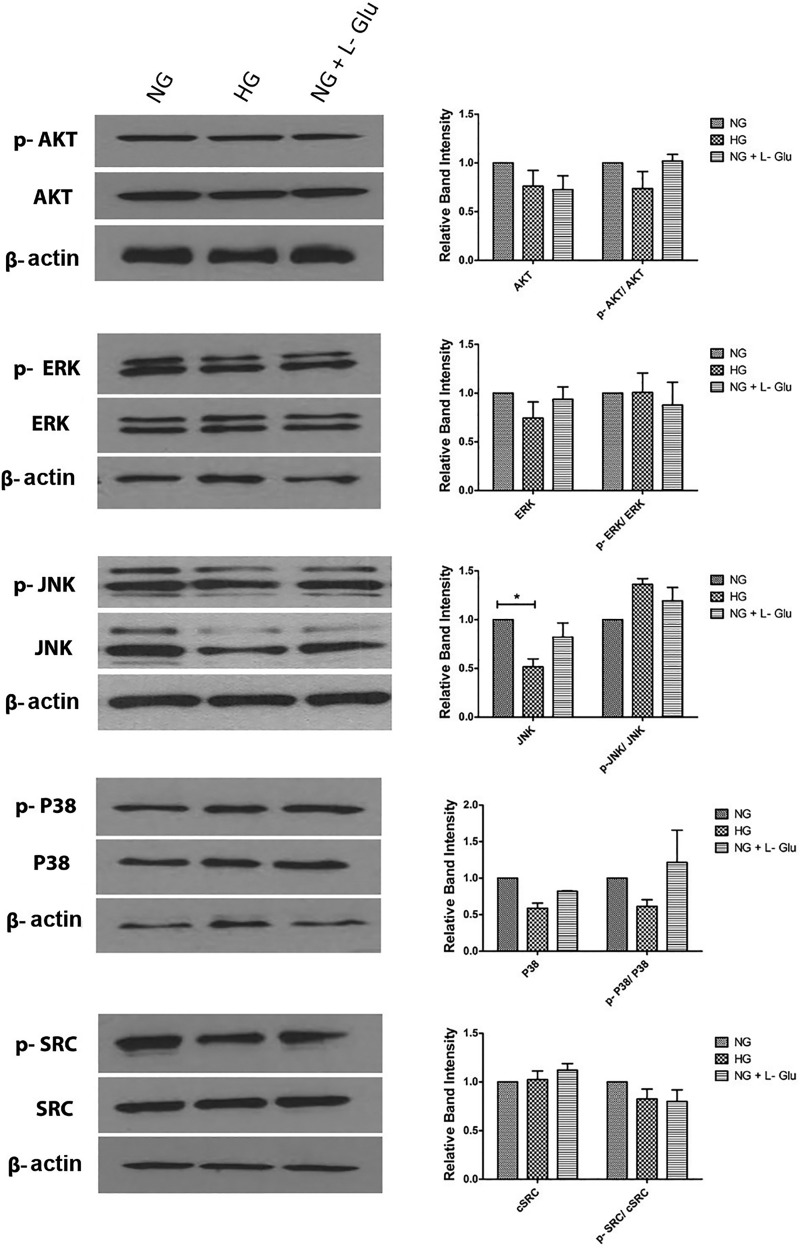
Defects in the outer blood-retinal barrier have significant impact on the pathogenesis of diabetic retinopathy and macular edema. However, the detailed mechanisms involved remain largely unknown. This is, in part, attributed to the lack of suitable animal and cell culture models, including those of mouse origin. We recently reported a method for the culture of retinal pigment epithelial (RPE) cells from wild-type and transgenic mice. The RPE cells are responsible for maintaining the integrity of the outer blood-retinal barrier whose dysfunction during diabetes has a significant impact on vision. Here we determined the impact of high glucose on the function of RPE cells. We showed that high glucose conditions resulted in enhanced migration and increased the level of oxidative stress in RPE cells, but minimally impacted their rate of proliferation and apoptosis. High glucose also minimally affected the cell-matrix and cell-cell interactions of RPE cells. However, the expression of integrins and extracellular matrix proteins including pigment epithelium-derived factor (PEDF) were altered under high glucose conditions. Incubation of RPE cells with the antioxidant N-acetylcysteine under high glucose conditions restored normal migration and PEDF expression. These cells also exhibited increased nuclear localization of the antioxidant transcription factor Nrf2 and ZO-1, reduced levels of β-catenin and phagocytic activity, and minimal effect on production of vascular endothelial growth factor, inflammatory cytokines, and Akt, MAPK, and Src signaling pathways. Thus high glucose conditions promote RPE cell migration through increased oxidative stress and expression of PEDF without a significant effect on the rate of proliferation and apoptosis.

Keywords: apoptosis; cell signaling; diabetes; diabetic retinopathy; outer retinal barrier.


Figures

Fig. 1.
Fig. 1.
Increased migration of RPE cells in high glucose conditions. A: a scratch wound assay of mouse RPE cells cultured under different glucose conditions was used to determine their migration activity. Wound closure was monitored by phase microscopy, and digital images were captured at indicated time points. The degree of migration was assessed by determining the percent wound closure (**P < 0.01, ***P < 0.001, n = 3). B: migration of mouse RPE cells in different glucose conditions using a transwell assay. Please note a significant increase in the migration of RPE cells cultured in high glucose and osmotic stress conditions compared with normal glucose (**P < 0.01, n = 3). C: migration of human RPE cells incubated under different glucose conditions using a transwell assay. Please note high glucose and osmotic stress similarly resulted in a significant increase in the migration of human RPE cells (**P < 0.01, n = 3).
Fig. 2.
Fig. 2.
High glucose conditions minimally affected the proliferation and apoptosis of RPE cells. A: the rate of RPE cell proliferation incubated under various glucose conditions was determined by counting the number of cells as detailed in materials and methods. High glucose conditions did not affect the proliferation rate of RPE cells compared with controls. B: the rate of DNA synthesis in RPE cells under various glucose conditions was determined by EdU labeling. No significant changes in the rate of DNA synthesis was observed in RPE cells under high glucose conditions compared with controls. C: the rate of apoptosis in RPE cells cultured in different glucose conditions was determined by TdT-dUTP terminal nick-end labeling (TUNNEL) assay. Please note no significant differences were observed in the apoptosis of RPE cells in different glucose conditions (P > 0.05, n = 3). D: similar results were observed by determining the percentage of cells that were positive for cleaved caspase-3 in different glucose conditions (P > 0.05, n = 3).
Fig. 3.
Fig. 3.
Adhesion and expression of integrins in RPE cells cultured in different glucose conditions. A: adhesion of RPE cells to collagen IV, collagen I, vitronectin, and fibronectin was determined as described in materials and methods. Please note similar adhesion of RPE cells to collagen I, collagen IV, fibronectin, and vitronectin in different glucose conditions B: expression of integrins in RPE cells. The expression of α1, α2, α3, α5, αv, β1, β2, β3, β5, β8, α5β1, and αvβ3 integrins was determined by FACS analysis as described in materials and methods. The α1 expression was not detected in RPE cells under various glucose conditions (not shown). The expression level of αvβ3 and α5, as well as β1, β2, and β5, and α5β1 were increased, while that of α3 and β8 was decreased in high glucose conditions. Although some of these changes (αvβ3, α5β1, and β1) were observed in high glucose, other changes (α5, β2, β5, and β8) were also observed under osmotic stress. These experiments were repeated with two different isolations of RPE cells with similar results.
Fig. 4.
Fig. 4.
The cellular localization and expression of junctional proteins. A: the localization of ZO-1, N-cadherin, and β-catenin was determined by immunofluorescence staining. Mouse RPE cells were plated on fibronectin-coated (2 μg/ml) chamber slides in different glucose conditions and stained with specific antibodies as detailed in materials and methods. No staining was observed in the absence of primary antibody (not shown). Please note reduced junctional localization of ZO-1 as well as its increased nuclear localization in RPE cells in high glucose. B: the localization of ZO-1 in human RPE cells. Similar to mouse RPE cells, high glucose resulted in increased nuclear localization of ZO-1 in human RPE cells. C: Wholemount staining of RPE layer in RPE-choroid tissues prepared from wild-type (WT) (nondiabetic) and Akita/+ (diabetic) mice. Please note increased ZO-1 nuclear staining in RPE-choroid tissues from Akita/+ mice compared with wild-type mice. These experiments were repeated with eyes from five mice with similar results. Control is staining with no primary antibody. D: the quantitative assessment of A and B. **P < 0.01, ***P < 0.001. E: Western blot analysis of junctional proteins. Total cell lysates were prepared from RPE cells in different glucose conditions and analyzed for expression of ZO-1, N-cadherin, β-catenin, P120-catenin, and β-actin. Please note a significant decrease in expression of β-catenin in RPE cells cultured in high glucose. There were no significant changes in the levels of N-cadherin, ZO-1, and P-120 catenin under different glucose conditions. The β-actin was used for loading control (*P < 0.05, n = 3).
Fig. 5.
Fig. 5.
Altered expression of ECM proteins in RPE cells. A: RPE cells were plated on gelatin-coated 60-mm dishes in different glucose conditions for 5 days and then were incubated for 48 h in serum-free growth medium in different glucose conditions. The conditioned medium (CM) and cell lysates were prepared for Western blot analysis of different ECM proteins as described in materials and methods. The expression of fibronectin, collagen IV, tenascin C, TSP1, PEDF, and SPARC were determined using specific antibodies. The β-actin was used as a loading control for cell lysates. Please note a significant increase in the level of tenascin C and TSP1 in cell lysates in high glucose and osmotic stress compared with normal glucose. B: the quantitative assessment of the data (*P < 0.05, ***P < 0.001, and ****P < 0.0001, n = 3). Only the level of PEDF was significantly increased in conditioned medium of RPE cells in high glucose. We also examined the levels of periostin, opticin, and osteopontin and there were no significant changes (not shown).
Fig. 6.
Fig. 6.
Increased oxidative stress in RPE cells in high glucose. A: the level of oxidative stress in mouse and human RPE cells was assessed by dihydroethidium staining. A significant increase in the level of ROS was detected in high glucose in both mouse and human RPE cells compared with normal glucose or osmotic stress. B: Wholemount staining of RPE-choroid tissues prepared from wild-type and Akita/+ mice with antibody to 4-hydroxy-2-nanonal (HNE). Please note increased HNE staining in RPE-choroid tissues from Akita/+ mice compared with wild-type mice. These experiments were repeated with two different isolations of RPE cells and eyes from five different mice with similar results. C: the quantitative assessment of data in A (*P < 0.05 and **P < 0.01, n = 3).
Fig. 7.
Fig. 7.
Incubation of RPE cells with NAC restored their migration in high glucose conditions. A: expression of PEDF receptors in RPE cells cultured in different glucose conditions. RPE cells expressed both the PEDFR and laminin R receptor without any changes in their expression in different glucose condition. B: migration of PEDF−/− RPE cells in different glucose conditions using a transwell assay. Please note there is no significant difference in the migration of PEDF−/− RPE cells in high glucose conditions. C: migration of wild-type RPE cells incubated under various glucose conditions using a transwell assay. Please note a significant increase in migration of RPE cells in high glucose conditions that was restored to normal glucose level in the presence of NAC (***P < 0.001, n = 3). Unconditioned high glucose medium or normal glucose conditioned medium with NAC had no effect on migration of RPE cells. D: migration of wild-type and PEDF−/− RPE cells in response to high glucose with or without PDGF-BB. Please note PEDF−/− RPE cells are less migratory compared with wild-type cells regardless of the glucose conditions. In addition, PDGF-BB enhanced the migration of wild-type and PEDF−/− RPE cells regardless of glucose conditions. E and F: expression of PEDF in RPE cells in different glucose conditions. Please note a significant increase in the level of PEDF in RPE cells in high glucose that was reduced to near normal levels in the presence of NAC. (***P < 0.001, n = 3).
Fig. 8.
Fig. 8.
Cellular localization and expression of NRF2 and its downstream target genes Ho-1 and Prdx2. A: the localization of NRF2 was determined by immunofluorescence staining. Mouse and human RPE cells were plated on fibronectin-coated chamber slides in different glucose conditions and stained with specific antibodies as detailed in materials and methods. No staining was observed in the absence of primary antibody (negative control). Please note increased nuclear localization of NRF2 in both human and mouse RPE cells in high glucose. B: the quantitative assessment of the data (*P < 0.05 and **P < 0.01, n = 3). C: the expression of NRF2, HO-1, and peroxiredoxin II was determined by using specific antibodies. The β-actin was used as a loading control. D: the quantitative assessment of data (P > 0.05, n = 3).
Fig. 9.
Fig. 9.
Expression of inflammatory mediators in RPE cells cultured in different glucose conditions. A–F: the expression of various inflammatory mediators (IL-18, RANTES, TNF-α, MCP-1, IL-6, and IL-1β) was assessed by quantitative real-time PCR using RNA prepared from RPE cells in different glucose conditions as described in materials and methods. No significant changes in the expression of inflammatory mediators were observed in REP cells cultured in different glucose (P > 0.05, n = 3). G: expression of various proteins with a proinflammatory role. Total cell lysates were prepared from RPE cells in different glucose conditions and analyzed by Western blotting for expression of MFG-E8, PDI, COX-1, COX-2, and PAR-3. The β-actin was used for loading control. H: the quantitative assessment of data. There were no significant differences in the level of these proteins in different glucose conditions, (P > 0.05, n = 3).
Fig. 10.
Fig. 10.
Expression of RPE cell markers. The RPE cells cultured in different glucose conditions were examined for expression of bestrophin, CD47, CD36, VEGF-R1, VEGF-R2, PDGF-Rα, PDGF-Rβ, ICAM-1, ICAM-2, and VCAM-1 by FACS analysis. The shaded area shows control IgG staining. Please note the increased level of bestrophin, CD47, CD36, and VEGF-R1 in high glucose and osmotic stress conditions, whereas increased ICAM-1, ICAM-2, and PDGF-Rβ expression levels only occurred in high glucose compared with control. The expression of VEGF-R2 and PDGF-Rα was low and did not change in different glucose conditions. In contrast, the level of VCAM-1 was significantly decreased in high glucose and osmotic stress. A decrease in PDGF-Rβ level was also noted in osmotic stress. The mean fluorescence intensities are shown for each sample. These experiments were repeated with two different isolations of RPE cells with similar results.
Fig. 11.
Fig. 11.
Altered phagocytic activity of RPE cells. The RPE cells in different glucose conditions were incubated with medium containing pHrodo TM green Escherichia coli BioParticles conjugates for different times (5 and 24 h). The cellular fluorescence intensities were determined by FACS analysis. Please note the decreased phagocytic activity of RPE cells in high glucose and osmotic stress conditions compared with normal glucose. The mean fluorescence intensities are shown for each sample. These experiments were repeated with two different isolations of RPE cells with similar results.
Fig. 12.
Fig. 12.
The capillary morphogenesis of choroidal EC and sprouting of RPE-choroidal explants. A: the capillary morphogenesis of choroidal EC incubated with conditioned medium prepared from RPE cells in different glucose conditions. Unconditioned high glucose medium was used as a control. Please note a significant increase in branching morphogenesis of choroidal EC incubated with conditioned medium prepared from RPE cells cultured in high glucose (**P < 0.01 and ***P < 0.001, n = 3). B: sprouting of choroid-RPE tissues prepared from 3-mo-old wild-type and Akita/+ mice. Images shown here represent results obtained from five different mice with the desired genotype (×40). Please note no significant difference was observed in the degree of choroidal sprouting in Akita/+ mice compared with wild-type mice (P > 0.05, n = 5). C: the level of secreted VEGF protein was determined in conditioned medium collected from RPE cells in different glucose conditions by using an ELISA. Please note there was no significant difference in the amount of VEGF produced by RPE cells in different glucose conditions (P > 0.05, n = 3). D: the level of VEGF mRNA was determined by qPCR using RNA prepared from RPE cells in different glucose conditions. Please note there was no significant difference in the amount of VEGF mRNA detected in RPE cells in different glucose conditions (P > 0.05, n = 3).
Fig. 13.
Fig. 13.
High glucose conditions minimally affected the Src, Akt, and MAPK signaling pathways. The steady state levels and activation status of Src kinase, MAPK, and Akt pathways were evaluated by Western blot analysis of lysates prepared from RPE cells in different glucose conditions by using specific antibodies as detailed in materials and methods. Please note no significant changes in these pathways were detected in different glucose conditions (P > 0.05, n = 3). Please also note decreased levels of JNK in RPE cells in high glucose compared with normal glucose or osmotic stress (*P < 0.05, n = 3). These experiments were repeated with two different isolations of RPE cells with similar results.

Similar articles

Cited by

References

    1. Abcouwer SF, Antonetti DA. A role for systemic inflammation in diabetic retinopathy. Invest Ophthalmol Vis Sci 54: 2384, 2013. - PubMed
    1. Ablonczy Z, Crosson CE. VEGF modulation of retinal pigment epithelium resistance. Exp Eye Res 85: 762–771, 2007. - PMC - PubMed
    1. Ablonczy Z, Crosson CE. VEGF modulation of retinal pigment epithelium resistance. Exp Eye Res 85: 762–771, 2007. - PMC - PubMed
    1. Aiello LP. Angiogenic pathways in diabetic retinopathy. N Engl J Med 353: 839–841, 2005. - PubMed
    1. Al-Shabrawey M, Mussell R, Kahook K, Tawfik A, Eladl M, Sarthy V, Nussbaum J, El-Marakby A, Park SY, Gurel Z, Sheibani N, Maddipati KR. Increased expression and activity of 12-lipoxygenase in oxygen-induced ischemic retinopathy and proliferative diabetic retinopathy: implications in retinal neovascularization. Diabetes 60: 614–624, 2011. - PMC - PubMed

Publication types

MeSH terms