. 2017 Jan 1;595(1):141-164.
doi: 10.1113/JP272950. Epub 2016 Sep 15.

Progressive impairment of cerebellar mGluR signalling and its therapeutic potential for cerebellar ataxia in spinocerebellar ataxia type 1 model mice

Affiliations

Progressive impairment of cerebellar mGluR signalling and its therapeutic potential for cerebellar ataxia in spinocerebellar ataxia type 1 model mice

Anton N Shuvaev et al. J Physiol. .

Abstract

Key points: Spinocerebellar ataxia type 1 (SCA1) is a progressive neurodegenerative disease caused by a gene defect, leading to movement disorder such as cerebellar ataxia. It remains largely unknown which functional defect contributes to the cerebellar ataxic phenotype in SCA1. In this study, we report progressive dysfunction of metabotropic glutamate receptor (mGluR) signalling, which leads to smaller slow synaptic responses, reduced dendritic Ca2+ signals and impaired synaptic plasticity at cerebellar synapses, in the early disease stage of SCA1 model mice. We also show that enhancement of mGluR signalling by a clinically available drug, baclofen, leads to improvement of motor performance in SCA1 mice. SCA1 is an incurable disease with no effective treatment, and our results may provide mechanistic grounds for targeting mGluRs and a novel drug therapy with baclofen to treat SCA1 patients in the future.

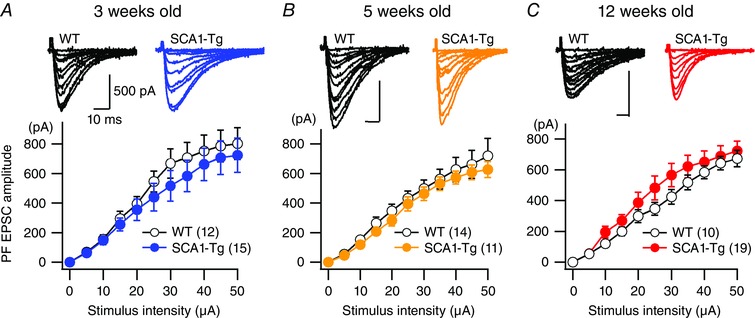
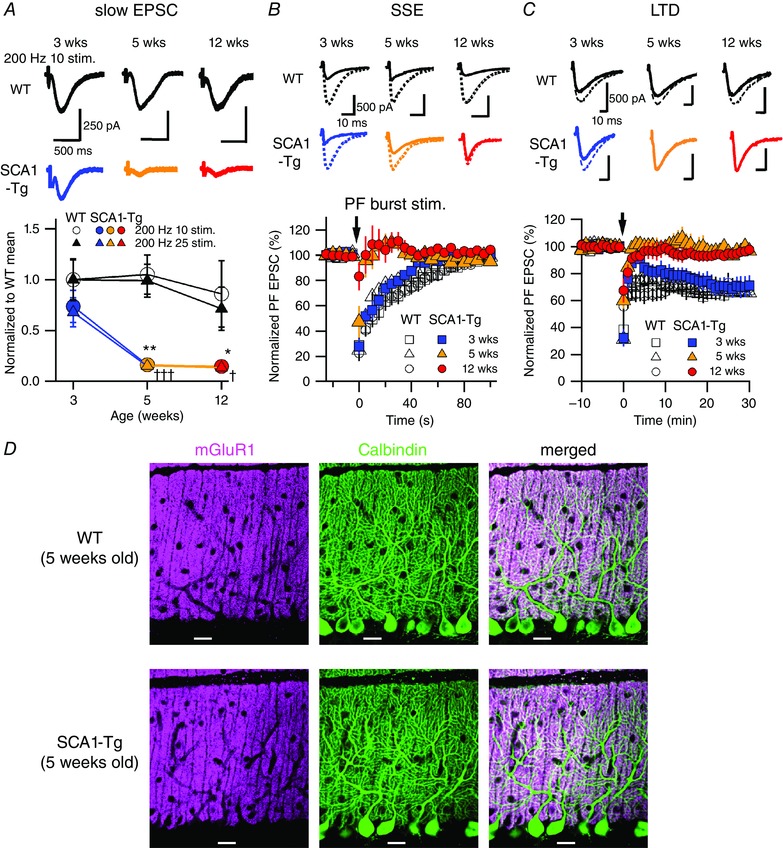
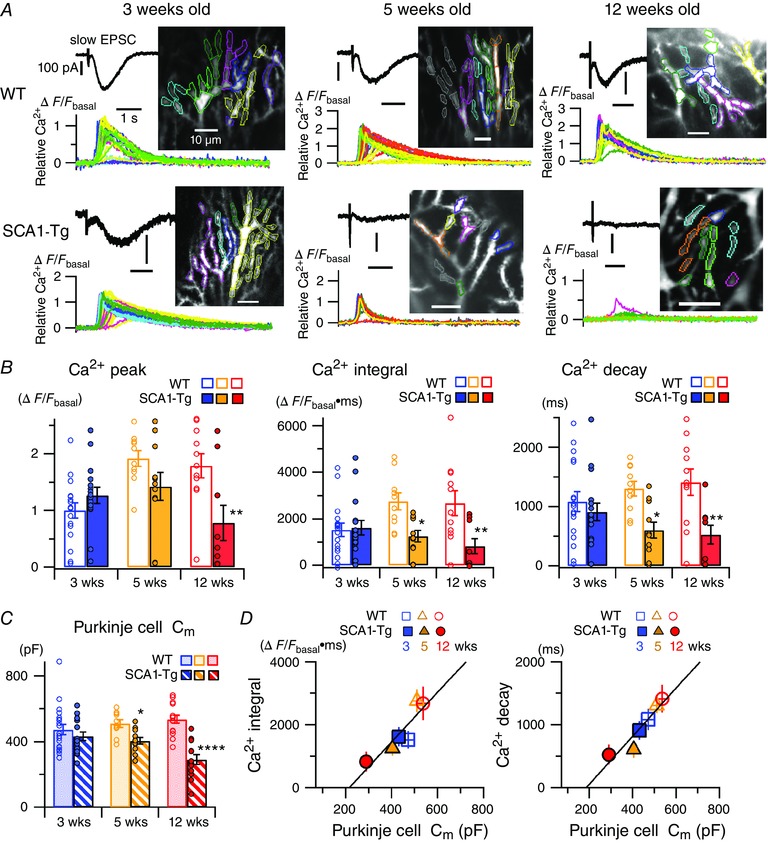
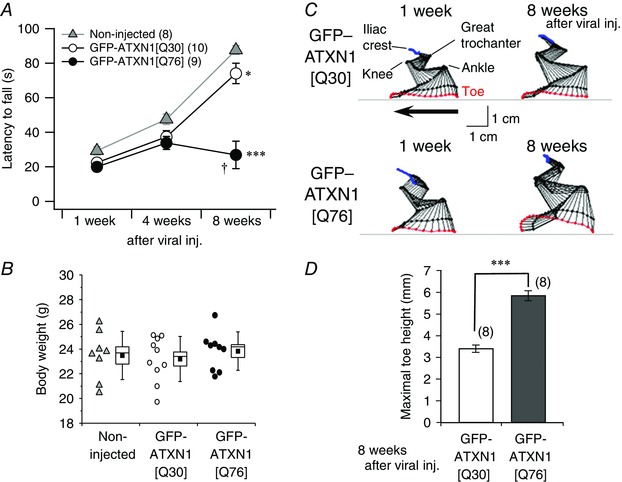
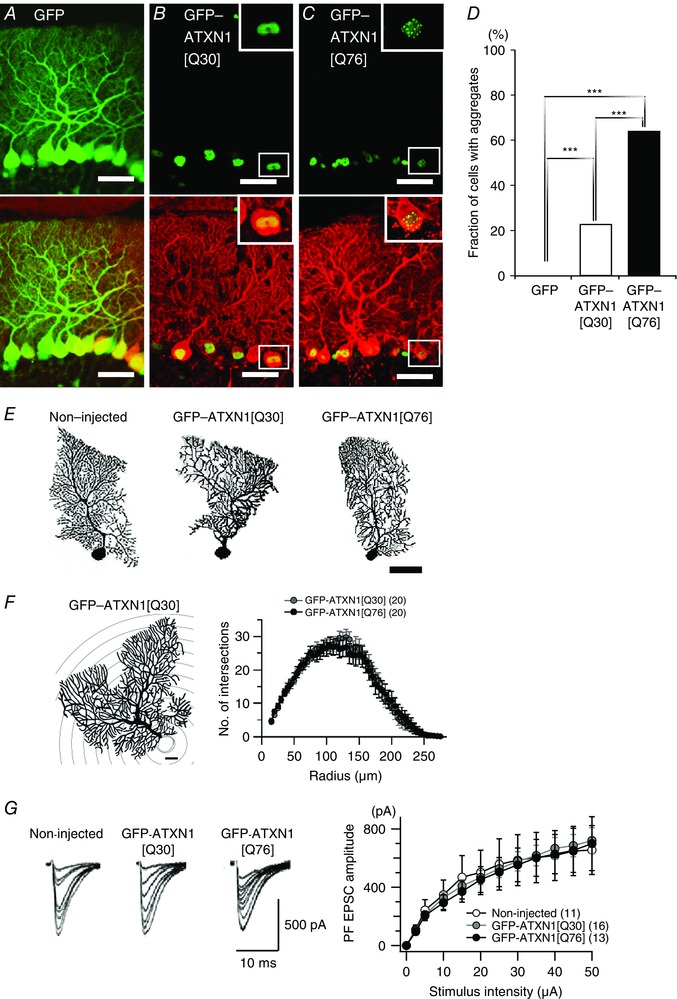
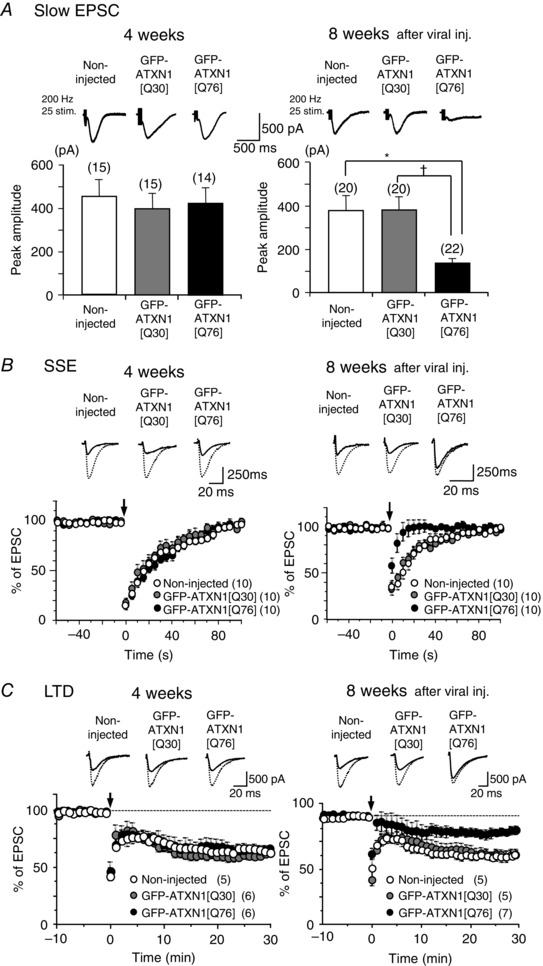
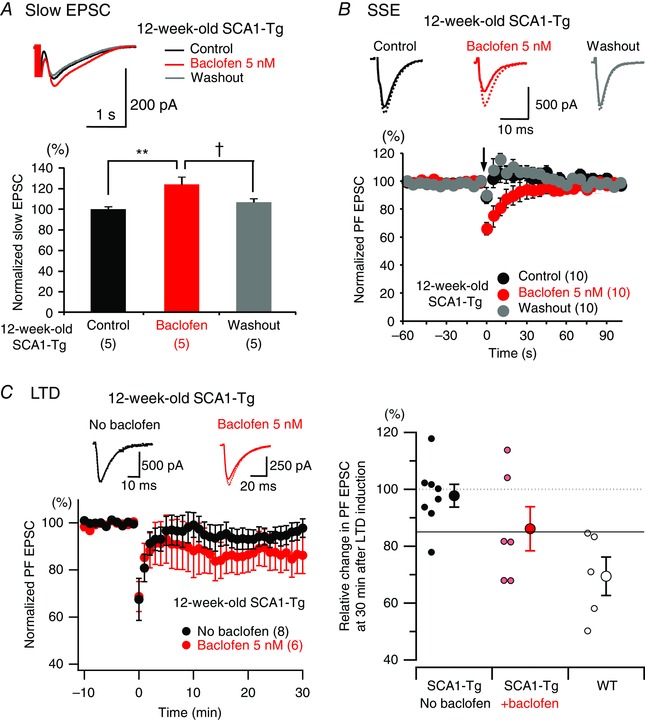
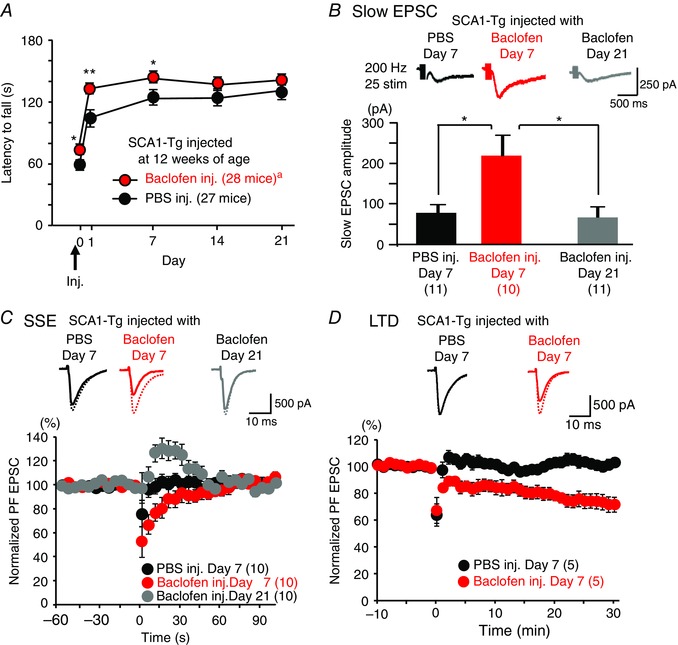
Abstract: Spinocerebellar ataxia type 1 (SCA1) is a progressive neurodegenerative disease that presents with cerebellar ataxia and motor learning defects. Previous studies have indicated that the pathology of SCA1, as well as other ataxic diseases, is related to signalling pathways mediated by the metabotropic glutamate receptor type 1 (mGluR1), which is indispensable for proper motor coordination and learning. However, the functional contribution of mGluR signalling to SCA1 pathology is unclear. In the present study, we show that SCA1 model mice develop a functional impairment of mGluR signalling which mediates slow synaptic responses, dendritic Ca2+ signals, and short- and long-term synaptic plasticity at parallel fibre (PF)-Purkinje cell (PC) synapses in a progressive manner from the early disease stage (5 postnatal weeks) prior to PC death. Notably, impairment of mGluR-mediated dendritic Ca2+ signals linearly correlated with a reduction of PC capacitance (cell surface area) in disease progression. Enhancement of mGluR signalling by baclofen, a clinically available GABAB receptor agonist, led to an improvement of motor performance in SCA1 mice and the improvement lasted ∼1 week after a single application of baclofen. Moreover, the restoration of motor performance in baclofen-treated SCA1 mice matched the functional recovery of mGluR-mediated slow synaptic currents and mGluR-dependent short- and long-term synaptic plasticity. These results suggest that impairment of synaptic mGluR cascades is one of the important contributing factors to cerebellar ataxia in early and middle stages of SCA1 pathology, and that modulation of mGluR signalling by baclofen or other clinical interventions may be therapeutic targets to treat SCA1.

Keywords: calcium imaging; cerebellar ataxia; metabotropic glutamate receptor; purkinje cell; synaptic plasticity.


Figures

Figure 1
Figure 1. No major change was observed in basal fast excitatory synaptic transmission at PF‐PC synapses in SCA1‐Tg PCs
AC, averaged relationship between stimulus intensity and PF EPSC amplitude of 3‐week‐old (A, presymptomatic), 5‐week‐old (B, early disease stage) and 12‐week‐old (C, middle disease stage) WT (open circles) and SCA1‐Tg (filled circles) mice. Upper panels show representative traces of PF EPSCs. The numbers of tested PCs are indicated in parentheses and all of the data in each condition were obtained from at least three mice in this and subsequent figures and table. At all the ages examined, a repeated‐measures ANOVA indicates no significance for genotype (3 weeks old, F 1,25 = 0.50, P = 0.48; 5 weeks old, F 1,23 = 0.47, P = 0.50; 12 weeks old, F 1,26 = 0.86, P = 0.36) and genotype × stimulus intensity interaction (3 weeks old, F 10,250 = 0.46, P = 0.91; 5 weeks old, F 10,230 = 0.25, P = 0.99; 12 weeks old, F 10,260 = 0.823, P = 0.61). [Colour figure can be viewed at wileyonlinelibrary.com]
Figure 2
Figure 2. Progressive disruption of mGluR1‐mediated slow EPSCs and synaptic plasticity at PF‐PC synapses in SCA1‐Tg mice
A, traces of mGluR1‐mediated slow EPSCs recorded from PCs in WT mice (top) and in SCA1‐Tg mice (middle) with AMPA receptors blocked by NBQX (20 μm). Stimulus artefacts are partially truncated. Bottom, pooled data of the recorded slow EPSCs normalized to the 3‐week‐old WT mean value in 10 or 25 pulses at 200 Hz. Two‐way ANOVAs with genotype (WT and SCA1‐Tg) and age (3, 5 and 12 weeks old) as factors indicate significant effects of genotype with no significant interaction (genotype × age) in both the stimulus patterns (200 Hz 10 stim.; genotype F 1,64 = 17.16, P = 0.0001; age F 2,64 = 2.21, P = 0.12; interaction F 2,64 = 1.68, P = 0.20; comparison between WT and SCA1‐Tg mice, 3 weeks P = 0.28, 5 weeks ** P < 0.005, 12 weeks * P < 0.05: 200 Hz 25 stim.; genotype F 1,64 = 22.53, P < 0.0001; age F 2,64 = 4.14, P = 0.02; interaction F 2,64 = 1.59, P = 0.21; comparison between WT and SCA1‐Tg mice, 3 weeks P = 0.11, 5 weeks ††† P < 0.001, 12 weeks P < 0.05). B and C, top and middle, traces of AMPA receptor‐mediated fast PF‐evoked EPSCs before (broken lines) and after (continuous lines) induction of mGluR1‐dependent short‐term (B, SSE; 1st EPSC traces after the PF bursts) and long‐term synaptic plasticity (C, LTD; EPSC traces 30 min after the conjunctive stimuli). Bottom, pooled data of the fast EPSC amplitudes normalized to the baseline period before and after the induction stimuli (arrows) of SSE (B) and LTD (C). D, confocal images of the cerebellar slices double‐immunostained for mGluR1 (magenta) and Calbindin (green; a PC‐specific marker). Scale bars = 20 μm. [Colour figure can be viewed at wileyonlinelibrary.com]
Figure 3
Figure 3. Progressive impairment of local dendritic Ca2+ signalling at PF‐PC synapses in SCA1‐Tg mice
A, traces of mGluR‐mediated PC responses to short PF burst stimulation (10 pulses at 200 Hz) in the presence of NBQX (10–20 μm) and d‐AP5 (50–100 μm). Black and coloured traces show an electrical response (i.e. slow EPSC) and local dendritic Ca2+ signals in a single sweep recording, respectively, in each panel. Inset images show regions of interest (ROIs) on the dendrites of the recorded cells and the individual Ca2+ traces originate from the ROIs with the same colour code in each panel. B and C, pooled data of quantified Ca2+ signals (B, see Methods) and membrane capacitance (C m) (C) of the recorded PCs in 3‐, 5‐ and 12‐week‐old mice. Symbols and bars indicate individual data points and mean values of the data, respectively. Multiple comparisons between WT and SCA1‐Tg mice at each age after two‐way ANOVAs indicate significant differences (* P < 0.05, ** P < 0.005, **** P < 0.0001). All the ANOVAs demonstrate significant genotype effects in Ca2+ peak (F 1,68 = 6.58, P < 0.05), Ca2+ integral (F 1,68 = 13.72, P < 0.0005), Ca2+ decay (F 1,68 = 17.15, P < 0.0001) and C m of PCs (F 1,81 = 31.87, P < 0.0001). D, linear correlation between mean C m values and mean values of the Ca2+ integrals (left, Pearson's correlation coefficient, r = 0.90) or those of the Ca2+ decays (right, r = 0.94). [Colour figure can be viewed at wileyonlinelibrary.com]
Figure 4
Figure 4. Progressive impairment of motor behaviour in mice expressing virally transduced abnormal Ataxin‐1
A, averaged data of rotarod performance in naive mice (grey triangles) and age‐matched mice treated with lentiviral vectors expressing normal GFP‐ATXN1[Q30] (open circles) and pathogenic GFP‐ATXN1[Q76] (filled circles) at 1, 4 and 8 weeks after viral injection (viral inj.). The number of mice tested in each group is shown in parentheses. A two‐way repeated measures ANOVA indicates significant effects of genotype (F 2,24 = 21.5, P < 0.0001), time (F 2,48 = 78.0, P < 0.0001) and interaction (F 2,24 = 21.5, P < 0.0001). Multiple comparison tests between genotype at 8 weeks after viral injection show significant differences (* P < 0.05, *** P < 0.0001 in comparison with non‐injected mice; P < 0.05 compared with GFP‐ATXN1[Q30] mice). B, body weights of the mice not treated and treated with lentiviral vectors expressing GFP‐ATXN1[Q30] or GFP‐ATXN1[Q76] 8 weeks after injection. C, hindlimb kinematic analysis of the mice treated with lentiviral vectors expressing GFP‐ATXN1[Q30] (upper panel) or GFP‐ATXN1[Q76] (lower panel). Stick diagram depicting left hindlimb movement in the mice at 1 and 8 weeks following injection. The arrow indicates the direction of limb movement. D, summary graph showing the maximum toe height of the left hindlimb while walking. *** P < 0.0001. [Colour figure can be viewed at wileyonlinelibrary.com]
Figure 5
Figure 5. Nuclear aggregate formation, morphology and basal PF EPSC in PCs with virally expressed abnormal Ataxin‐1
A–C, cerebellar slices from mice treated with lentiviral vectors were immunostained 8 weeks after viral injection. Upper and lower panels show native GFP fluorescence and GFP signal overlapped with Calbindin immunofluorescence, respectively. Insets show enlarged PC somas from white‐boxed areas in the corresponding images. Scale bars = 50 μm. PCs expressing lentivirally transduced GFP (A), non‐pathogenic GFP‐ATXN1[Q30] (B) or abnormal GFP‐ATXN1[Q76] (C). D, summary graph showing the percentages of aggregate‐positive PCs. More than 400 PCs from three mice were examined in each condition. *** P < 0.0001; Fisher's exact test followed by Holm's multiple pairwise correction. E, representative biocytin‐labelled PC images 8 weeks after injection. Scale bar = 50 μm. F, Sholl analysis to examine the complexity of the PC morphology. Left, schematic representation of the analysis. Sampling concentric shells with 20 μm radius steps are shown for illustration. The PC soma (grey) was excluded from the analysis. Scale bar = 20 μm. Right, the average number of intersections between the dendrites and the concentric shells at different distances from the soma. G, stimulus intensity–EPSC amplitude relationship of PF‐PC EPSCs from non‐injected mice and those that received lentiviral vectors expressing GFP‐ATXN1[Q30] or GFP‐ATXN1[Q76]. Left panel shows representative traces of PF EPSCs elicited by increasing electrical stimulation intensity. The number of PCs examined in each group is shown in parentheses. Two‐way repeated measures ANOVAs indicate no significant difference in the dendritic complexity of PCs (F right, genotype effect, F 1,38 = 0.08, P = 0.77; interaction, F 52,1976 = 0.31, P > 0.99) or the PF EPSC amplitudes (G right, genotype effect, F 2,37 = 0.02, P = 0.98; interaction, F 22,407 = 0.16, P > 0.99). [Colour figure can be viewed at wileyonlinelibrary.com]
Figure 6
Figure 6. Impairment of mGluR‐mediated slow EPSCs, SSE and LTD at PF‐PC synapses in mice expressing virally transduced abnormal Ataxin‐1
A, upper panel shows representative traces of mGluR‐mediated slow EPSCs recorded from PCs in age‐matched non‐injected mice and those injected with lentiviral vectors expressing non‐pathogenic GFP‐ATXN1[Q30] or abnormal GFP‐ATXN1[Q76]. Stimulus artefacts are partially truncated. Lower panels show pooled data of the slow EPSC amplitudes. * P < 0.01, P < 0.01; multiple comparison test after one‐way ANOVA. B and C, upper panels show representative traces of AMPA receptor‐mediated fast PF EPSCs before (broken lines) and after (continuous lines) induction of mGluR‐dependent SSE (4 weeks, the first EPSC traces after induction; 8 weeks, the second EPSC traces after induction) or LTD (EPSC traces 30 min after induction). Lower panels show pooled data for the fast PF EPSC amplitudes normalized to the baseline period before and after induction of SSE or LTD at time 0 (arrows).
Figure 7
Figure 7. Acute bath application of 5 nM baclofen partially enhances remaining mGluR signalling in cerebellar slices of 12‐week‐old SCA1‐Tg mice
A and B, upper panels show representative traces of remaining slow EPSCs (A, evoked by PF burst stimulation with 25 electrical pulses at 200 Hz; averaged traces from 20 responses) and AMPA receptor‐mediated fast PF EPSCs in SSE experiments (B, broken lines indicate basal PF EPSCs before SSE induction and continuous lines indicate the first EPSCs after the induction) before application (Control, black), in the presence (Baclofen, red) and after washing out (Washout, grey) of 5 nm baclofen. Bar graphs in A show summarized data of the averaged value from 20 responses in each PC of 12‐week‐old SCA1‐Tg mice (** P < 0.01 between Control and Baclofen groups; P < 0.05 between Baclofen and Washout groups; significance determined by one‐way ANOVA followed by Tukey's post hoc test). Lower panel in B shows the time course of the normalized PF EPSC amplitudes in the SSE experiment of 12‐week‐old SCA1‐Tg mice. C, left upper panel indicates representative basal PF EPSCs (the last EPSC before the induction, broken lines) and the EPSC 30 min after LTD induction (continuous lines). Left lower panel shows the time course of the normalized PF EPSC in LTD experiment of 12‐week‐old SCA1‐Tg mice in the absence and presence of baclofen (5 nm). Baclofen was bath‐applied > 10 min prior to LTD induction. The LTD data set in the absence of baclofen (No baclofen) is the same as presented in Fig. 2 C. Right, relative change in PF EPSC amplitude 30 min after LTD induction in SCA1‐Tg cerebellar slices without baclofen (black filled circles), those in the presence of baclofen (red filled circles) and WT cerebellar slices (open circles). Larger symbols represent mean values and smaller symbols correspond to individual data points. The solid horizontal line indicates 85% relative change, which can be used as a criterion for successful LTD because all the data points in WT range below this line. [Colour figure can be viewed at wileyonlinelibrary.com]
Figure 8
Figure 8. Baclofen improves rotarod motor performance in SCA1‐Tg mice and the improvement corresponds to restoration of mGluR signalling
A, motor performance examined by an accelerating rotarod test. Baclofen (5 nm) or PBS was applied to the cerebellum of 12‐week‐old SCA1‐Tg mice 3 h before the rotarod test on day 0 (inj.). aThe sample size is different on days 14 and 21 (27 mice). B and C, transient recovery of mGluR‐mediated slow EPSCs (B) and SSE (C) in cerebellar PCs obtained from the baclofen‐treated SCA1‐Tg mice. This recovery effect lasted until day 7 (red) but vanished at day 21 (grey) after a single application of baclofen (5 nm) to the cerebellum of SCA1‐Tg mice. Upper panel in C shows representative basal EPSCs (broken lines, the last EPSCs just before SSE induction) and the following second EPSCs after SSE induction (continuous lines). D, rescue of LTD in PCs from the baclofen‐treated SCA1‐Tg mice at day 7 after the single baclofen infusion to 12‐week‐old SCA1‐Tg mice (red), in comparison with the PBS‐treated SCA1‐Tg mice at day 7. Upper panel shows fast EPSC traces representative of the baseline responses (broken lines, the last EPSC before LTD induction) and the EPSC 30 min after the conjunctive stimulation for LTD. In C and D, induction stimuli for SSE and LTD were applied at time 0. * P < 0.05; ** P < 0.005. [Colour figure can be viewed at wileyonlinelibrary.com]

Comment in

References

    1. Aiba A, Kano M, Chen C, Stanton ME, Fox GD, Herrup K, Zwingman TA & Tonegawa S (1994). Deficient cerebellar long‐term depression and impaired motor learning in mGluR1 mutant mice. Cell 79, 377–388. - PubMed
    1. Armbrust KR, Wang X, Hathorn TJ, Cramer SW, Chen G, Zu T, Kangas T, Zink AN, Oz G, Ebner TJ & Ranum LP (2014). Mutant β‐III spectrin causes mGluR1α mislocalization and functional deficits in a mouse model of spinocerebellar ataxia type 5. J Neurosci 34, 9891–9904. - PMC - PubMed
    1. Barnes JA, Ebner BA, Duvick LA, Gao W, Chen G, Orr HT & Ebner TJ (2011). Abnormalities in the climbing fiber‐Purkinje cell circuitry contribute to neuronal dysfunction in ATXN1[82Q] mice. J Neurosci 31, 12778–12789. - PMC - PubMed
    1. Barski JJ, Hartmann J, Rose CR, Hoebeek F, Morl K, Noll‐Hussong M, De Zeeuw CI, Konnerth A & Meyer M (2003). Calbindin in cerebellar Purkinje cells is a critical determinant of the precision of motor coordination. J Neurosci 23, 3469–3477. - PMC - PubMed
    1. Becker EB (2014). The moonwalker mouse: new insights into TRPC3 function, cerebellar development, and ataxia. Cerebellum 13, 628–636. - PMC - PubMed

Publication types

MeSH terms