

Epstein-Barr Virus Oncoprotein LMP1 Mediates Epigenetic Changes in Host Gene Expression through PARP1
- PMID: 27440880
- PMCID: PMC5021435
- DOI: 10.1128/JVI.01180-16
Epstein-Barr Virus Oncoprotein LMP1 Mediates Epigenetic Changes in Host Gene Expression through PARP1
Abstract
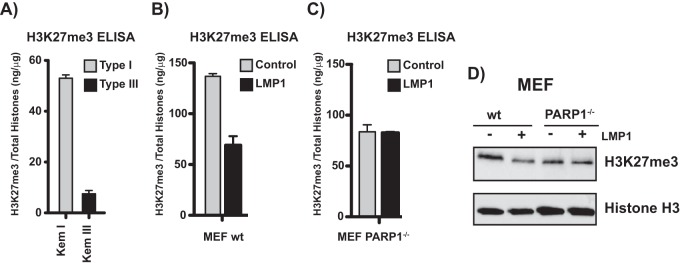
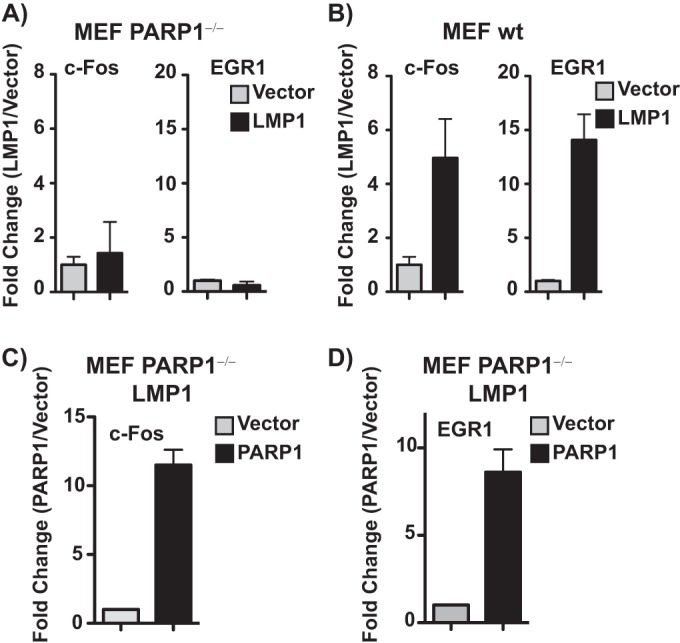
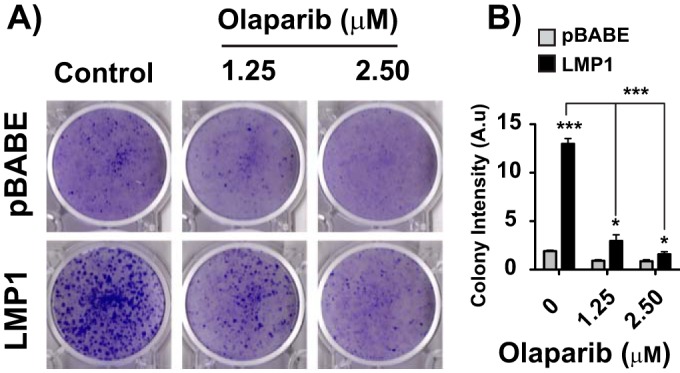
The latent infection of Epstein-Barr virus (EBV) is associated with 1% of human cancer incidence. Poly(ADP-ribosyl)ation (PARylation) is a posttranslational modification catalyzed by poly(ADP-ribose) polymerases (PARPs) that mediate EBV replication during latency. In this study, we detail the mechanisms that drive cellular PARylation during latent EBV infection and the effects of PARylation on host gene expression and cellular function. EBV-infected B cells had higher PAR levels than EBV-negative B cells. Moreover, cellular PAR levels were up to 2-fold greater in type III than type I latently infected EBV B cells. We identified a positive association between expression of the EBV genome-encoded latency membrane protein 1 (LMP1) and PAR levels that was dependent upon PARP1. PARP1 regulates gene expression by numerous mechanisms, including modifying chromatin structure and altering the function of chromatin-modifying enzymes. Since LMP1 is essential in establishing EBV latency and promoting tumorigenesis, we explored the model that disruption in cellular PARylation, driven by LMP1 expression, subsequently promotes epigenetic alterations to elicit changes in host gene expression. PARP1 inhibition resulted in the accumulation of the repressive histone mark H3K27me3 at a subset of LMP1-regulated genes. Inhibition of PARP1, or abrogation of PARP1 expression, also suppressed the expression of LMP1-activated genes and LMP1-mediated cellular transformation, demonstrating an essential role for PARP1 activity in LMP1-induced gene expression and cellular transformation associated with LMP1. In summary, we identified a novel mechanism by which LMP1 drives expression of host tumor-promoting genes by blocking generation of the inhibitory histone modification H3K27me3 through PARP1 activation.
Importance: EBV is causally linked to several malignancies and is responsible for 1% of cancer incidence worldwide. The EBV-encoded protein LMP1 is essential for promoting viral tumorigenesis by aberrant activation of several well-known intracellular signaling pathways. We have identified and defined an additional novel molecular mechanism by which LMP1 regulates the expression of tumor-promoting host genes. We found that LMP1 activates the cellular protein PARP1, leading to a decrease in a repressive histone modification, accompanied by induction in expression of multiple cancer-related genes. PARP1 inhibition or depletion led to a decrease in LMP1-induced cellular transformation. Therefore, targeting PARP1 activity may be an effective treatment for EBV-associated malignancies.
Copyright © 2016, American Society for Microbiology. All Rights Reserved.
Figures


Similar articles
-
Poly(ADP-ribose) polymerase 1 is necessary for coactivating hypoxia-inducible factor-1-dependent gene expression by Epstein-Barr virus latent membrane protein 1.PLoS Pathog. 2018 Nov 5;14(11):e1007394. doi: 10.1371/journal.ppat.1007394. eCollection 2018 Nov. PLoS Pathog. 2018. PMID: 30395643 Free PMC article.
-
PARP1 Stabilizes CTCF Binding and Chromatin Structure To Maintain Epstein-Barr Virus Latency Type.J Virol. 2018 Aug 29;92(18):e00755-18. doi: 10.1128/JVI.00755-18. Print 2018 Sep 15. J Virol. 2018. PMID: 29976663 Free PMC article.
-
c-Myc Represses Transcription of Epstein-Barr Virus Latent Membrane Protein 1 Early after Primary B Cell Infection.J Virol. 2018 Jan 2;92(2):e01178-17. doi: 10.1128/JVI.01178-17. Print 2018 Jan 15. J Virol. 2018. PMID: 29118124 Free PMC article.
-
[Molecular biological properties of the Epstein-Barr virus LMP1 gene: structure, function and polymorphism].Vopr Virusol. 2015;60(3):5-13. Vopr Virusol. 2015. PMID: 26281300 Review. Russian.
-
Regulation and dysregulation of Epstein-Barr virus latency: implications for the development of autoimmune diseases.Autoimmunity. 2008 May;41(4):298-328. doi: 10.1080/08916930802024772. Autoimmunity. 2008. PMID: 18432410 Review.
Cited by
-
Contribution of Epstein⁻Barr Virus Latent Proteins to the Pathogenesis of Classical Hodgkin Lymphoma.Pathogens. 2018 Jun 27;7(3):59. doi: 10.3390/pathogens7030059. Pathogens. 2018. PMID: 29954084 Free PMC article. Review.
-
Herpesvirus Infection of Endothelial Cells as a Systemic Pathological Axis in Myalgic Encephalomyelitis/Chronic Fatigue Syndrome.Viruses. 2024 Apr 8;16(4):572. doi: 10.3390/v16040572. Viruses. 2024. PMID: 38675914 Free PMC article. Review.
-
Epstein-Barr Virus-Encoded Latent Membrane Protein 1 and B-Cell Growth Transformation Induce Lipogenesis through Fatty Acid Synthase.J Virol. 2021 Jan 28;95(4):e01857-20. doi: 10.1128/JVI.01857-20. Print 2021 Jan 28. J Virol. 2021. PMID: 33208446 Free PMC article.
-
Poly(ADP-ribose) polymerase 1 is necessary for coactivating hypoxia-inducible factor-1-dependent gene expression by Epstein-Barr virus latent membrane protein 1.PLoS Pathog. 2018 Nov 5;14(11):e1007394. doi: 10.1371/journal.ppat.1007394. eCollection 2018 Nov. PLoS Pathog. 2018. PMID: 30395643 Free PMC article.
-
New Look of EBV LMP1 Signaling Landscape.Cancers (Basel). 2021 Oct 29;13(21):5451. doi: 10.3390/cancers13215451. Cancers (Basel). 2021. PMID: 34771613 Free PMC article. Review.
References
-
- Arvin A, Campadelli-Fiume G, Mocarski E, Moore PS, Roizman B, Whitley R, Yamanishi K, Young LS, Arrand JR, Murray PG. 2007. EBV gene expression and regulation. Cambridge University Press, Cambridge, United Kingdom. - PubMed
Publication types
MeSH terms
Substances
Grants and funding
LinkOut - more resources
Full Text Sources
Other Literature Sources
Research Materials
Miscellaneous
