. 2016 Sep;67(17):5217-32.
doi: 10.1093/jxb/erw288. Epub 2016 Jul 20.

Functional characterization of the ribosome biogenesis factors PES, BOP1, and WDR12 (PeBoW), and mechanisms of defective cell growth and proliferation caused by PeBoW deficiency in Arabidopsis

Affiliations

Functional characterization of the ribosome biogenesis factors PES, BOP1, and WDR12 (PeBoW), and mechanisms of defective cell growth and proliferation caused by PeBoW deficiency in Arabidopsis

Chang Sook Ahn et al. J Exp Bot. 2016 Sep.

Abstract

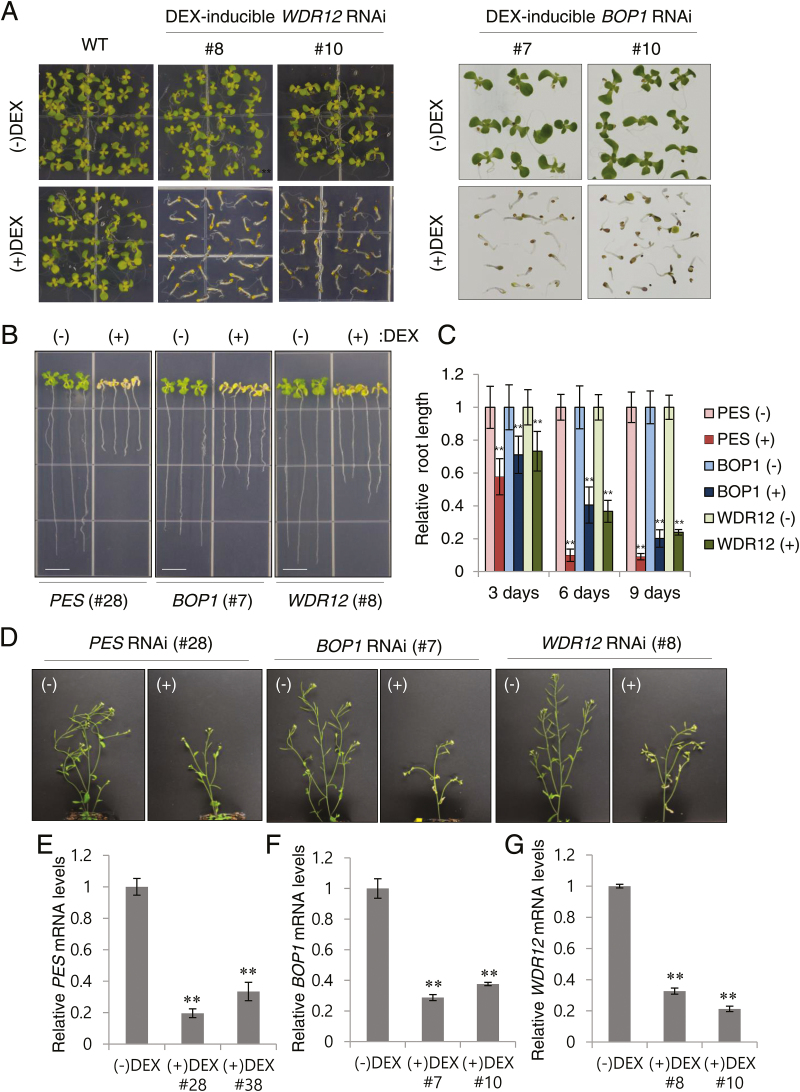
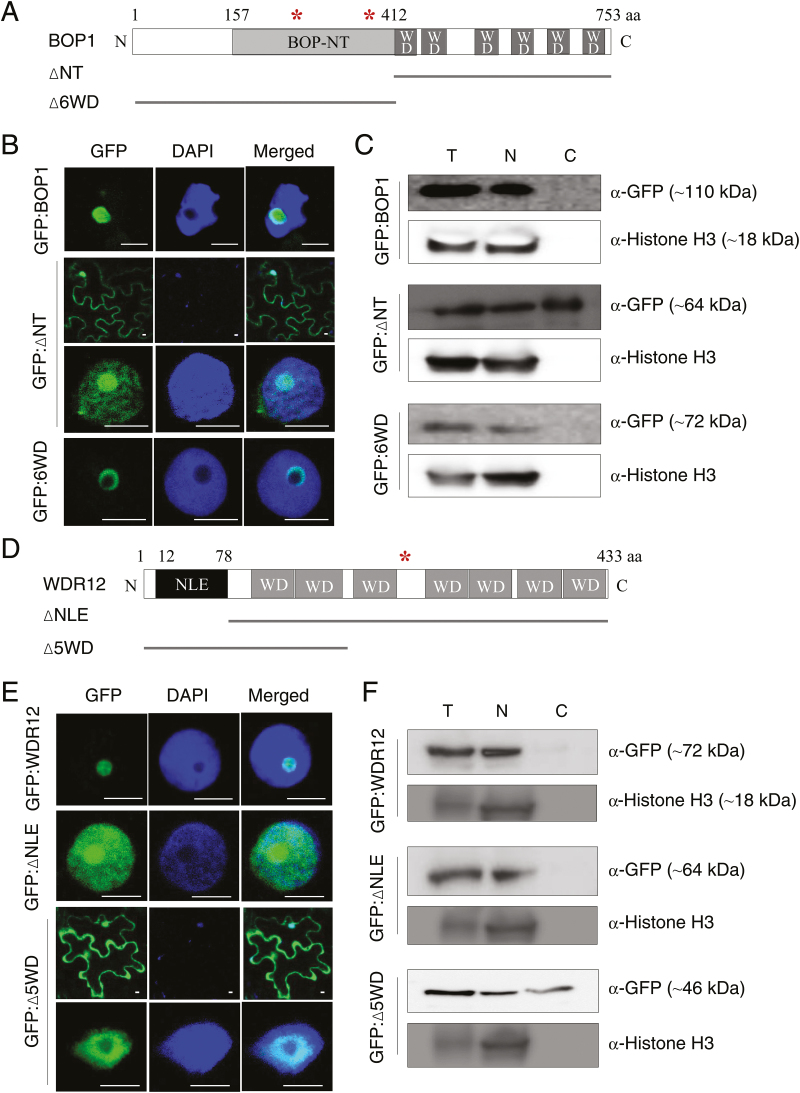
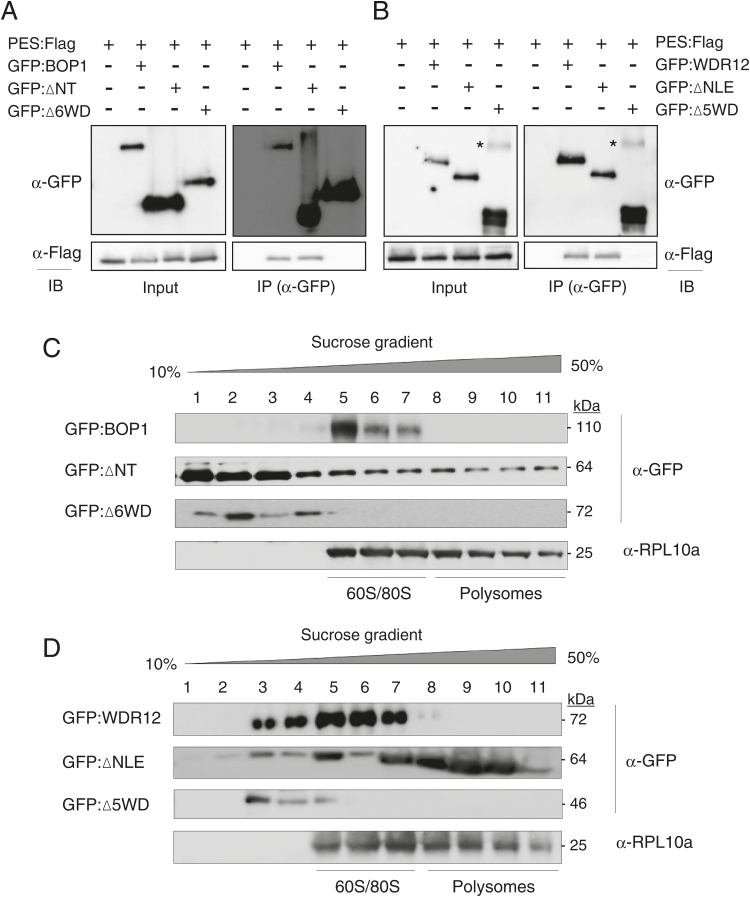
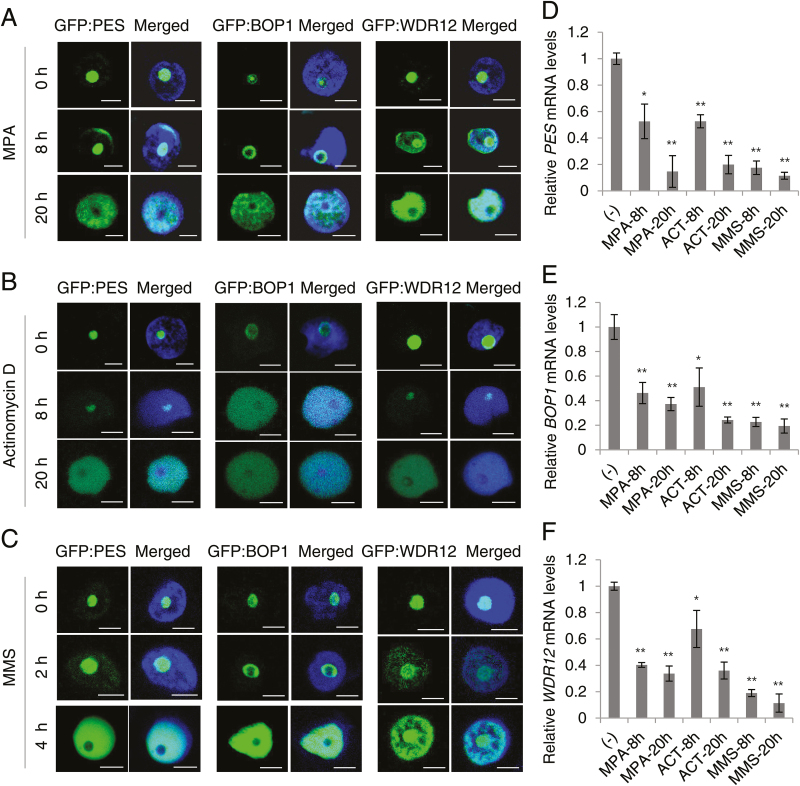
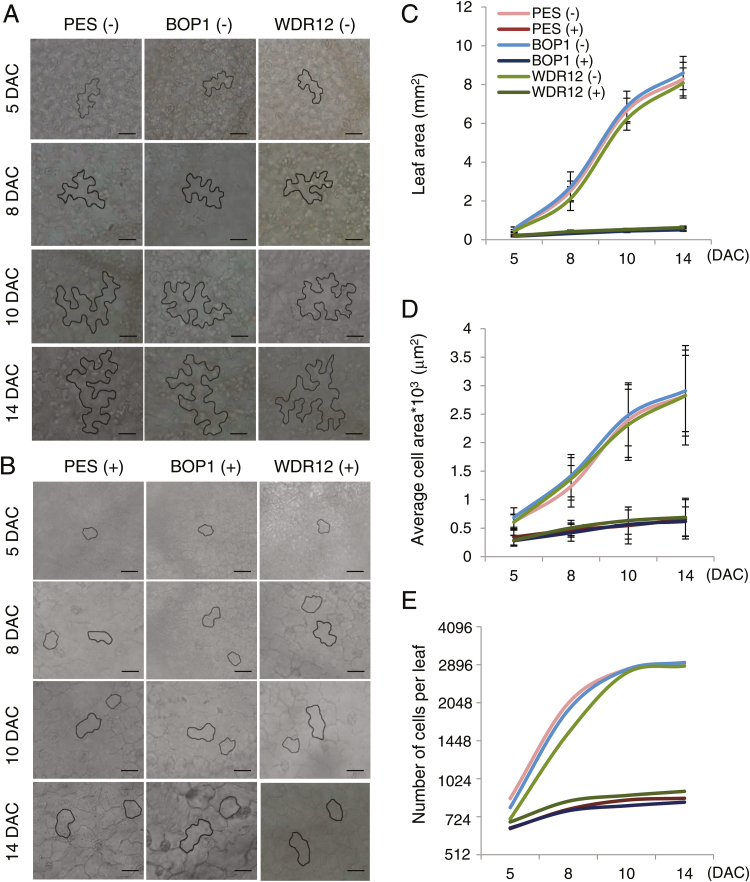
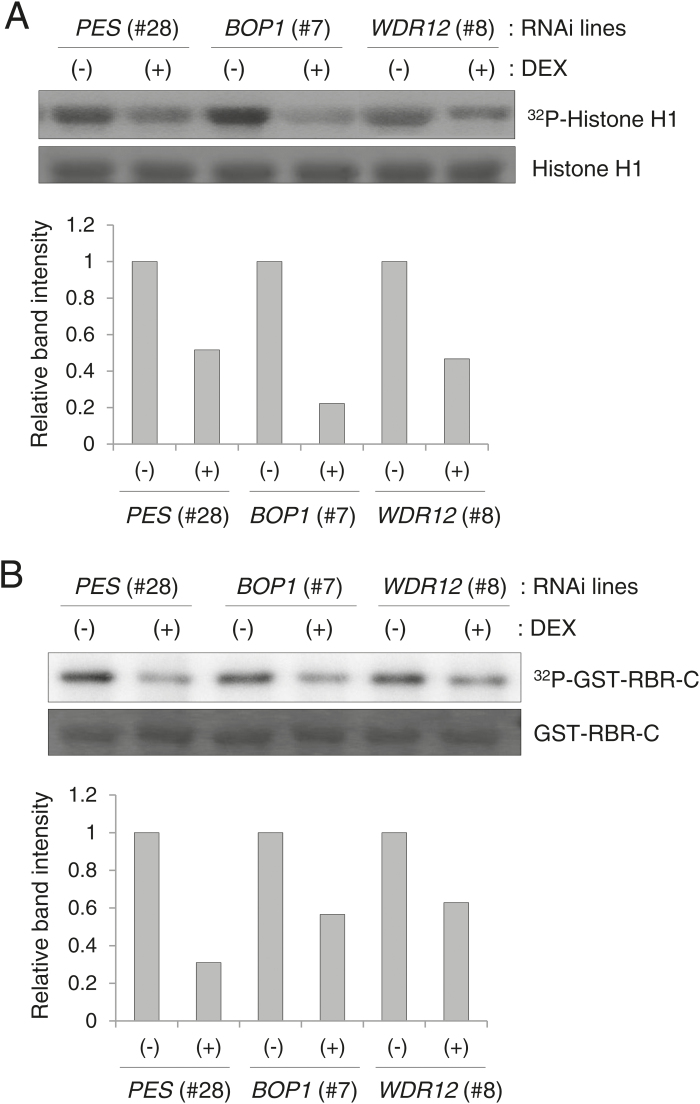
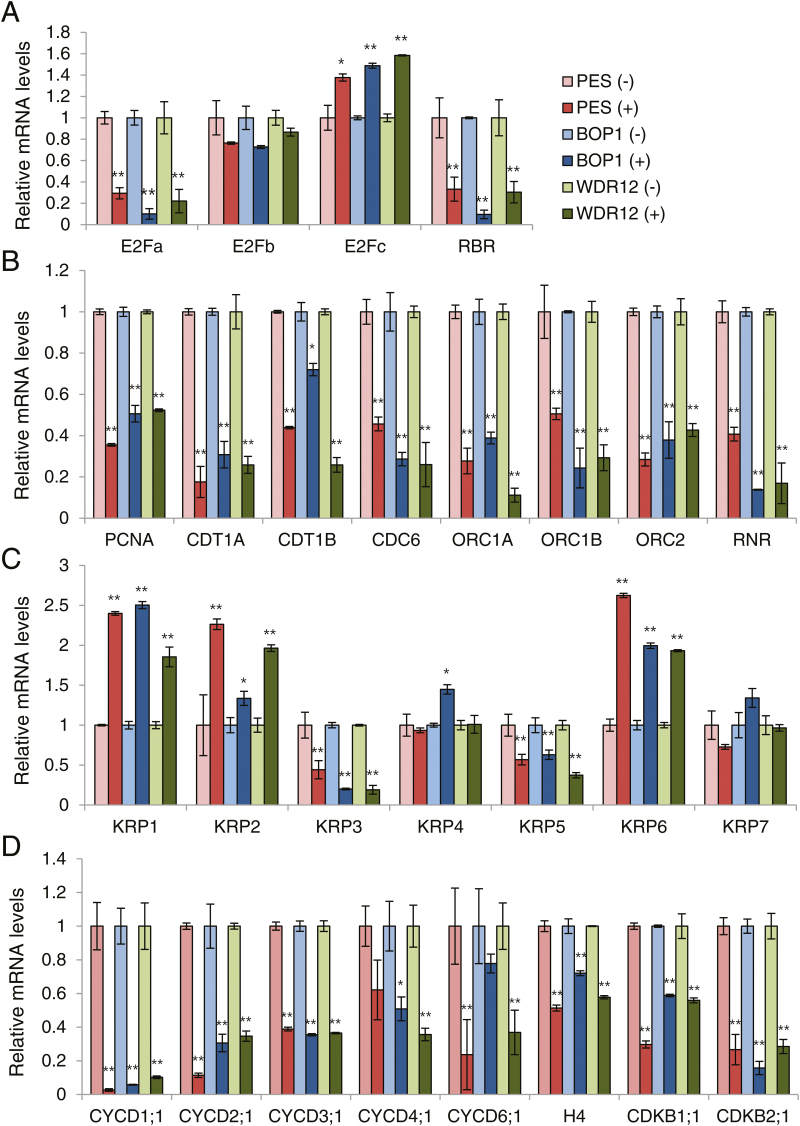
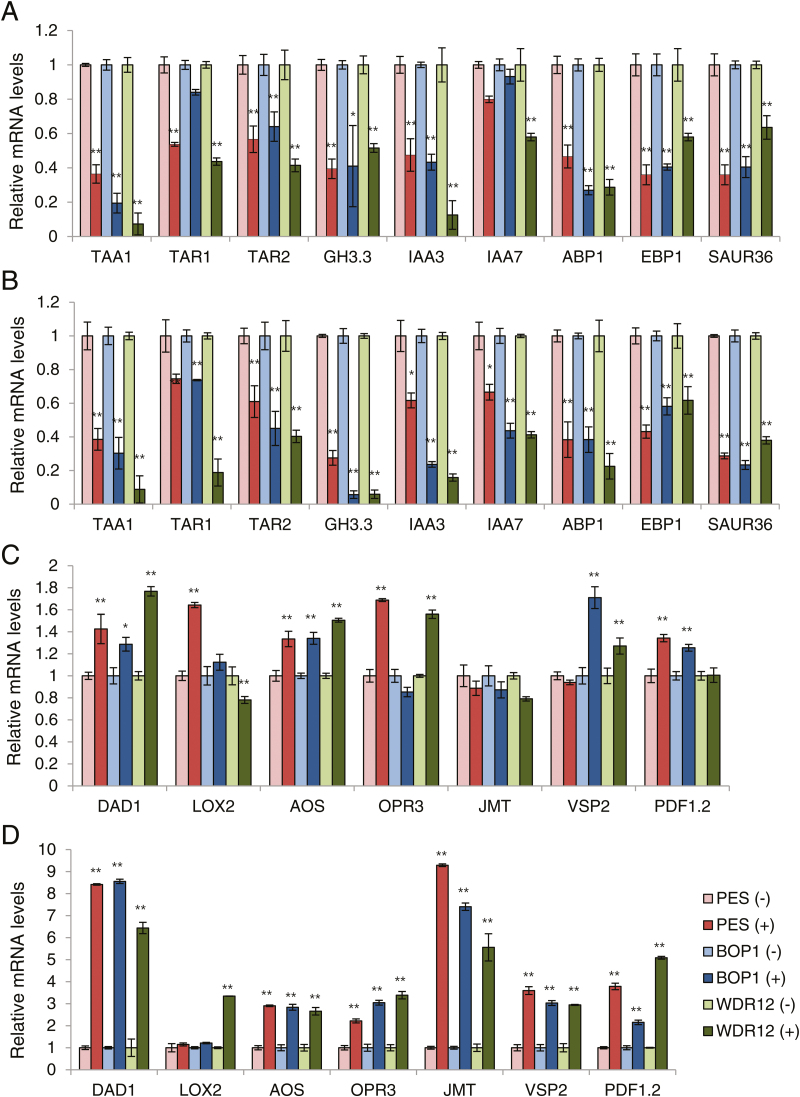
The nucleolar protein pescadillo (PES) controls biogenesis of the 60S ribosomal subunit through functional interactions with Block of Proliferation 1 (BOP1) and WD Repeat Domain 12 (WDR12) in plants. In this study, we determined protein characteristics and in planta functions of BOP1 and WDR12, and characterized defects in plant cell growth and proliferation caused by a deficiency of PeBoW (PES-BOP1-WDR12) proteins. Dexamethasone-inducible RNAi of BOP1 and WDR12 caused developmental arrest and premature senescence in Arabidopsis, similar to the phenotype of PES RNAi. Both the N-terminal domain and WD40 repeats of BOP1 and WDR12 were critical for specific associations with 60S/80S ribosomes. In response to nucleolar stress or DNA damage, PeBoW proteins moved from the nucleolus to the nucleoplasm. Kinematic analyses of leaf growth revealed that depletion of PeBoW proteins led to dramatically suppressed cell proliferation, cell expansion, and epidermal pavement cell differentiation. A deficiency in PeBoW proteins resulted in reduced cyclin-dependent kinase Type A activity, causing reduced phosphorylation of histone H1 and retinoblastoma-related (RBR) protein. PeBoW silencing caused rapid transcriptional modulation of cell-cycle genes, including reduction of E2Fa and Cyclin D family genes, and induction of several KRP genes, accompanied by down-regulation of auxin-related genes and up-regulation of jasmonic acid-related genes. Taken together, these results suggest that the PeBoW proteins involved in ribosome biogenesis play a critical role in plant cell growth and survival, and their depletion leads to inhibition of cell-cycle progression, possibly modulated by phytohormone signaling.

Keywords: Cell cycle genes; growth defects; kinematic analysis; nucleolar stress; phytohormones; ribosome biogenesis..


Figures

Fig. 1.
Fig. 1.
Growth arrest and premature senescence phenotypes of BOP1- and WDR12-silenced plants. (A) Growth arrest phenotype of Arabidopsis dexamethasone (DEX)-inducible BOP1 (#7 and #10) and WDR12 (#8 and #10) RNAi lines. Seedlings were germinated on MS media that contained either ethanol (–DEX) or 10 μM DEX. (B) Retarded root growth and premature senescence of aerial tissues. DEX-inducible PES (#28), BOP1 (#7), and WDR12 (#8) RNAi seedlings were grown on MS media and then transferred to (–)DEX or (+)DEX media for vertical growth. Scale bars are 9mm. (C) Root length measurements in RNAi seedlings 3, 6, and 9 d after transfer to (–)DEX or (+)DEX media. Each data point represents the mean ± SD (n=20). Asterisks denote statistical significance as follows: *, P≤0.05; **, P≤0.01. (D) Premature senescence of the inflorescence in DEX-treated RNAi plants. (E–G) Relative transcript levels in RNAi lines. Real-time quantitative RT-PCR analyses were performed on two independent PES (E), BOP1 (F), and WDR12 (G) RNAi lines. Transcript levels were quantified relative to (–)DEX samples using UBC10 mRNA levels as a control. Each value represents the mean ±SD of three replicates per experiment. (This figure is available in colour at JXB online.)
Fig. 2.
Fig. 2.
Subcellular localization of BOP1, WDR12, and their mutants. (A) Schematic of BOP1 and its deletion mutants (∆NT and ∆6WD). BOP-NT, BOP1 N-terminal domain; WD, WD40 domain. Nuclear localization signals (asterisks) are marked at amino acid residues 253 and 386. aa, amino acids. (B) Subcellular localization of BOP1 and its mutants using GFP fusion. The infiltrated leaves were briefly stained with DAPI to mark nuclei and examined by confocal laser scanning microscopy. Scale bars are 5 µm. (C) Subcellular fractionation. Nicotiana benthamiana leaf extracts expressing GFP fusion proteins of BOP1 and its mutants were fractionated and subjected to immunoblotting with anti-GFP antibodies. Total (T), nuclear (N), and cytosolic (C) fractions are indicated. Histone H3 was detected as a nuclear marker protein. The sizes of the protein bands are indicated. (D) Schematic of WDR12 and its deletion mutants (∆NLE and ∆5WD). NLE, Notchless-like domain; WD, WD40 domain. An asterisk at residue 246 indicates the nuclear localization signal. (E) Subcellular localization of WDR12 and its mutants using GFP fusion. Scale bars are 5 µm. (F) Leaf extracts expressing GFP fusion proteins of WDR12 and its mutants were fractionated and subjected to immunoblotting as described in (C). The sizes of the protein bands are indicated. (This figure is available in colour at JXB online.)
Fig. 3.
Fig. 3.
Protein interactions and co-fractionation with ribosome subunits. (A) Co-immunoprecipitation of BOP1 with PES. Protein extracts were subjected to immunoprecipitation (IP) with anti-GFP antibody, and then co-immunoprecipitated PES:Flag was detected by immunoblotting (IB) with anti-Flag antibody. The asterisks indicate non-specific protein bands. (B) Co-immunoprecipitation of WDR12 with PES. Co-immunoprecipitation was performed as described in (A). (C) Co-fractionation of BOP1 and its mutants with ribosome subunits. After sedimentation of ribosomes through a sucrose density gradient, the fractions were subjected to immunoblotting with anti-GFP and anti-ribosomal protein L10a (RPL10a) antibodies. Lanes 1–11 indicate gradient fractions from top (10%) to bottom (50%). (D) Co-fractionation of WDR12 and its mutants with ribosome subunits. Sucrose density gradient centrifugation and immunoblotting were performed as described in (C).
Fig. 4.
Fig. 4.
Translocation of PeBoW proteins into the nucleoplasm in response to drug treatment. (A) Effects of mycophenolic acid (MPA). Nicotiana benthamiana leaves were agroinfiltrated with GFP fusion constructs and then treated with MPA (20 µM) for 0, 8, and 20h. Merged images with DAPI-stained nuclei are shown. Scale bars are 5 µm. (B) Effects of actinomycin-D (5 µM) after 0, 8, and 20h treatment. (C) Effects of methyl methanesulfonate (MMS; 0.03%) after 0, 2, and 4h treatment. (D–F) Real-time quantitative RT-PCR. Transcript levels of PES (D), BOP1 (E), and WDR12 (F) after drug treatment were compared with those prior to treatment (–). The UBC10 mRNA level was used as a control. (This figure is available in colour at JXB online.)
Fig. 5.
Fig. 5.
Kinematic analysis of leaf growth. PES (#28), BOP1 (#7), and WDR12 (#8) RNAi plants were grown in soil and sprayed with ethanol (–) or 20 µM DEX (+). The first leaves were collected from the plants at 5, 8, 10, and 14 d after cotyledon emergence (DAC). (A, B) Representative abaxial epidermal cells from the leaves of RNAi seedlings sprayed with ethanol (A) or DEX (B). Individual cells are visualized by black outlines using ImageJ. Scale bars are 20 µm. (C) Average leaf area. (D) Average leaf epidermal cell area. (E) Calculated number of epidermal cells per leaf. (This figure is available in colour at JXB online.)
Fig. 6.
Fig. 6.
In vitro phosphorylation of histone H1 and the RBR C-terminus by CDKA. (A) Total CDKPSTAIRE was bound to p13Suc1-conjugated agarose beads, and in vitro kinase assays were performed using histone H1 as a substrate. After SDS-PAGE, the gel was dried and analyzed with a phosphorimager to detect 32P-labeled histone H1, while a duplicate gel was stained with Coomassie blue to show histone H1 proteins loaded in each lane (top). Band intensities of phosphorylated histone H1 in (+)DEX samples are compared with those in (–)DEX samples (bottom). (B) In vitro kinase assays were performed as described in (A) using the GST fusion protein of the C-terminal domain of RBR (GST-RBR-C) as a substrate (top). Relative band intensities of phosphorylated GST-RBR-C are shown (bottom).
Fig. 7.
Fig. 7.
Expression of cell cycle-related genes. Real-time quantitative RT-PCR analyses were performed using the first leaves of the PES (#28), BOP1 (#7), and WDR12 (#8) RNAi seedlings sprayed with ethanol (–) or 20 µM DEX (+). Transcript levels are quantified relative to (–)DEX samples using UBC10 mRNA levels as a control. Data points represent means ±SD of three experiments. Asterisks denote statistical significance of the differences between the (–)DEX and (+)DEX samples: *, P≤0.05; **, P≤0.01. (A) E2F/RBR pathway genes. (B) S-phase genes. (C) KRP family genes. (D) CycD family, histone H4, and CDKB genes. (This figure is available in colour at JXB online.)
Fig. 8.
Fig. 8.
Real-time quantitative RT-PCR analyses to determine transcript levels of auxin- and JA-related genes after 12- and 24-h DEX treatments. The PES (#28), BOP1 (#7), and WDR12 (#8) RNAi seedlings (7 DAS) grown in liquid culture were treated with ethanol (–) or 20 µM DEX (+) for 12h or 24h. The first leaves were collected for the analyses. Transcript levels were quantified relative to (–)DEX samples using UBC10 mRNA levels as a control. Each value represents the mean ±SD of three replicates per experiment. *, P≤0.05; **, P≤0.01. (A) Auxin-related genes after 12-h DEX treatment. (B) Auxin-related genes after 24-h DEX treatment. (C) JA-related genes after 12-h DEX treatment. (D) JA-related genes after 24-h DEX treatment. (This figure is available in colour at JXB online.)

References

    1. Adams CC, Jakovljevic J, Roman J, Harnpicharnchai P, Woolford JL., Jr 2002. Saccharomyces cerevisiae nucleolar protein Nop7p is necessary for biogenesis of 60S ribosomal subunits. RNA 8, 150–165. - PMC - PubMed
    1. Ahn CS, Ahn H-K, Pai H-S. 2015. Overexpression of the PP2A regulatory subunit Tap46 leads to enhanced plant growth through stimulation of the TOR signaling pathway. Journal of Experimental Botany 66, 827–840. - PMC - PubMed
    1. Ahn CS, Han JA, Lee H-S, Lee S, Pai H-S. 2011. The PP2A regulatory subunit Tap46, a component of the TOR signaling pathway, modulates growth and metabolism in plants. The Plant Cell 23, 185–209. - PMC - PubMed
    1. Allende ML, Amsterdam A, Becker T, Kawakami K, Gaiano N, Hopkins N. 1996. Insertional mutagenesis in zebrafish identifies two novel genes, pescadillo and dead eye, essential for embryonic development. Genes & Development 10, 3141–3155. - PubMed
    1. Anastasiou E, Lenhard M. 2007. Growing up to one’s standard. Current Opinion in Plant Biology 10, 63–69. - PubMed

Publication types

MeSH terms