Tumor-Targeted Multimodal Optical Imaging with Versatile Cadmium-Free Quantum Dots
- PMID: 27441036
- PMCID: PMC4948596
- DOI: 10.1002/adfm.201503453
Tumor-Targeted Multimodal Optical Imaging with Versatile Cadmium-Free Quantum Dots
Abstract
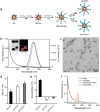
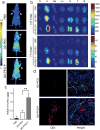
The rapid development of fluorescence imaging technologies requires concurrent improvements in the performance of fluorescent probes. Quantum dots have been extensively used as an imaging probe in various research areas because of their inherent advantages based on unique optical and electronic properties. However, their clinical translation has been limited by the potential toxicity especially from cadmium. Here, a versatile bioimaging probe is developed by using highly luminescent cadmium-free CuInSe2/ZnS core/shell quantum dots conjugated with CGKRK (Cys-Gly-Lys-Arg-Lys) tumor-targeting peptides. This probe exhibits excellent photostability, reasonably long circulation time, minimal toxicity, and strong tumor-specific homing property. The most important feature of this probe is that it shows distinctive versatility in tumor-targeted multimodal imaging including near-infrared, time-gated, and two-photon imaging in different tumor models. In a glioblastoma mouse model, the targeted probe clearly denotes tumor boundaries and positively labels a population of diffusely infiltrating tumor cells, suggesting its utility in precise tumor detection during surgery. This work lays a foundation for potential clinical translation of the probe.
Conflict of interest statement
No potential conflicts of interest were disclosed by the other authors.
Figures


Similar articles
-
Aqueous synthesis of Ag and Mn co-doped In2S3/ZnS quantum dots with tunable emission for dual-modal targeted imaging.Acta Biomater. 2017 Mar 1;50:522-533. doi: 10.1016/j.actbio.2016.12.028. Epub 2016 Dec 18. Acta Biomater. 2017. PMID: 27998812
-
CdSe@ZnS/ZnS quantum dots loaded in polymeric micelles as a pH-triggerable targeting fluorescence imaging probe for detecting cerebral ischemic area.Colloids Surf B Biointerfaces. 2017 Jul 1;155:497-506. doi: 10.1016/j.colsurfb.2017.04.054. Epub 2017 Apr 27. Colloids Surf B Biointerfaces. 2017. PMID: 28475986
-
Colloidal synthesis of tunably luminescent AgInS-based/ZnS core/shell quantum dots as biocompatible nano-probe for high-contrast fluorescence bioimaging.Mater Sci Eng C Mater Biol Appl. 2020 Jun;111:110807. doi: 10.1016/j.msec.2020.110807. Epub 2020 Mar 3. Mater Sci Eng C Mater Biol Appl. 2020. PMID: 32279757
-
Cadmium-containing quantum dots: properties, applications, and toxicity.Appl Microbiol Biotechnol. 2017 Apr;101(7):2713-2733. doi: 10.1007/s00253-017-8140-9. Epub 2017 Mar 1. Appl Microbiol Biotechnol. 2017. PMID: 28251268 Review.
-
Luminescent quantum dots: Synthesis, optical properties, bioimaging and toxicity.Adv Drug Deliv Rev. 2023 Jun;197:114830. doi: 10.1016/j.addr.2023.114830. Epub 2023 Apr 20. Adv Drug Deliv Rev. 2023. PMID: 37086917 Review.
Cited by
-
Multifunctional biomedical imaging in physiological and pathological conditions using a NIR-II probe.Adv Funct Mater. 2017 Jun 20;27(23):1700995. doi: 10.1002/adfm.201700995. Epub 2017 Apr 24. Adv Funct Mater. 2017. PMID: 29623009 Free PMC article.
-
NIR-quantum dots in biomedical imaging and their future.iScience. 2021 Feb 15;24(3):102189. doi: 10.1016/j.isci.2021.102189. eCollection 2021 Mar 19. iScience. 2021. PMID: 33718839 Free PMC article. Review.
-
Insights on prospects of nano-siRNA based approaches in treatment of Cancer.Front Pharmacol. 2022 Aug 25;13:985670. doi: 10.3389/fphar.2022.985670. eCollection 2022. Front Pharmacol. 2022. PMID: 36091772 Free PMC article. Review.
-
Construction of nanomaterials as contrast agents or probes for glioma imaging.J Nanobiotechnology. 2021 May 3;19(1):125. doi: 10.1186/s12951-021-00866-9. J Nanobiotechnology. 2021. PMID: 33941206 Free PMC article. Review.
-
Application of Nanomaterials in Biomedical Imaging and Cancer Therapy.Nanomaterials (Basel). 2020 Aug 29;10(9):1700. doi: 10.3390/nano10091700. Nanomaterials (Basel). 2020. PMID: 32872399 Free PMC article. Review.
References
-
- Larson DR, Zipfel WR, Williams RM, Clark SW, Bruchez MP, Wise FW, Webb WW. Science. 2003;300:1434. - PubMed
Grants and funding
LinkOut - more resources
Full Text Sources
Other Literature Sources
