. 2016 Jul 21;12(7):e1005744.
doi: 10.1371/journal.ppat.1005744. eCollection 2016 Jul.

The Dermis as a Delivery Site of Trypanosoma brucei for Tsetse Flies

Affiliations

The Dermis as a Delivery Site of Trypanosoma brucei for Tsetse Flies

Guy Caljon et al. PLoS Pathog. .

Abstract

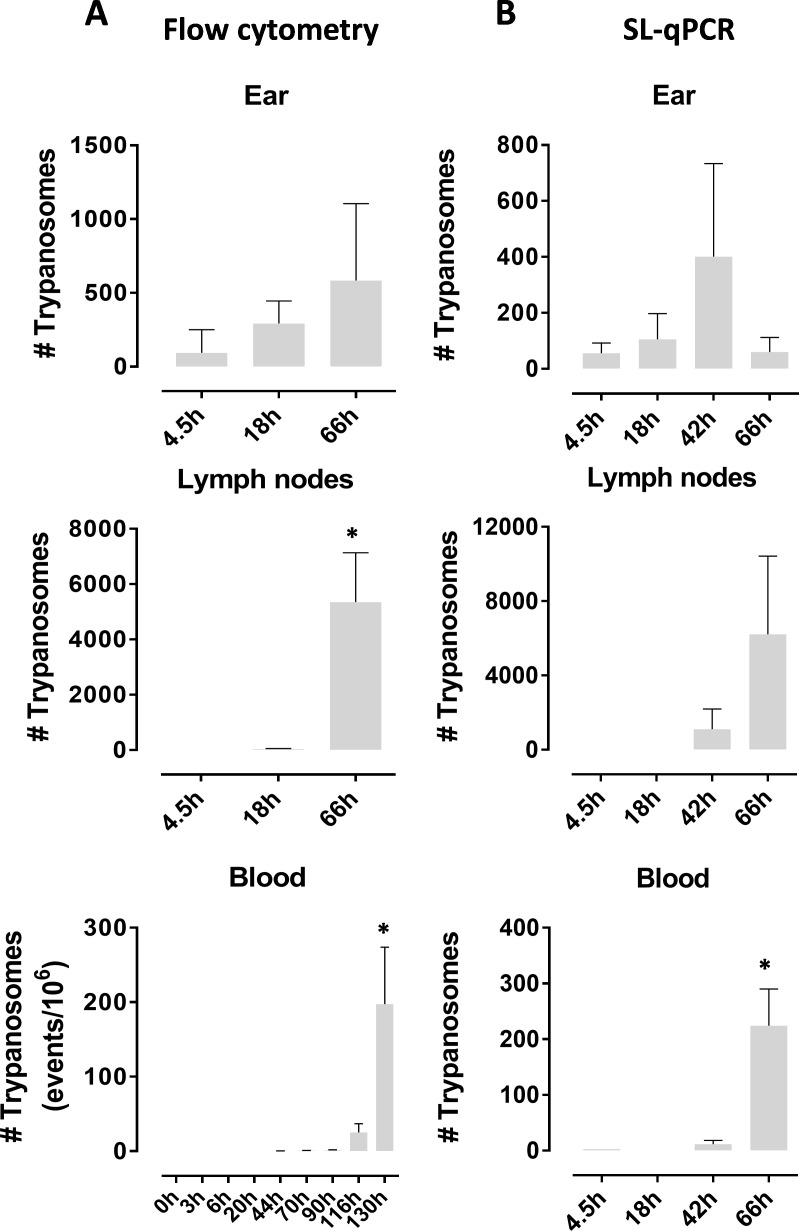
Tsetse flies are the sole vectors of Trypanosoma brucei parasites that cause sleeping sickness. Our knowledge on the early interface between the infective metacyclic forms and the mammalian host skin is currently highly limited. Glossina morsitans flies infected with fluorescently tagged T. brucei parasites were used in this study to initiate natural infections in mice. Metacyclic trypanosomes were found to be highly infectious through the intradermal route in sharp contrast with blood stream form trypanosomes. Parasite emigration from the dermal inoculation site resulted in detectable parasite levels in the draining lymph nodes within 18 hours and in the peripheral blood within 42 h. A subset of parasites remained and actively proliferated in the dermis. By initiating mixed infections with differentially labeled parasites, dermal parasites were unequivocally shown to arise from the initial inoculum and not from a re-invasion from the blood circulation. Scanning electron microscopy demonstrated intricate interactions of these skin-residing parasites with adipocytes in the connective tissue, entanglement by reticular fibers of the periadipocytic baskets and embedment between collagen bundles. Experimental transmission experiments combined with molecular parasite detection in blood fed flies provided evidence that dermal trypanosomes can be acquired from the inoculation site immediately after the initial transmission. High resolution thermographic imaging also revealed that intradermal parasite expansion induces elevated skin surface temperatures. Collectively, the dermis represents a delivery site of the highly infective metacyclic trypanosomes from which the host is systemically colonized and where a proliferative subpopulation remains that is physically constrained by intricate interactions with adipocytes and collagen fibrous structures.


Conflict of interest statement

The authors have declared that no competing interests exist.

Figures

Fig 1
Fig 1. Infection establishment of different T.b.brucei strains in G.m.morsitans tsetse flies.
(A) Tsetse saliva deposits containing metacyclic trypanosomes of the T.b.brucei AnTAR1, AnTat1.1EdsRed or AnTat1.1ETagGFP2 strains. Microphotographs are merged brightfield and fluorescence images of saliva deposited on pre-warmed glass slides by SG+ flies infected with the respective parasite strains. (B) Flow cytometric analysis of salivary gland outflows containing AnTAR1, AnTat1.1EdsRed or AnTat1.1ETagGFP2 metacyclic trypanosomes. Fluorescent populations are indicated in the appropriate gates. Histogram insets illustrate the dsRed and TagGFP2 fluorescence in the AnTat1.1E transgenic metacyclics in comparison with the non-tagged AnTAR1 population (dotted line). (C) Trypanosome numbers in the outflows of non-disrupted salivary gland pairs from individual flies (n = 5 /group) infected with one of the three different parasite strains. These differences in parasite density in the salivary glands between the wildtype and the reporter strains were also clear by microscopical inspection in eight independent experiments for the comparison T.b.brucei AnTAR1 (total n = 1666 flies) vs. AnTat1.1EdsRed (n = 2091) and two independent experiments for the comparison T.b.brucei AnTAR1 (n = 245) vs. AnTat1.1ETagGFP2 (n = 228). Parasite numbers in the salivary glands were analysed by flow cytometry. * P < 0.05
Fig 2
Fig 2. Host tissue colonization by the parasite following a tsetse mediated transmission.
Numbers of parasites in the ears, draining lymph nodes and peripheral blood of mice exposed to SG+ tsetse fly bites as determined by volumetric flow cytometry detecting the dsRed transgene (A) and by SL-RNA specific RT-qPCR (B). Data shown are from three individual mice for each time point. Each ear was exposed to the bites of an individual infected tsetse fly. No statistical significant differences were recorded between the two different quantification methods. These parasite kinetics data are representative of two independent experiments. Data are shown as the mean ± SEM. *: P <0.05
Fig 3
Fig 3. Effect of trypanosome dose on intradermal infection.
(A) Parasitemia development in peripheral blood of mice (n = 5/group) naturally infected by the bites of T.b.brucei AnTAR1 (empty symbols) and T.b.brucei AnTat1.1EdsRed infected tsetse flies (filled symbols) with respectively a high and low number of parasites in the salivary glands. (B) Parasitemia progression in peripheral blood of mice (n = 3/group) intradermally inoculated with varying numbers of metacyclic parasites (200, 50, 20 and 5 MCF) extracted from SG+ G.m.morsitans tsetse flies versus 200 purified bloodstream (BSF) T.b.brucei parasites. These data are representative of 3 independent experiments. Infection rates are recorded following intradermal needle inoculation of varying numbers of (C) washed (round symbols) or DEAE52-purified (red squares) metacyclic (MCF) T.b.brucei parasites isolated from tsetse salivary glands (n = 3 or 6 for each parasite dose and experiment, totaling 48 mice) and (D) DEAE52-purified bloodstream (BSF) T.b.brucei parasites (n = 3 or 6 for each parasite dose and experiment, totaling 42 mice). The parasitological status was checked for 14 days following parasite inoculation. Different symbol colours indicate the 3 independent infection experiments. Different sizes of the symbols are to avoid overlaps. Red squares correspond to the BSF infection rates calculated from the infection experiment that also included the DEAE52-purified MCF parasites as shown in panel C. Data are shown as the mean ± SEM.
Fig 4
Fig 4. Parasite retention and entanglement at the dermal infection initiation site.
Scanning electron microscopy images of 90 hpi dermal ear sections illustrating presence of parasites in the connective tissue close to the cartilage layer of the ear. Subcutaneous adipocytes were readily identified by the smooth external appearance of their cytoplasmic membrane and the characteristic presence of a surrounding collagen network known as basket [34]. Parasites are indicated with white arrows (A). Intricate interactions of trypanosomes with adipocytes in the connective tissue were observed frequently (B-G). Parasites were found with the anterior part buried inside the adipocyte (D-G). Parasites were prominently entangled by reticular fibers (white arrows) of the periadipocytic baskets (E- H) and are embedded in collagen bundles (J-M). Despite these interactions, trypanosomes were proliferating as many cells had multiple flagella (H-J). These observations were made in two independent scanning electron microscopy experiments with a total of eight parasite infected ears at 90 hpi. Sc, stratum corneum; Ep, epidermis; Ad, adipocyte; Ct, connective tissue; Ca, cartilage; Rf, reticular fibers; p, posterior trypanosome end; Cb, collagen bundle.
Fig 5
Fig 5. Parasite persistence and expansion at the dermal site of infection.
(A) Experimental setup using natural infection with two differentially labeled parasite strains (AnTat1.1EdsRed or AnTat1.1ETagGFP2) to determine the origin of the parasites expanding at the dermal inoculation site. Mice were exposed to the bites of infected tsetse flies to introduce AnTat1.1EdsRed parasites in the left ear and AnTat1.1ETagGFP2 at the abdominal side. (B) Flow cytometry profiles at 5 and 7 dpi illustrating the presence of the two parasite strains in the peripheral blood and localized expansion of only the dsRed strain in the ear dermis exposed to the infected tsetse fly bite. Shown data are the CD45- events within the trypanosome gate. Parasite concentrations in the blood and total number of parasites in the tissue extracts are indicated. This experiment was with two mice and one control mouse for each time point with a total of six mice.
Fig 6
Fig 6. Thermographic analysis of the dermal site of parasite expansion.
(A) High resolution thermographic images of 2 representative naive mice and mice at 4, 8 and 11dpi following initiation of a T.b.brucei AnTAR1 infection by an SG+ tsetse fly bite on the left ears (n = 5 for each time point). Right ears were not exposed and served as controls. Images are presented with identical thermal scales. Data are representative of two independent experiments (B) Box plot graph with the measured dorsal temperatures (plotted on left Y-axis) and the temperature differences between exposed and non-exposed ears (plotted on the right Y-axis; n = 5 for each group and time point). (C) Evolution of the density of parasites in the dermis of the ear determined by SL-RNA specific RT-qPCR of the mice used for thermographic imaging (n = 5 for each group and time point). Box plots are with whiskers extending from minimum to maximum. *: P < 0.05, **: P < 0.01; ***: P < 0.001
Fig 7
Fig 7. Parasite acquisition by tsetse flies from the infected dermal site.
(A) Experimental setup indicating the initial infection of mice by exposure of the mouse dorsum to T.b.brucei AnTAR1 SG+ tsetse fly bites, followed 18 hpi by feeding of teneral tsetse flies on the venter or dorsum. (B) Parasites acquired during the blood feeding process were quantified by SL-RNA specific RT-qPCR on individual tsetse fly abdominal extracts (n = 5–10 fully engorged flies fed on an individual side and mouse). Data for the individual mice (M1-6) from two independent experiments with number of parasites acquired from dorsal and ventral sides. (C) Combined data of parasite numbers acquired by individual flies from the ventral (n = 50) and dorsal sides (n = 60). **: P < 0.01; ***: P < 0.001; ****: P < 0.0001

References

    1. Simarro PP, Cecchi G, Franco JR, Paone M, Diarra A, et al. (2015) Monitoring the Progress towards the Elimination of Gambiense Human African Trypanosomiasis. PLoS Negl Trop Dis 9: e0003785 10.1371/journal.pntd.0003785 - DOI - PMC - PubMed
    1. Aksoy S (2011) Sleeping sickness elimination in sight: time to celebrate and reflect, but not relax. PLoS Negl Trop Dis 5: e1008 10.1371/journal.pntd.0001008 - DOI - PMC - PubMed
    1. Chitanga S, Marcotty T, Namangala B, Van den Bossche P, Van Den Abbeele J, et al. (2011) High prevalence of drug resistance in animal trypanosomes without a history of drug exposure. PLoS Negl Trop Dis 5: e1454 10.1371/journal.pntd.0001454 - DOI - PMC - PubMed
    1. Van den Bossche P, Chitanga S, Masumu J, Marcotty T, Delespaux V (2011) Virulence in Trypanosoma congolense Savannah subgroup. A comparison between strains and transmission cycles. Parasite Immunol 33: 456–460. 10.1111/j.1365-3024.2010.01277.x - DOI - PubMed
    1. von Wissmann B, Machila N, Picozzi K, Fevre EM, de CBBM, et al. (2011) Factors associated with acquisition of human infective and animal infective trypanosome infections in domestic livestock in Western Kenya. PLoS Negl Trop Dis 5: e941 10.1371/journal.pntd.0000941 - DOI - PMC - PubMed

Publication types