. 2016 Jul 21;7(7):e2304.
doi: 10.1038/cddis.2016.218.

Proton pump inhibitors protect mice from acute systemic inflammation and induce long-term cross-tolerance

Affiliations

Proton pump inhibitors protect mice from acute systemic inflammation and induce long-term cross-tolerance

E Balza et al. Cell Death Dis. .

Abstract

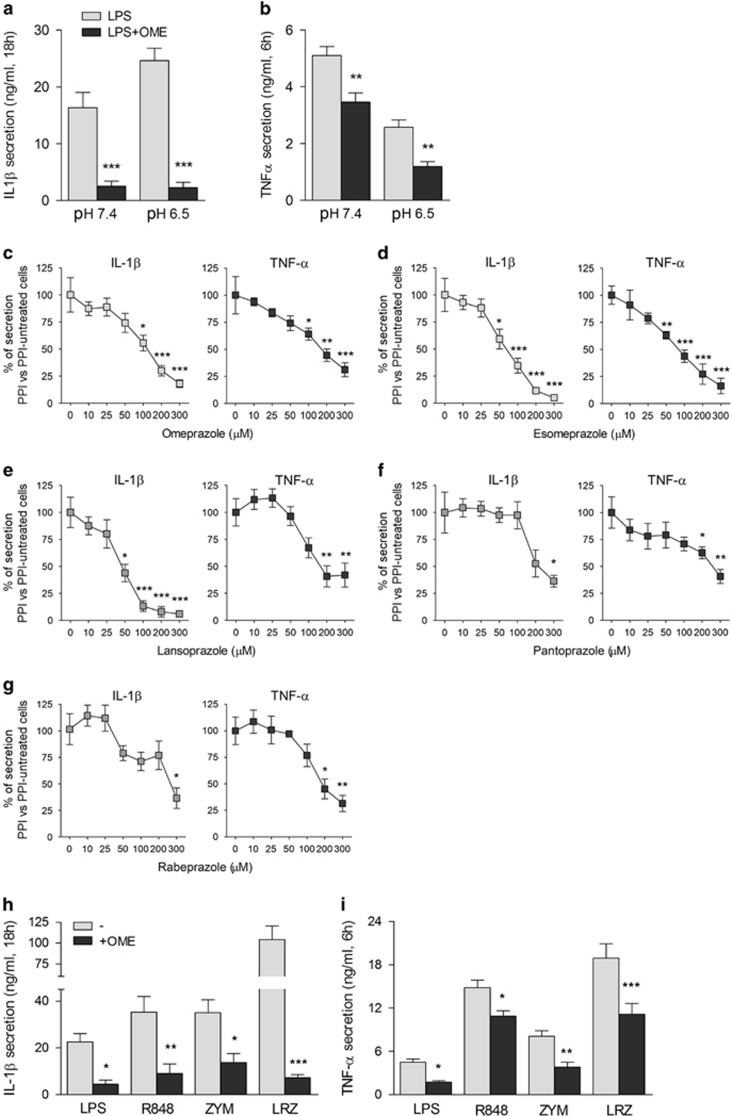
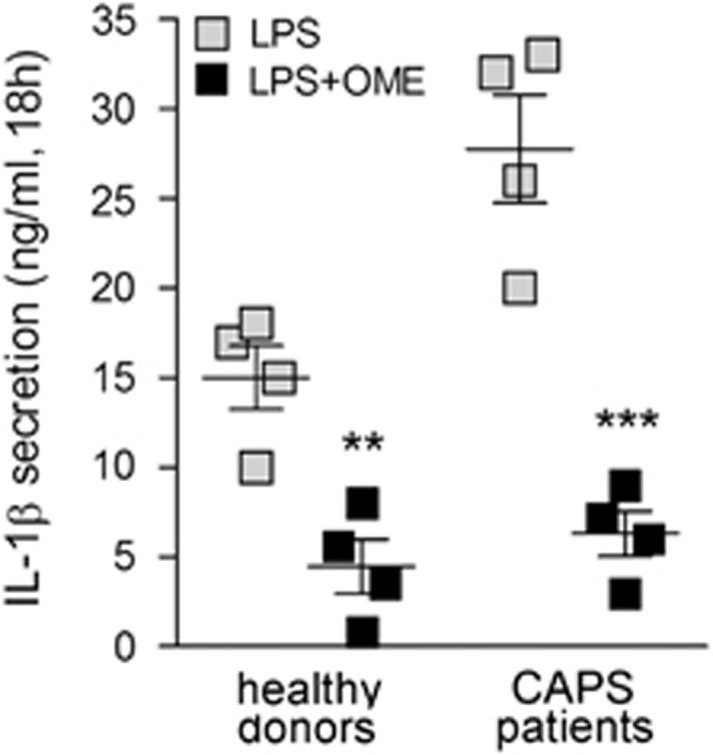
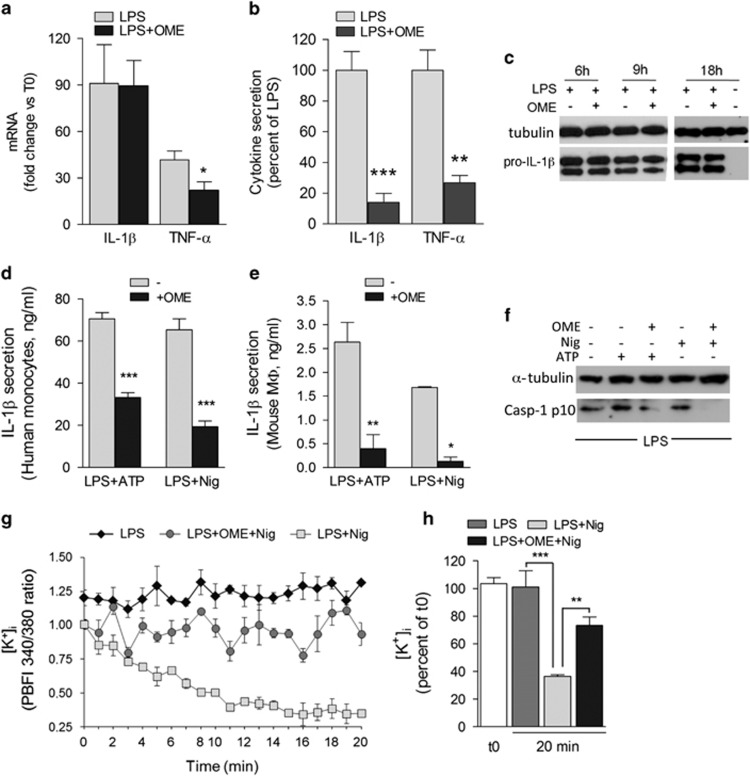
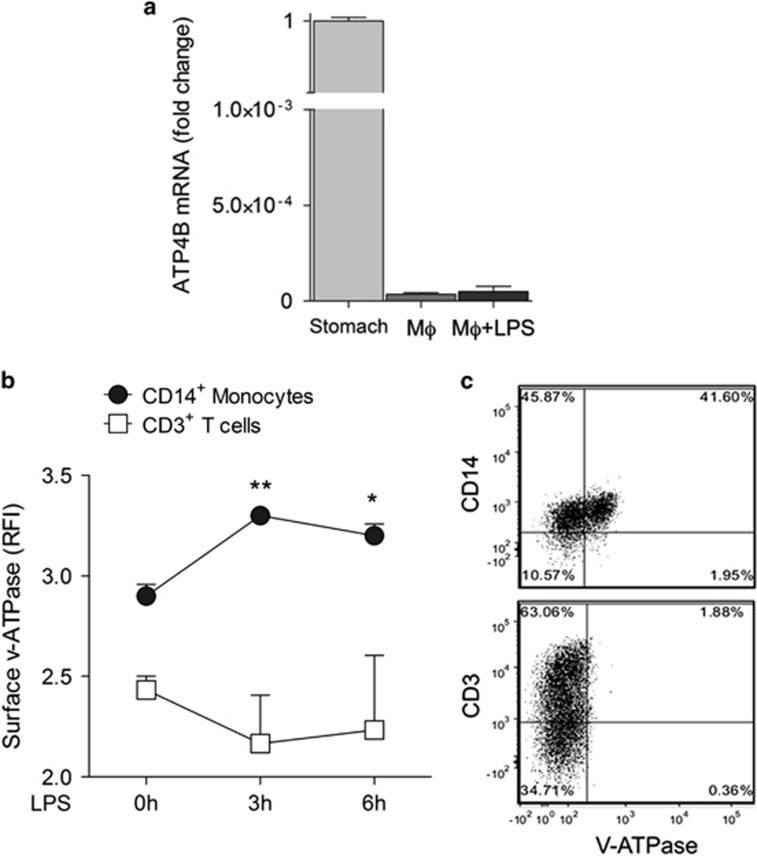
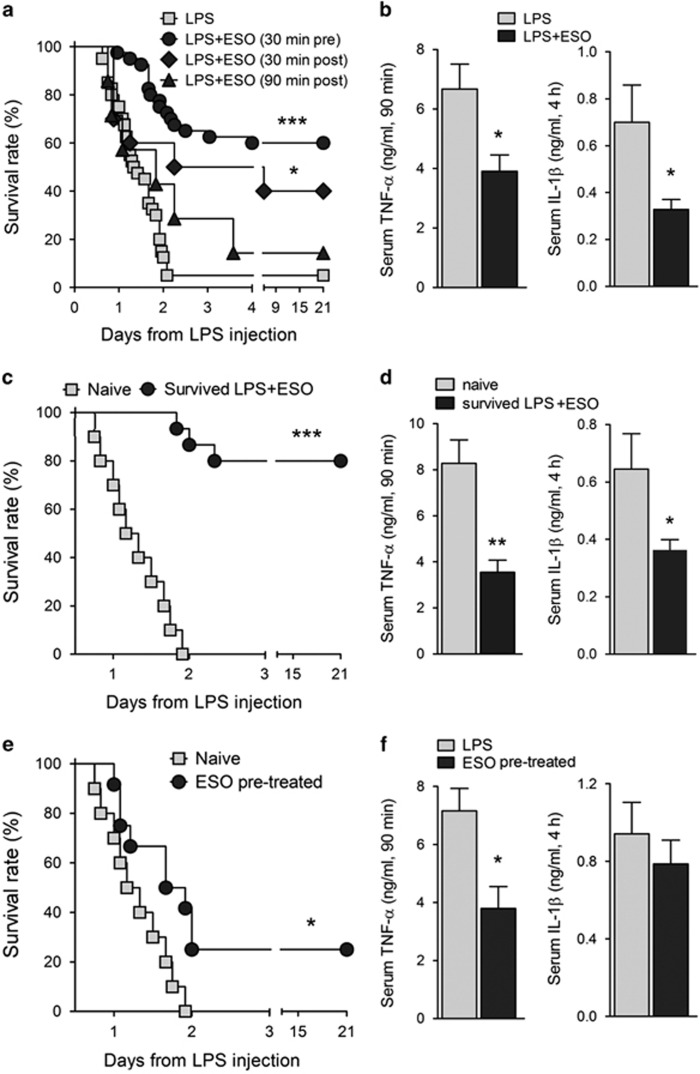
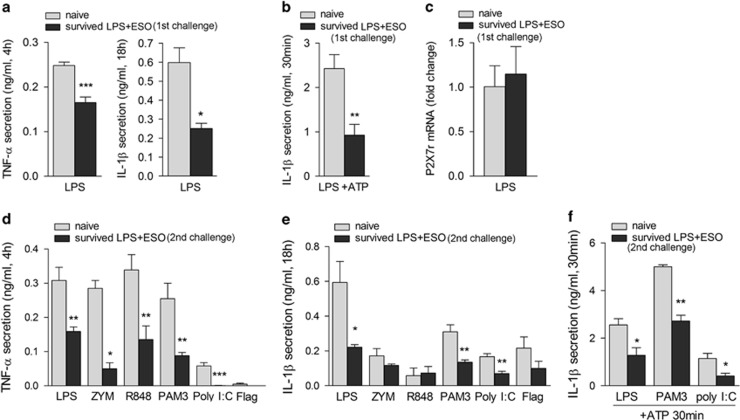
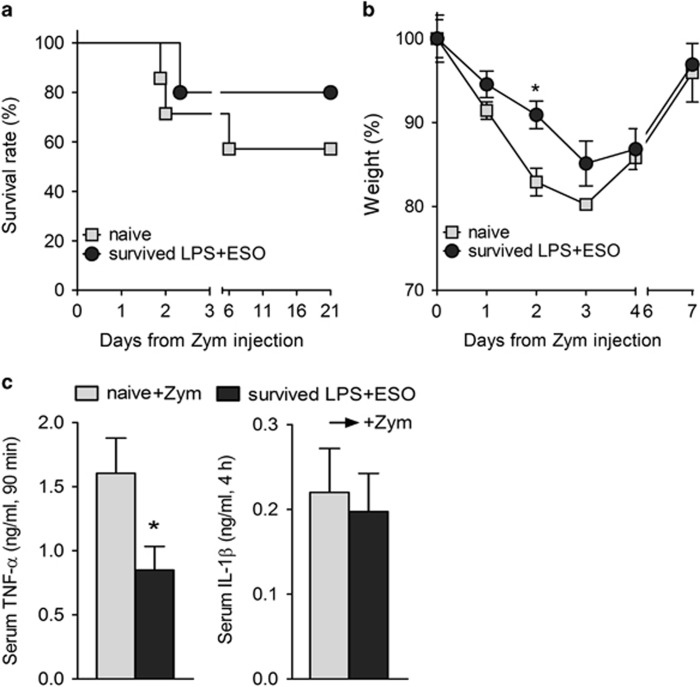
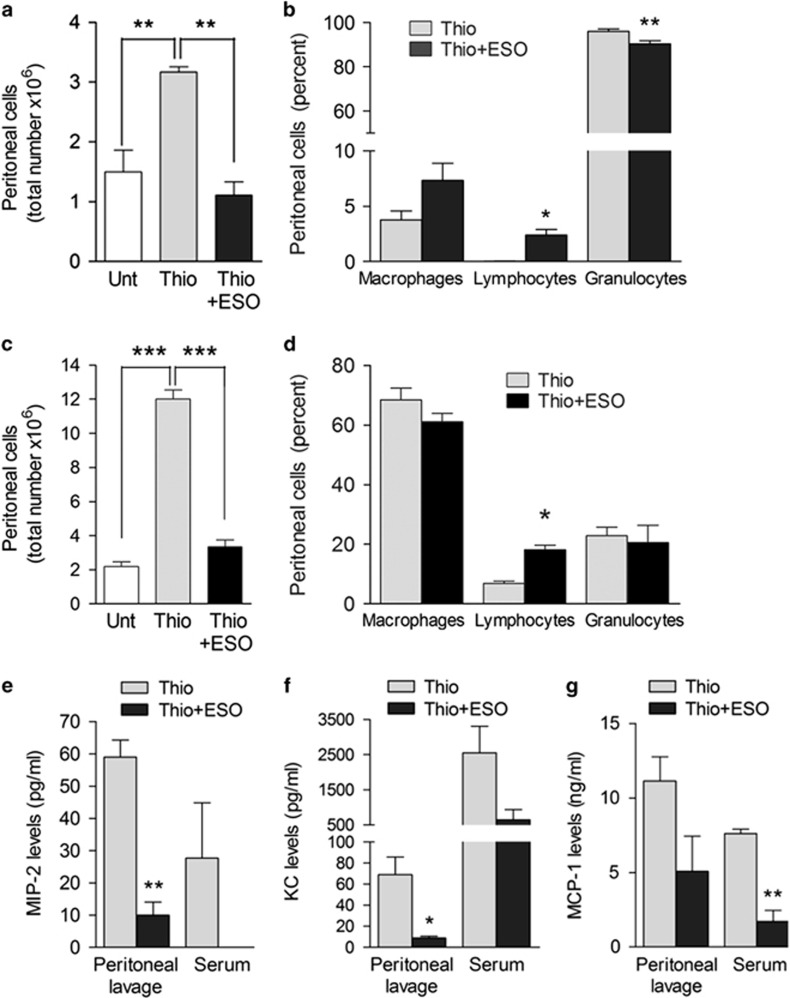
Incidence of sepsis is increasing, representing a tremendous burden for health-care systems. Death in acute sepsis is attributed to hyperinflammatory responses, but the underlying mechanisms are still unclear. We report here that proton pump inhibitors (PPIs), which block gastric acid secretion, selectively inhibited tumor necrosis factor-α (TNF-α) and interleukin-1β (IL-1β) secretion by Toll-like receptor (TLR)-activated human monocytes in vitro, in the absence of toxic effects. Remarkably, the oversecretion of IL-1β that represents a hallmark of monocytes from patients affected by cryopyrin-associated periodic syndrome is also blocked. Based on these propaedeutic experiments, we tested the effects of high doses of PPIs in vivo in the mouse model of endotoxic shock. Our data show that a single administration of PPI protected mice from death (60% survival versus 5% of untreated mice) and decreased TNF-α and IL-1β systemic production. PPIs were efficacious even when administered after lipopolysaccharide (LPS) injection. PPI-treated mice that survived developed a long-term cross-tolerance, becoming resistant to LPS- and zymosan-induced sepsis. In vitro, their macrophages displayed impaired TNF-α and IL-1β to different TLR ligands. PPIs also prevented sodium thioglycollate-induced peritoneal inflammation, indicating their efficacy also in a non-infectious setting independent of TLR stimulation. Lack of toxicity and therapeutic effectiveness make PPIs promising new drugs against sepsis and other severe inflammatory conditions.


Figures

Figure 1
Figure 1
OME inhibits IL-1β and TNF-α secretion induced by different PAMPs in human healthy monocytes. (a and b) Healthy monocytes were incubated in the medium at neutral pH (pH 7.4) or acidic pH (pH 6.5) with LPS (100 ng/ml) in the absence or presence of OME (300 μM). Secreted IL-1β (a) and TNF-α (b) were quantified after 18 and 6 h, respectively. Data are expressed as ng/ml (N=5, mean±S.E.M.). (cg) Dose–response experiments with 10–300 μM of OME (c), ESO (d), lansoprazole (e), pantoprazole (f) and rabeprazole (g) were performed. Supernatants were collected after 18 or 6 h to quantify IL-1β (left panels) and TNF-α (right panels). Data are expressed as the percentage of secretion of PPI versus PPI-untreated cells; mean±S.E.M. of four experiments. (h and i) Monocytes were stimulated for 18 and 6 h with LPS (100 ng/ml), R848 (5 μg/ml) and zymosan (ZYM, 20 μg/ml), alone or in combination (LRZ), in the presence or absence of OME. Secreted IL-1β (h) and TNF-α (i) were quantified as above. Data are expressed as ng/ml (N=5, mean±S.E.M.). *P<0.05; **P<0.01; ***P<0.001
Figure 2
Figure 2
OME prevents secretion by monocytes from patients affected by CAPS. Monocytes from CAPS patients (N=4) and healthy donors (N=4) were stimulated with 100 ng/ml of LPS alone or in combination with OME (300 μM). Secreted IL-1β was quantified by enzyme-linked immunosorbent assay (ELISA) in 18 h supernatants. Data are expressed as ng/ml. **P<0.01; ***P<0.001
Figure 3
Figure 3
OME downmodulates IL-1β and TNF-α secretion with different mechanisms. (a) Real-time PCR of IL-1β and TNF-α mRNA levels, 3 h from exposure to LPS or LPS+OME. Data are expressed as fold change of mRNA levels in cells stimulated with LPS or LPS+OME versus untreated cells (mean of normalized expression±S.E.M.; N=4). (b) IL-1β (18 h) and TNF-α (6 h) secreted by monocytes from the same subjects analyzed in (a). Data are expressed as the percent of secretion by LPS+OME versus LPS (mean±S.E.M.). (c) Western blot analysis of intracellular pro-IL-1β in monocytes unstimulated or at different time points from LPS stimulation, with or without OME. α-Tubulin is used as the loading control. One representative experiment out of five is shown. (d and e) IL-1β secreted by human monocytes (d) or murine peritoneal macrophages (e) primed 3 h (d) or 18 h (e) with LPS and then exposed 30 min to ATP, at 1 mM (d) or 5 mM (e) or to 20 μM nigericin (Nig, 20 min) with or without OME (mean±S.E.M.; N=4). (f) Western blot of p10 caspase-1 in cell lysates from murine macrophages. α-Tubulin is shown as the loading control (one representative experiment out of three). (g) Monocytes stimulated 3 h with LPS were loaded with PBFI and incubated in medium alone (LPS) or with 20 μM nigericin without (LPS+Nig) or with 300 μM OME (LPS+Nig+OME). Data are expressed as 340/380 ratio of the PBFI fluorescence intensity measured every 60 s for 20 min (mean±S.E.M.; N=3). (h) PBFI fluorescence intensity after 20 min in the different culture conditions depicted in (g) is expressed as percent versus time 0. *P<0.05, **P<0.01; ***P<0.001
Figure 4
Figure 4
Macrophages do not express the gastric H+/K+ ATPase, but display surface v-ATPases. (a) Reverse transcription-polymerase chain reaction (RT-PCR) analysis of mRNA coding for the β-subunit of the gastric H+/K+ proton pump on peritoneal mouse macrophages (Mφ) untreated or exposed 3 h to LPS (Mφ+LPS). Data are expressed as fold changes of normalized expression versus murine stomach (mean±S.E.M. of three experiments). (b and c) PBMCs from healthy donors were double stained with anti-v-ATPase and anti-CD14 antibody (Ab) or anti-CD3 Ab time 0 or 3 or 6 h after exposure to LPS and analyzed by FACS. In (b), data are expressed as the relative fluorescence intensity (RFI) of v-ATPase in CD14+ (monocytes) and CD3+ (T-lymphocytes) cells (mean±S.E.M. of three independent experiments). Statistical analysis is referred to monocytes and evaluated versus t0. *P<0.05; **P<0.01 versus (c) a representative experiment of costaining (out of 3) is shown: 41% of CD14+ cells (upper plot) and 1.88% of CD3+ cells are positive for surface v-ATPases at 3 h from LPS exposure. *P<0.05; **P<0.01
Figure 5
Figure 5
ESO protects mice from LPS shock, suppresses the systemic production of TNF-α and IL-1β and induces resistance to LPS rechallenge. (a) Mice were injected intravenously with LPS (12.5 mg/kg) alone (N=40), or received intraperitoneally ESO (12.5 mg/kg) 30 min before (N=40), 30 min after (N=10) or 90 min after (N=7) the LPS injection. Mice were monitored for survival. (b) TNF-α (left panel) and IL-1β (right panel) in sera from LPS- and LPS+ESO-treated mice were quantified (ng/ml) 90 min (TNF-α) or 4 h (IL-1β) after LPS injection, respectively (mean±S.E.M., N=11). (c) Fifteen mice ESO treated and that survived the first LPS shock (survived LPS+ESO) were rechallenged with LPS, without any treatment, 3 weeks after the first LPS injection. As control, 10 naive mice were injected with LPS. Mice were monitored for survival. (d) TNF-α (left) and IL-1β (right) levels (ng/ml) were detected in the serum of naive and rechallenged mice by enzyme-linked immunosorbent assay (ELISA) (mean±S.E.M.; N=8 for TNF-α, N=7 for IL-1β). (e) Twelve mice receive a single injection of ESO 15 days before LPS challenge (ESO pre-treated). A control group of 10 naive mice received LPS only. Mice were monitored for 21 days for survival. (f) Serum levels of TNF-α (left) or IL-1β (right) from ESO pre-treated and naive mice were quantified as above. Data are expressed as ng/ml (mean±S.E.M.; n=6). *P<0.05, **P<0.01 and ***P<0.001
Figure 6
Figure 6
Macrophages from mice survived LPS rechallenge secrete less TNF-α and IL-1β in response to different TLR agonists. (a and b) Peritoneal macrophages from ESO-treated mice survived the first LPS shock (N=4) and from naive mice (N=6) were stimulated with LPS (a) or primed 18 h with LPS and then exposed 30 min to ATP (b), and TNF-α (a) and IL-1β (a and b) were quantified in supernatants after 4 or 18 h. (c) Real-time PCR analysis of P2X7 receptor mRNA from macrophages from naive mice or from mice survived the first LPS shock (survived LPS+ESO) after 3 h exposure to LPS. (d–f) Peritoneal macrophages from ESO-treated mice survived the second LPS shock (N=4) and from naive mice (N=6) were stimulated with LPS, zymosan (ZYM), R848, Pam(3)CSK(4) (PAM3), poly(I:C) and flagellin (Flag) for 4 (d) or 18 h (e) or with LPS, Pam(3)CSK(4) or poly(I:C) for 18 h followed by 30 min with 5 mM ATP (f). Secreted TNF-α (d) and IL-1β (e and f) were quantified (ng/ml; mean±S.E.M.; N=4). *P<0.05; **P<0.01; ***P<0.001
Figure 7
Figure 7
ESO-treated mice that survived LPS shock display resistance to zymosan-induced generalized inflammation. ESO-treated mice that recovered from the first LPS challenge (survived LPS+ESO, N=5) and naive mice (N=7) were injected with zymosan (Zym, 1 g/kg). Mice were monitored for survival (a) and for loss of body weight (b; N=4). (c) Serum levels of TNF-α (left; N=4 naive+Zym and N=5 survived Zym-treated mice) and of IL-1β (right; N=3 naive+Zym and N=4 survived Zym-treated mice) were quantified (ng/ml; mean±S.E.M.). *P<0.05
Figure 8
Figure 8
ESO prevents thioglycollate-induced peritonitis. (a and c) Peritoneal cells isolated 4 h (a) or 72 h (c) from untreated (Unt) mice or from mice injected intraperitoneally with thioglycollate alone (Thio) or thioglycollate 30 min after intraperitoneal injection with ESO (Thio+ESO) were counted. Data are expressed as the total number of infiltrating inflammatory cells (mean±S.E.M.; N=3). (b and d) The relative percent of macrophages, lymphocytes and granulocytes in peritoneum lavage from the same mice was calculated at 4 h (b) and 72 h (d). (e, f and g) MIP-2 (e), KC (f) and MCP-1 (g) levels were determined in serum and peritoneal lavage 4 h after thioglicollate treatment in untreated or ESO-treated mice (pg/ml; N=3, mean±S.E.M.) *P<0.05; **P<0.01; ***P<0.001

References

    1. Hotchkiss RS, Karl IE. The pathophysiology and treatment of sepsis. N Engl J Med 2003; 348: 138–150. - PubMed
    1. Angus DC, van der Poll T. Severe sepsis and septic shock. N Engl J Med 2013; 369: 840–851. - PubMed
    1. Lagu T, Rothberg MB, Shieh MS, Pekow PS, Steingrub JS, Lindenauer PK. Hospitalizations, costs, and outcomes of severe sepsis in the United States 2003 to 2007. Crit Care Med 2007; 40: 754–761. - PubMed
    1. Levy MM, Artigas A, Phillips GS, Rhodes A, Beale R, Osborn T et al. Outcomes of the surviving sepsis campaign in intensive care units in the USA and Europe: a prospective cohort study. Lancet Infect Dis 2012; 12: 919–924. - PubMed
    1. Yende S, Linde-Zwirble W, Mayr F, Weissfeld LA, Reis S, Angus DC. Risk of cardiovascular events in survivors of severe sepsis. Am J Respir Crit Care Med 2014; 189: 1065–1074. - PMC - PubMed

Publication types

MeSH terms