

Hydrological Controls on Ecosystem Dynamics in Lake Fryxell, Antarctica
- PMID: 27441705
- PMCID: PMC4956314
- DOI: 10.1371/journal.pone.0159038
Hydrological Controls on Ecosystem Dynamics in Lake Fryxell, Antarctica
Abstract
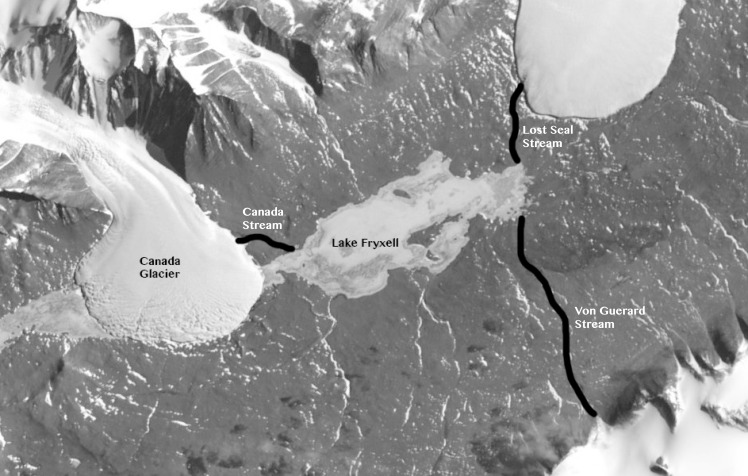
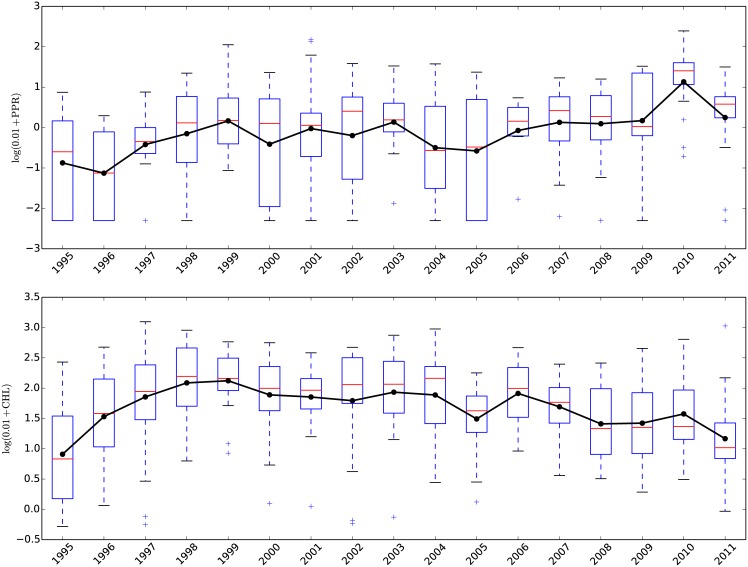
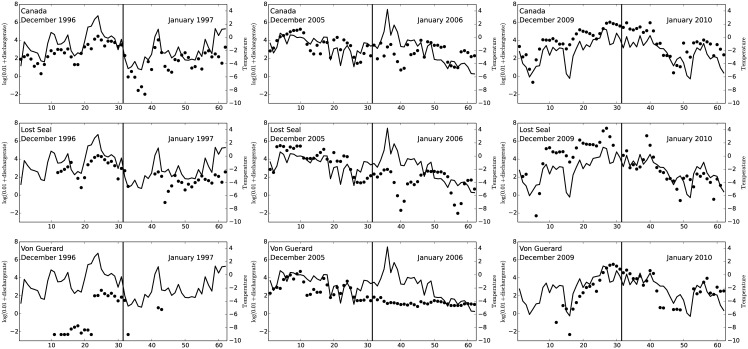
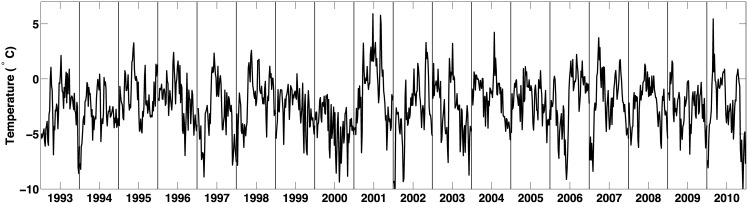
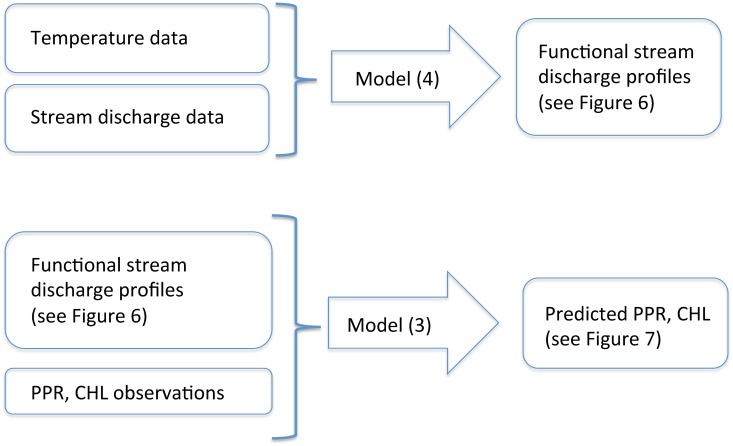
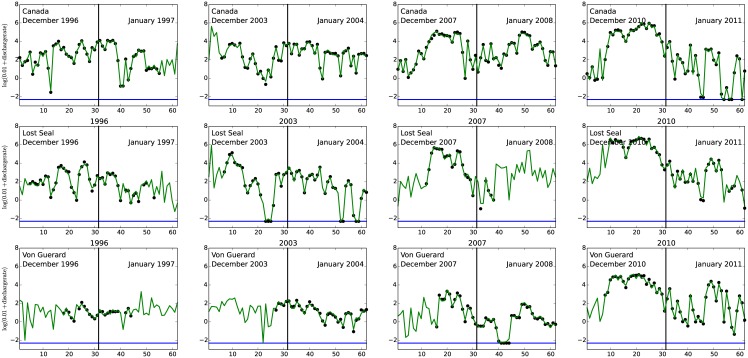
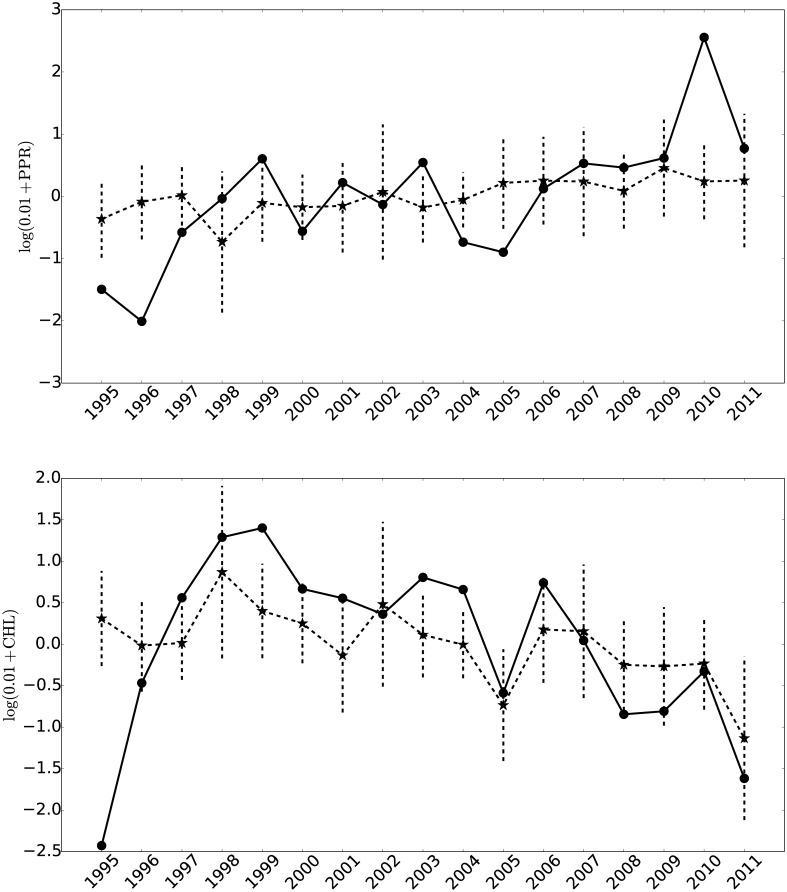
The McMurdo Dry Valleys constitute the largest ice free area of Antarctica. The area is a polar desert with an annual precipitation of ∼ 3 cm water equivalent, but contains several lakes fed by glacial melt water streams that flow from four to twelve weeks of the year. Over the past ∼20 years, data have been collected on the lakes located in Taylor Valley, Antarctica as part of the McMurdo Dry Valley Long-Term Ecological Research program (MCM-LTER). This work aims to understand the impact of climate variations on the biological processes in all the ecosystem types within Taylor Valley, including the lakes. These lakes are stratified, closed-basin systems and are perennially covered with ice. Each lake contains a variety of planktonic and benthic algae that require nutrients for photosynthesis and growth. The work presented here focuses on Lake Fryxell, one of the three main lakes of Taylor Valley; it is fed by thirteen melt-water streams. We use a functional regression approach to link the physical, chemical, and biological processes within the stream-lake system to evaluate the input of water and nutrients on the biological processes in the lakes. The technique has been shown previously to provide important insights into these Antarctic lacustrine systems where data acquisition is not temporally coherent. We use data on primary production (PPR) and chlorophyll-A (CHL)from Lake Fryxell as well as discharge observations from two streams flowing into the lake. Our findings show an association between both PPR, CHL and stream input.
Conflict of interest statement
Figures
References
-
- Herbei R, Lyons WB, Laybourn-Parry J, Gardner C, Priscu JC, McKnight DM. Physiochemical properties influencing biomass abundance and primary production in Lake Hoare, Antarctica. Ecological Modelling. 2010;221(8): 1184–1193. 10.1016/j.ecolmodel.2009.12.015 - DOI
-
- Levy J. How big are the McMurdo Dry Valleys? Estimating ice-free area using Landsat image data. Antarctic Science. 2013;25(01): 119–120. 10.1017/S0954102012000727 - DOI
-
- Doran PT, McKay CP, Clow GD, Dana GL, Fountain AG, Nylen T, et al. Valley floor climate observations from the McMurdo Dry Valleys, Antarctica, 1986–2000. Journal of Geophysical Research: Atmospheres (1984–2012). 2002;107(D24), ACL-13 10.1029/2001JD002045 - DOI
-
- Fountain AG, Nylen TH, Monaghan A, Basagic HJ, Bromwich D. Snow in the McMurdo Dry Valleys, Antarctica. International Journal of Climatology. 2010;30(5): 633–642.
-
- Lyons WB, Tyler SW, Wharton RA, McKnight DM, Vaughn BH. A late Holocene desiccation of Lake Hoare and Lake Fryxell, McMurdo Dry Valleys, Antarctica. Antarctic Science. 1998;10(03): 247–256. 10.1017/S0954102098000340 - DOI
MeSH terms
Substances
LinkOut - more resources
Full Text Sources
Other Literature Sources
Miscellaneous
