

Glucosylsphingosine is a key biomarker of Gaucher disease
- PMID: 27441734
- PMCID: PMC5234703
- DOI: 10.1002/ajh.24491
Glucosylsphingosine is a key biomarker of Gaucher disease
Abstract
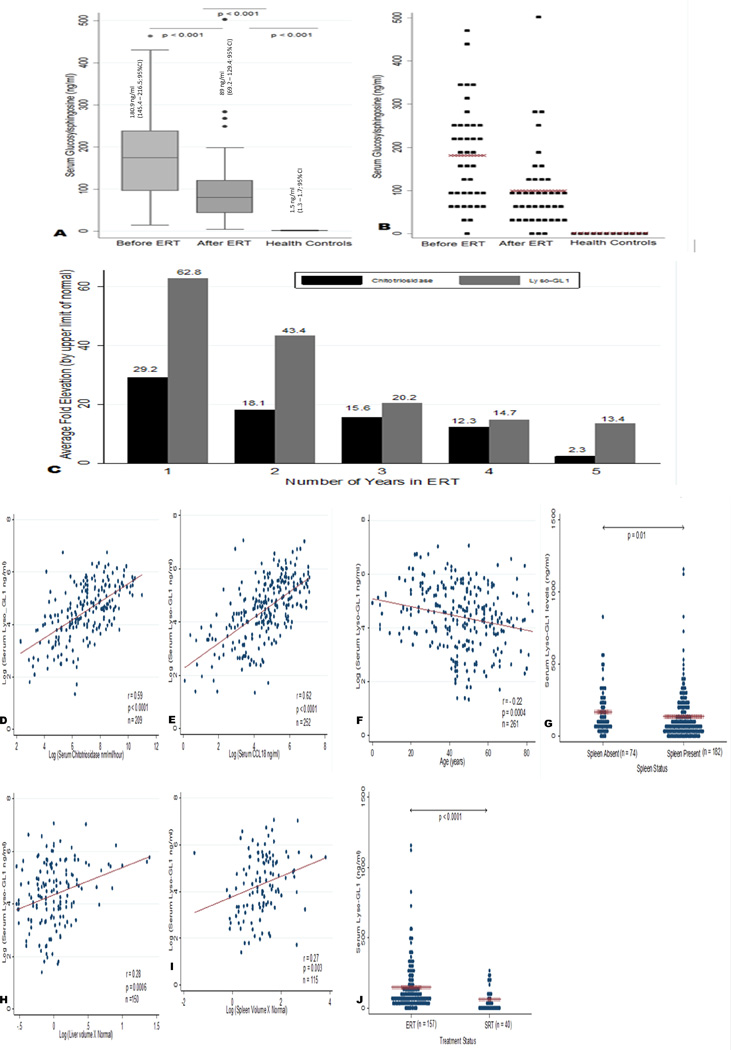
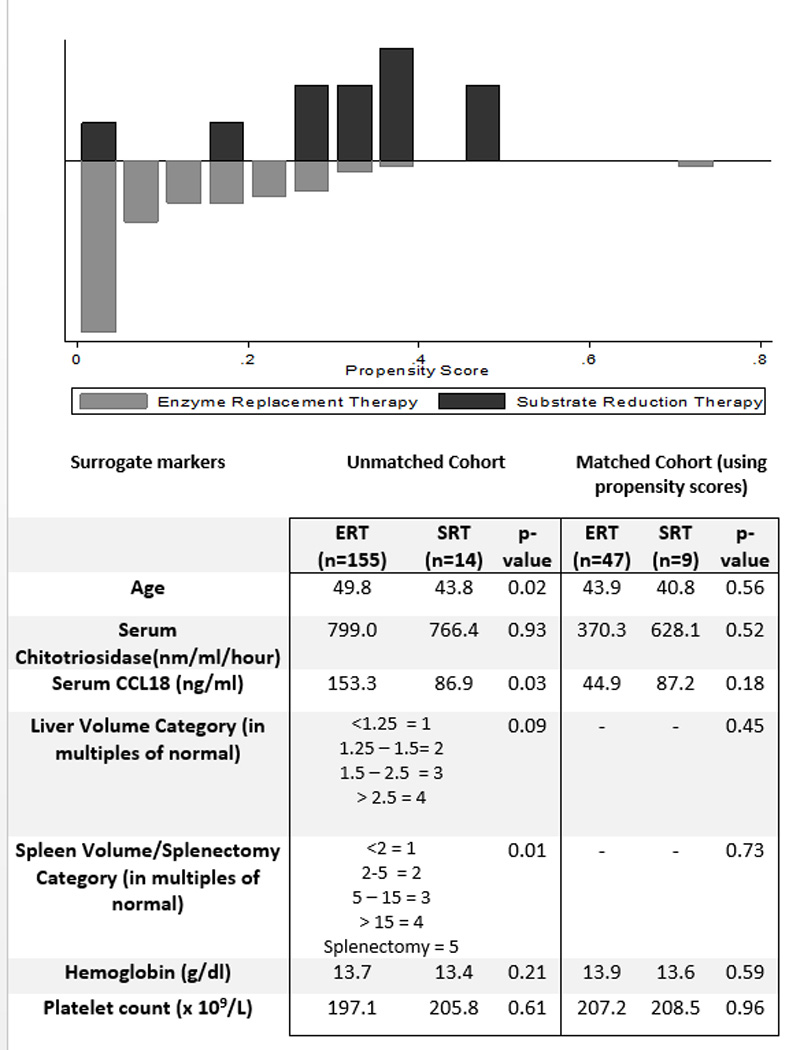
Gaucher disease (GD) involves the accumulation of glucosylceramide (GL1) and its deacylated lysolipid, glucosylsphingosine (lyso-GL1) which is implicated in mediating immune dysregulation and skeletal disease. The aim of our study was to assess plasma Lyso-GL1 as a biomarker of GD and its response to therapy. Plasma lyso-GL1 in 169 patients with GD type 1 (GD1) was measured by LC-MS/MS. Significant predictors of plasma LGL1 were assessed by Pearson's correlation coefficient, Wilcoxon Mann Whitney test and multiple linear regression. Propensity scores were used to match patients on treatment mode: Enzyme Replacement Therapy (ERT) vs. Eliglustat Tartrate SRT (ELI-SRT). Plasma Lyso-GL1 levels in healthy controls averaged 1.5 ng/ml (1.3-1.7; 95% CI). In untreated GD patients, the levels were massively elevated (180.9 ng/ml: 95% CI, 145.4-216.5) and imiglucerase ERT resulted in marked reduction (89 ng/ml: 95% CI, 69.2-129.4) (P < 0.001). Lyso-GL1 correlated with chitotriosidase (r = 0.59 P < 0.001), CCL18 (r = 0.62 P <0.001), hepatomegaly (r = 0.28 P < 0.001), splenomegaly (r = 0.27 P = 0.003), splenectomy (P = 0.01) and treatment mode (P < 0.001). By multiple linear regression, the strongest predictors of lyso-GL1 were age (P < 0.001), splenectomy (P = 0.02), Chitotriosidase (P < 0.001) and CCL18 levels (P = 0.001). After propensity score matching to obtain comparable groups of patients on ERT vs ELI-SRT, lyso-GL1 levels were lower among patients receiving ELI-SRT by 113 ng/ml (95% CI: 136-90.3 ng/ml P < 0.001). Plasma lyso-GL1 is a key biomarker of GD. ERT reduced lyso-GL1 levels. By propensity scoring, ELI-SRT resulted in greater reduction of lyso-GL1 than ERT. Am. J. Hematol. 91:1082-1089, 2016. © 2016 Wiley Periodicals, Inc.
© 2016 Wiley Periodicals, Inc.
Figures
References
-
- Mistry PK, Belmatoug N, vom Dahl S, et al. Understanding the natural history of Gaucher disease. American journal of hematology. 2015;90(Suppl 1):S6–S11. - PubMed
-
- Cox TM, Cachon-Gonzalez MB. The cellular pathology of lysosomal diseases. The Journal of pathology. 2012;226:241–254. - PubMed
-
- Beutler E, Gelbart T, Kuhl W, et al. Mutations in Jewish patients with Gaucher disease. Blood. 1992;79:1662–1666. - PubMed
-
- Beutler E, Gelbart T. Gaucher disease mutations in non-Jewish patients. Br J Haematol. 1993;85:401–405. - PubMed
-
- Grabowski GA. Phenotype, diagnosis, and treatment of Gaucher's disease. Lancet (London, England) 2008;372:1263–1271. - PubMed
MeSH terms
Substances
Grants and funding
LinkOut - more resources
Full Text Sources
Other Literature Sources
Medical