. 2016 Jul 21;12(7):e1006161.
doi: 10.1371/journal.pgen.1006161. eCollection 2016 Jul.

Regulation of Aerobic Energy Metabolism in Podospora anserina by Two Paralogous Genes Encoding Structurally Different c-Subunits of ATP Synthase

Affiliations

Regulation of Aerobic Energy Metabolism in Podospora anserina by Two Paralogous Genes Encoding Structurally Different c-Subunits of ATP Synthase

Carole H Sellem et al. PLoS Genet. .

Abstract

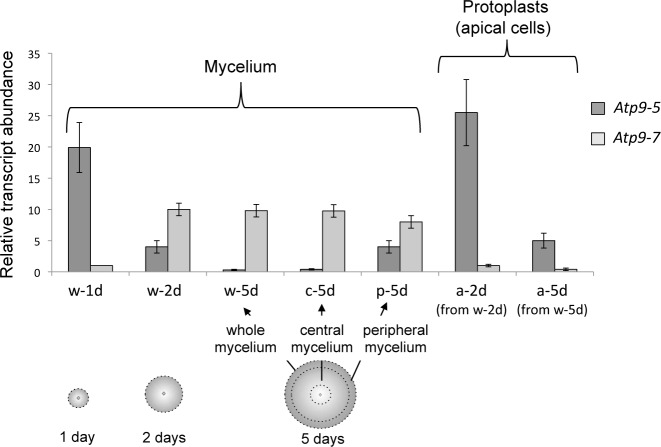
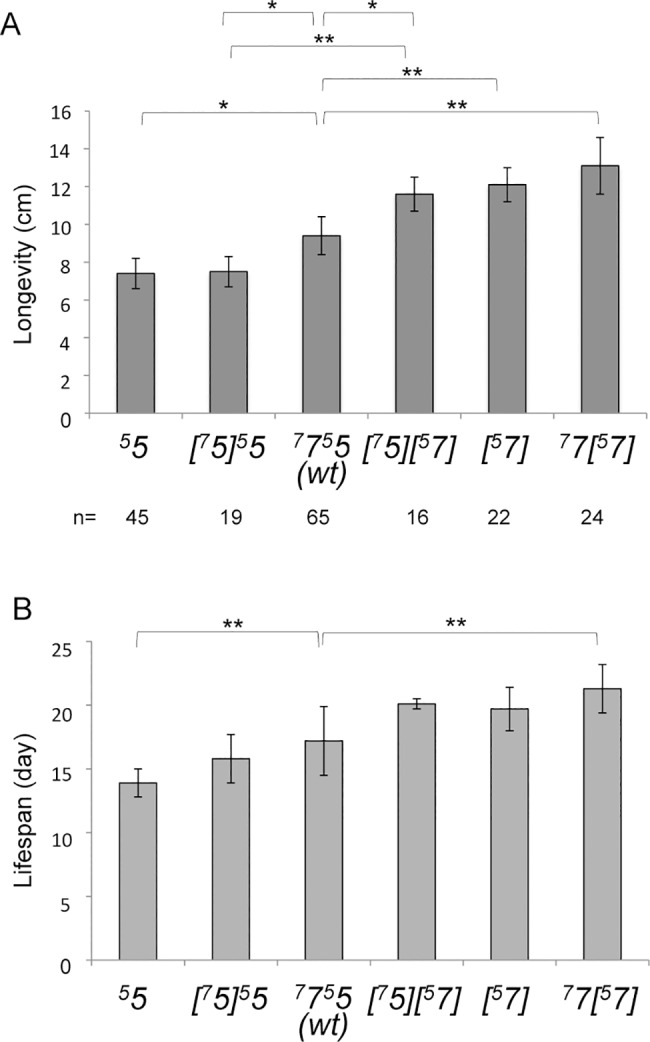
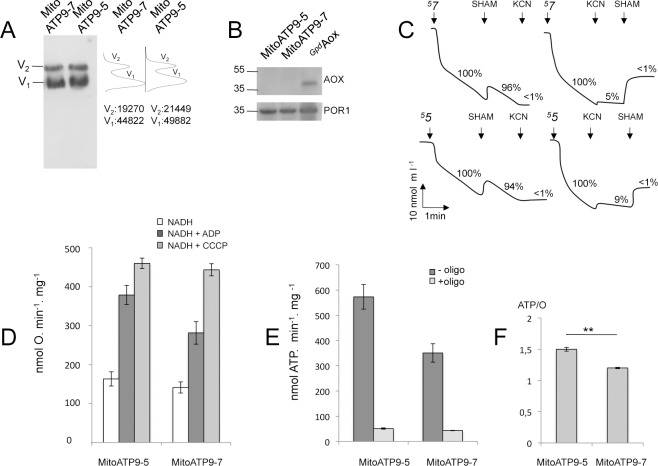
Most of the ATP in living cells is produced by an F-type ATP synthase. This enzyme uses the energy of a transmembrane electrochemical proton gradient to synthesize ATP from ADP and inorganic phosphate. Proton movements across the membrane domain (FO) of the ATP synthase drive the rotation of a ring of 8-15 c-subunits, which induces conformational changes in the catalytic part (F1) of the enzyme that ultimately promote ATP synthesis. Two paralogous nuclear genes, called Atp9-5 and Atp9-7, encode structurally different c-subunits in the filamentous fungus Podospora anserina. We have in this study identified differences in the expression pattern for the two genes that correlate with the mitotic activity of cells in vegetative mycelia: Atp9-7 is transcriptionally active in non-proliferating (stationary) cells while Atp9-5 is expressed in the cells at the extremity (apex) of filaments that divide and are responsible for mycelium growth. When active, the Atp9-5 gene sustains a much higher rate of c-subunit synthesis than Atp9-7. We further show that the ATP9-7 and ATP9-5 proteins have antagonist effects on the longevity of P. anserina. Finally, we provide evidence that the ATP9-5 protein sustains a higher rate of mitochondrial ATP synthesis and yield in ATP molecules per electron transferred to oxygen than the c-subunit encoded by Atp9-7. These findings reveal that the c-subunit genes play a key role in the modulation of ATP synthase production and activity along the life cycle of P. anserina. Such a degree of sophistication for regulating aerobic energy metabolism has not been described before.


Conflict of interest statement

The authors have declared that no competing interests exist.

Figures

Fig 1
Fig 1. Transcription profiling of Atp9-7 and Atp9-5 in vegetative cultures of P. anserina.
The relative abundance of Atp9-5 and Atp9-7 mRNA transcripts in vegetative cultures of P. anserina, versus a constitutively expressed gene (Gpd), was determined by real-time quantitative reverse transcription PCR. The analyzed RNA extracts were prepared from: (i) whole cultures grown on solid medium for 1 (w-1d), 2 (w-2d) and 5 (w-5d) days; (ii) the central (c-5d) and peripheral (p-5d) regions of w-5d mycelium as delineated by dotted lines; and (iii) protoplasts (apical cells) obtained from 2 (a-2d) and 5 days (a-5d) aged liquid cultures. The results are presented as histograms with an arbitrary value of 1 for Atp9-7 transcripts in w-1d. The error bars indicate standard error (SEM) in at least three independent experiments.
Fig 2
Fig 2. Expression of inhibitor-resistance genes from the Atp9-7 and Atp9-5 regulatory sequences.
(A) Expression of nat1, a nourseothricin-resistance conferring gene. The wild type of P. anserina (WT) does not contain any nat1 transgene gene and consequently fails to grow in the presence of nourseothricin (M2 plates supplemented with 50 μg/ml of the drug) owing to a block in protein synthesis. Strain 5nat harbors a nat1 gene under control of the 5’ and 3’ cis-regulatory sequences of Atp9-5. In strain 7nat, the nourseothricin-resistance gene is controlled by the regulatory sequences of Atp9-7. The control inhibitor-resistant strain (GpdnatAS1) carries a nat1 transgene with the 5’ flanking sequence from Gpd and the 3’ flanking sequence from AS1, both of which conferred a high level of constitutive expression [12]. The plates were photographed after 4 days of incubation. (B) Expression of oligomycin-resistance alleles in Atp9-5 (F124S) and Atp9-7 (F135Y). In the short-hand nomenclature used to distinguish the various strains, the numbers 5 and 7 in regular point size indicate the Atp9-5 and Atp9-7 alleles, respectively, while the origin of regulatory sequences upstream and downstream the Atp9 reading frame is indicated with a superscript number (similar to that described in panel A with the nat1 gene); the subscript “OR” denotes a mutant allele that confers oligomycin-resistance; and ectopic genes are surrounded by brackets. Resistance to oligomycin was tested on M2 plates supplemented with 0.5 μg/ml of the drug. The plates were photographed after 5 days of incubation.
Fig 3
Fig 3. The ATP9-5 and ATP9-7 proteins have antagonist effects on the longevity of P. anserina.
This figure reports the life span values for strains in which the expression of Atp9-5 and/or Atp9-7 is regulated differently than in wild type, as evaluated by the linear length (in cm) the mycelium reaches before dying (Panel A), or by the estimation of the half-life (in days), which is the number of days by which 50% of the cultures were still alive (panel B) (see S3 Table for details). The reported values and standard deviations were established by testing at least 32 cultures for each genotype obtained from several independent crosses (S3 Table). Statistically significant changes in longevity between strains, according to t-student and log rank tests are indicated by the bars and stars (* corresponds to a P-value <95%, ** to a P-value <0.01). The short-hand nomenclature of the analyzed strains is explained in the legend of Fig 2 (see S1 Table for complete genotypes).
Fig 4
Fig 4. The ATP9-5 and ATP9-7 proteins confer different properties to the F-ATP synthase in P. anserina.
All of these experiments were performed using mitochondria isolated from the apical cells of strains [57] and 55, which express either Atp9-5 or Atp9-7 both from the regulatory sequences of Atp9-5, except in panel (C) where protoplasts prepared from these strains were used. For simplicity, the mitochondrial samples are referred to as MitoATP9-5 and MitoATP9-7, whereas the protoplasts are named ProtoATP9-5 and ProtoATP9-7, respectively, to denote which c-subunit isomer was produced in the cells of origin. (A) BN-PAGE analysis of ATP synthase. On the left: Mitochondrial proteins were extracted with 2% digitonin, separated by BN-PAGE (50 μg per lane) and transferred to nitrocellulose membranes for Western blotting with antibodies against the yeast α-F1 protein. In the conditions used, ATP synthase was detected as dimeric (V2) and monomeric (V1) units. On the right: Quantification of the immunological signals (see Materials and Methods). The values correspond to the surface areas below the V2 and V1 peaks. The two protein samples loaded on the BN-gel contained similar amounts of porin, as shown in panel B. A second, independent, BN-PAGE analysis is shown in S4 Fig (B) Steady state levels of porin and AOX. 50 μg of proteins from MitoATP9-5 and MitoATP9-5 were separated via SDS-PAGE, transferred to a nitrocellulose membrane and probed with antibodies against porin and AOX. GpdAox mitochondria were isolated from a strain that constitutively expresses AOX [35]. C. Sensitivity of oxygen uptake to SHAM. 2x10⁸ protoplasts prepared from strains [57] (ProtoATP9-7) and 55 (ProtoATP9-5) were pre-incubated for 30 min in the respiration buffer and their oxygen consumption activities were then measured using a Clark electrode. SHAM and KCN inhibitors were used at 1mM. The respiration value in the absence of inhibitor is set-up as 100%. The residual respirations after adding the adding the inhibitors are indicated. (D) Oxygen uptake by MitoATP9-5 and MitoATP9-7. Measurements with a Clark electrode were made with mitochondria at a protein concentration of 0.15 mg/ml, in the presence of NADH alone (basal respiration), and after subsequent additions of 150 μM ADP (state 3) or 4 μM CCCP (uncoupled respiration). (E) ATP synthesis. This activity was evaluated in the conditions used to measure state 3 respiration except that 1 mM instead of 150 μM ADP was added to the mitochondrial samples. (F) The histogram reports the ATP/O values calculated for MitoATP9-5 and MitoATP9-7, which is the number of ATP molecules produced per pair of electrons transferred to oxygen (see S4 Table for details; ** is for p<0.01%). The data reported in panels C, D and E are the mean values ± standard deviation obtained in at least three independent experiments (see S4 Table for details).

Similar articles

Cited by

References

    1. Symersky J, Pagadala V, Osowski D, Krah A, Meier T, et al. (2012) Structure of the c(10) ring of the yeast mitochondrial ATP synthase in the open conformation. Nat Struct Mol Biol 19: 485–491, S481. 10.1038/nsmb.2284 - DOI - PMC - PubMed
    1. Devenish RJ, Prescott M, Rodgers AJ (2008) The structure and function of mitochondrial F1F0-ATP synthases. Int Rev Cell Mol Biol 267: 1–58. 10.1016/S1937-6448(08)00601-1 - DOI - PubMed
    1. Allegretti M, Klusch N, Mills DJ, Vonck J, Kuhlbrandt W, et al. (2015) Horizontal membrane-intrinsic alpha-helices in the stator a-subunit of an F-type ATP synthase. Nature 521: 237–240. 10.1038/nature14185 - DOI - PubMed
    1. Zhou A, Rohou A, Schep DG, Bason JV, Montgomery MG, et al. (2015) Structure and conformational states of the bovine mitochondrial ATP synthase by cryo-EM. Elife 4. - PMC - PubMed
    1. Walker JE (2013) The ATP synthase: the understood, the uncertain and the unknown. Biochem Soc Trans 41: 1–16. 10.1042/BST20110773 - DOI - PubMed

Publication types

MeSH terms

LinkOut - more resources