Review
. 2016 Jul 8:39:325-46.
doi: 10.1146/annurev-neuro-070815-013934.

Face Processing Systems: From Neurons to Real-World Social Perception

Affiliations
Review

Face Processing Systems: From Neurons to Real-World Social Perception

Winrich Freiwald et al. Annu Rev Neurosci. .

Abstract

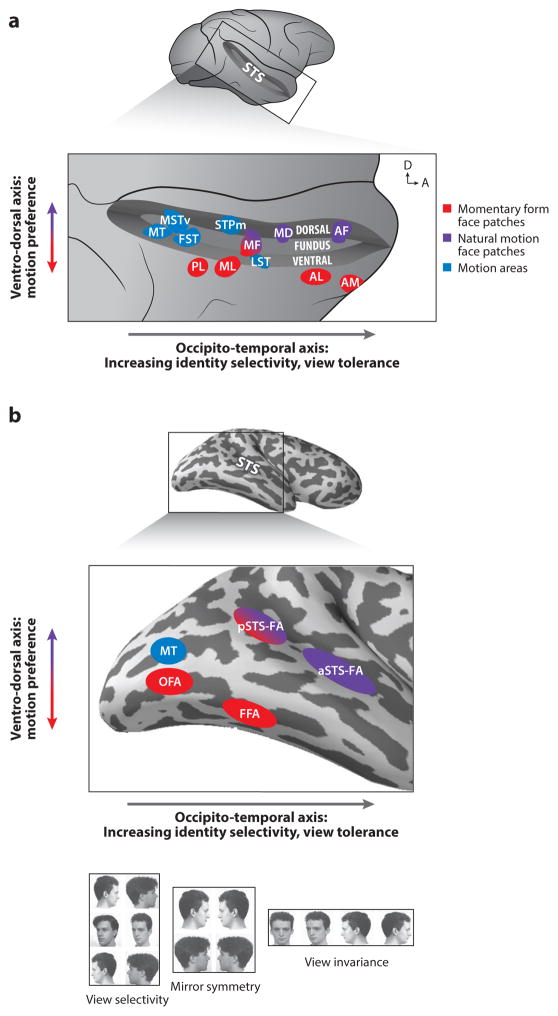
Primate face processing depends on a distributed network of interlinked face-selective areas composed of face-selective neurons. In both humans and macaques, the network is divided into a ventral stream and a dorsal stream, and the functional similarities of the areas in humans and macaques indicate they are homologous. Neural correlates for face detection, holistic processing, face space, and other key properties of human face processing have been identified at the single neuron level, and studies providing causal evidence have established firmly that face-selective brain areas are central to face processing. These mechanisms give rise to our highly accurate familiar face recognition but also to our error-prone performance with unfamiliar faces. This limitation of the face system has important implications for consequential situations such as eyewitness identification and policing.

Keywords: face recognition; functional brain organization; neural mechanisms of behavior; social brain function.


Figures

Fig. 1
Fig. 1. Organization of Face Processing Systems in the Macaque and Human Brain
a. Face patches in the macaque superior temporal sulcus (STS), shown here (top) opened on a lateral view of the brain, are functionally organized along an occipito-temporal (posterior-anterior) axis and a ventro-dorsal axis (expanded view, bottom). Arrows in upper right corner indicate dorsal (D) and anterior (A) direction. General motion areas (blue) and face areas (red and purple) are shown. Ventral areas (in the ventral bank of the STS and further ventrally) are selective for momentary form of faces (red), while areas at more medio-dorsal locations in the STS (fundus and dorsal bank) are selective for natural facial motion (purple). Hierarchical processing from view selective to view invariant representation is manifested in the posterior-anterior axis: representations are transformed from view-specific into increasingly view tolerant and facial identity-selective ones. b. Face and motion areas (colors as in a) in the human brain are found ventrally in the lateral occipital cortex and the fusiform gyrus and dorsally in the superior temporal sulcus. A functional organization of hierarchical processing along the posterior-anterior axis and sensitivity to motion along the ventral-dorsal axis is found, similar to the one in the macaque brain. The ventral areas (red) show no sensitivity to motion whereas face areas in the STS are highly sensitive to moving faces. As in the macaque brain, the transformation along the occipito-temporal axis progresses via an intermediate representation that does not differentiate between left and right profile views (bottom). View selectivity was found in the lateral occipital cortex and mirror symmetry in the fusiform gyrus and posterior superior temporal sulcus.
Fig. 2
Fig. 2. Mechanisms for Face Detection, Holistic Face Processing, and Face Space
a. (left) To generate stimuli that probe selectivity for coarse-contrast face-stimuli, a front-view picture of a face was segmented into eleven areas, to which eleven luminance values were then randomly assigned (Ohayon et al 2012). Recordings from the middle face patches (MF/ML, bottom) during stimulus presentation revealed selectivity of cells to the polarity of a large fraction of all possible contrast pairs and dominance of a single polarity for each pair. (Right) Histogram of ten most common contrast polarity features and their relative proportion in the cell population. The top two contrast polarity features express higher luminance for the nose region than left and right eye, respectively. Five of these contrast features and their polarity were predicted by human psychophysics (columns outlined in orange). b. Effects of “Thatcherizing” faces on face-selective responses in single units from face area ML (left) and the evoked potential from the right occipito-temporal electrode in humans (right). Left: Face cells in ML differentiate between intact and Thatcherized upright faces (blue and red), but not between intact and Thatcherized inverted faces (green and yellow) (Taubert et al 2015b). This is consistent with the behavioral Thatcher illusion first reported by Thompson (Thompson 1980). Right: Event related potentials to Thatcherized and intact upright and inverted faces recorded from a right occipito-temporal EEG electrode in humans also show a difference in the amplitude of the N170 between intact and Thatcherized upright faces but no difference for inverted faces (Carbon et al 2005). c. i Two dimensional depiction of perceptual face space (Leopold et al 2001). The space is centered on an average face. Each face occupies a particular location in face space based on its deviation from the average face along many dimensions. Faces along the same trajectory originating at the average face all have the same identity, but faces further from the average face have greater identity strength and are therefore more distinctive. An anti-face is a face on the opposite side of the average face from a face with an equal identity strength. Aftereffects for opposite adaptor pairs are greater than aftereffects for non-opposite faces matched for perceptual similarity. ii Facial feature selectivity of a middle face patch neuron (Freiwald et al 2009). Macaques viewed cartoon faces that varied randomly along nineteen dimensions, each with feature values ranging from one extreme (−5) to another (+5) (valence arbitrary). Typical cells were tuned to small subsets of feature dimensions (here four) and exhibited ramp-shape tuning curves with minimal responses elicited by one feature extreme and maximal responses by the opposite feature extreme. Thus tuning curves spanned face space. The sample neuron shown here was modulated by face aspect ratio (preferring narrow faces), inter-eye distance (preferring narrowly spaced eyes), eye aspect ratio (preferring wide eye shapes), and iris size (preferring large). iii. Response of a face-responsive cell, recorded likely in AM to stimulus trajectories originating in the average face. The center figure illustrates stimuli shown and their organization along three trajectories (red, blue, black) originating in the center of face space. For all trajectories, the neuron’s firing rate increased with distance from the center of face space.
Fig. 3
Fig. 3. Causal Studies of Face Processing
a. Effect of TMS over three right hemisphere category-selective areas on sequential face discrimination (Pitcher et al 2009). The behavioral effect was computed by subtracting % correct in the absence of TMS from % correct when TMS was delivered over a given area. TMS over the occipital face area (OFA) disrupted face discrimination whereas TMS over the lateral occipital (LO) object area and extra-striate body area (EBA) had no significant effect on face discrimination. Similar category-selective effects were found for object discrimination at LO and body discrimination at EBA (not shown). b. Effect of muscimol microinjection on face gender discrimination (Afraz et al 2015). The behavioral effect was calculated by subtracting % correct when faces were presented in the ipsilateral visual field (VF) from % correct in the contralateral VF. Sites had been categorized as “face detector sites” or “other IT sites” based on the response to briefly presented images of faces and non-face objects prior to muscimol injection. Inactivation of face detector, but not control sites, caused a deficit in face gender discrimination.
Fig. 4
Fig. 4. From Non-Familiar Face Recognition to Person Knowledge
a. Forty face images, unfamiliar to most, which subjects had to sort by identity (Jenkins & Burton 2011). Although the array includes 20 images of two individuals each, subjects sorted them into an average of seven identities. Subjects familiar with the two individuals successfully sorted the images to two identities. These results demonstrate the challenge of generalizing across different images of the same person for unfamiliar faces. b. A single neuron in the medial temporal lobe of an epilepsy patient exhibiting robust responses to a wide range of images of actress Halle Barry, including images in which her face is completely masked, and even her name written in letters (Quiroga et al 2005). The response profile demonstrates that non-face related knowledge (i.e. knowledge about the movie she appeared in with this mask, knowledge of her name) shaped the response of this neuron, thus generating a highly invariant person representation beyond the representations that can be obtain from vision alone.

References

    1. Afraz A, Boyden ES, DiCarlo JJ. Optogenetic and pharmacological suppression of spatial clusters of face neurons reveal their causal role in face gender discrimination. Proceedings of the National Academy of Sciences of the United States of America. 2015;112:6730–5. - PMC - PubMed
    1. Afraz SR, Kiani R, Esteky H. Microstimulation of inferotemporal cortex influences face categorization. Nature. 2006;442:692–5. - PubMed
    1. Andersen SM, Carlson CA, Carlson M, Gronlund SD. Individual Differences Predict Eyewitness Identification Performance. Personality and Individual Differences. 2014;60:36–40.
    1. Axelrod V, Yovel G. Hierarchical processing of face viewpoint in human visual cortex. The Journal of neuroscience : the official journal of the Society for Neuroscience. 2012;32:2442–52. - PMC - PubMed
    1. Axelrod V, Yovel G. The challenge of localizing the anterior temporal face area: a possible solution. NeuroImage. 2013;81:371–80. - PubMed

Publication types

LinkOut - more resources