. 2016 Jul 21;535(7612):382-7.
doi: 10.1038/nature18325.

Replication fork stability confers chemoresistance in BRCA-deficient cells

Affiliations

Replication fork stability confers chemoresistance in BRCA-deficient cells

Arnab Ray Chaudhuri et al. Nature. .

Erratum in

  • Erratum: Replication fork stability confers chemoresistance in BRCA-deficient cells.
    Chaudhuri AR, Callen E, Ding X, Gogola E, Duarte AA, Lee JE, Wong N, Lafarga V, Calvo JA, Panzarino NJ, John S, Day A, Crespo AV, Shen B, Starnes LM, de Ruiter JR, Daniel JA, Konstantinopoulos PA, Cortez D, Cantor SB, Fernandez-Capetillo O, Ge K, Jonkers J, Rottenberg S, Sharan SK, Nussenzweig A. Chaudhuri AR, et al. Nature. 2016 Nov 17;539(7629):456. doi: 10.1038/nature19826. Epub 2016 Sep 28. Nature. 2016. PMID: 27680696 No abstract available.

Abstract

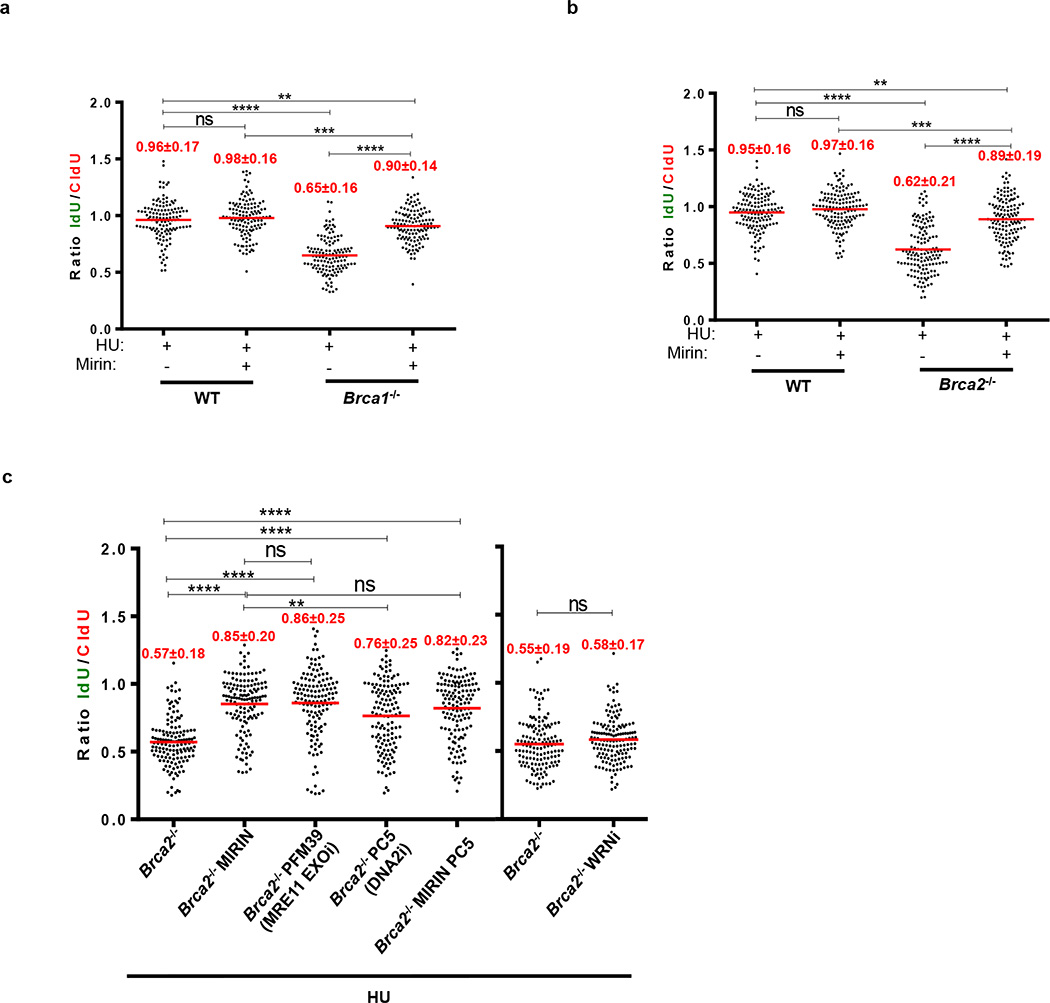
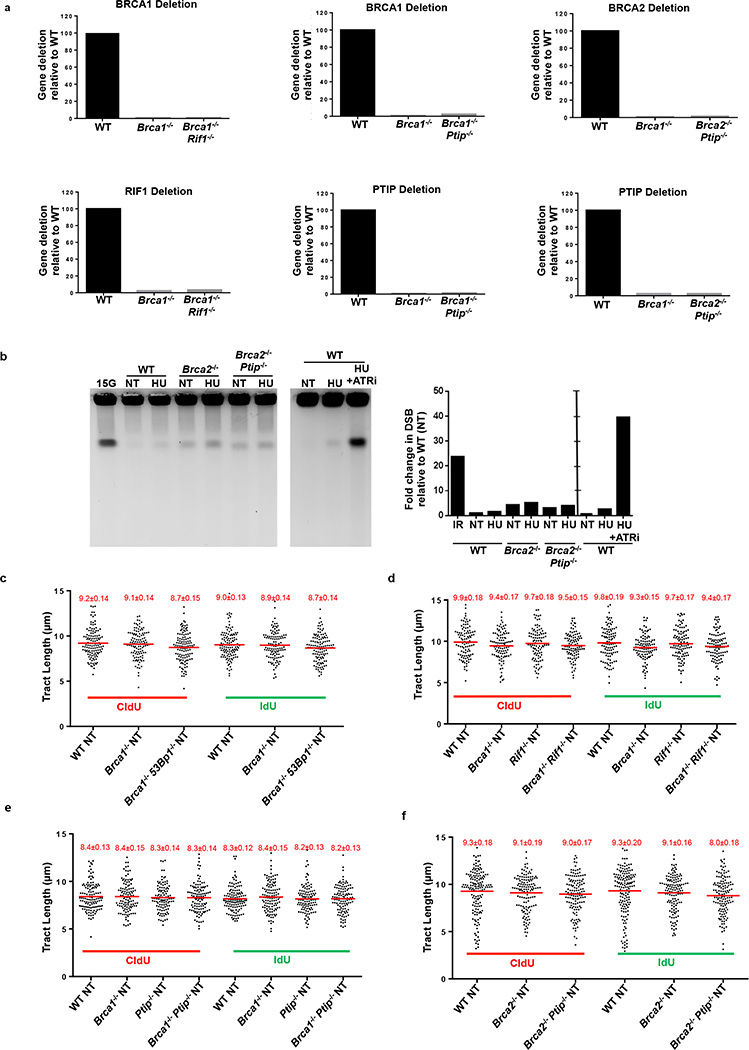
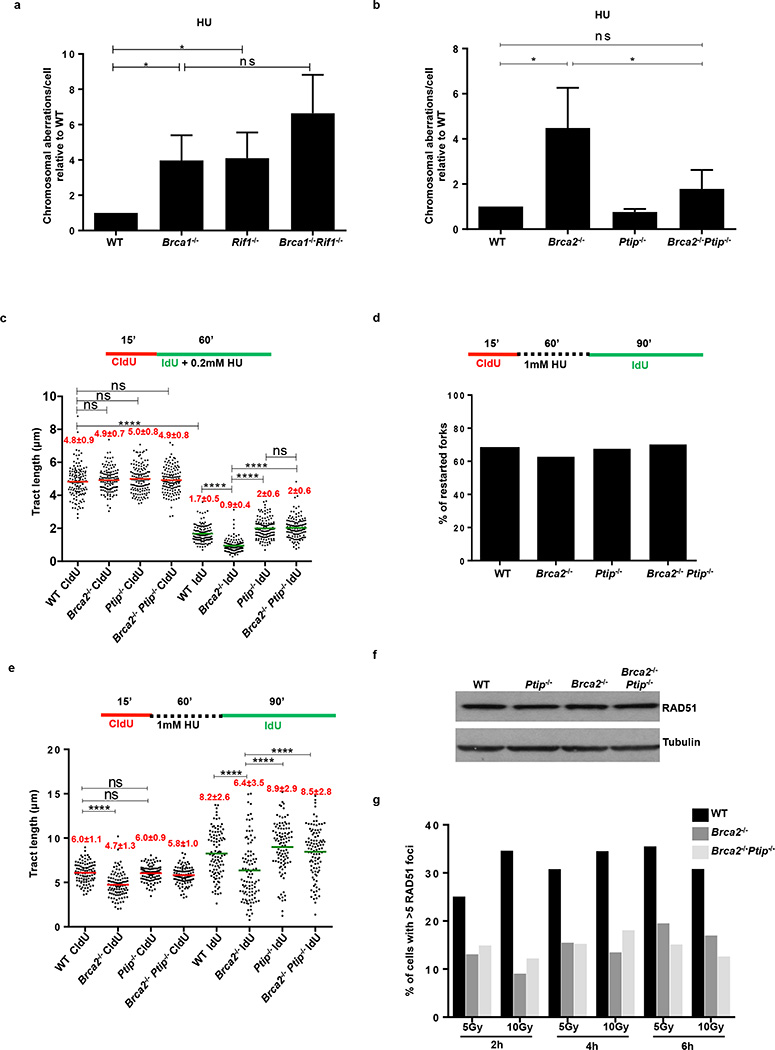
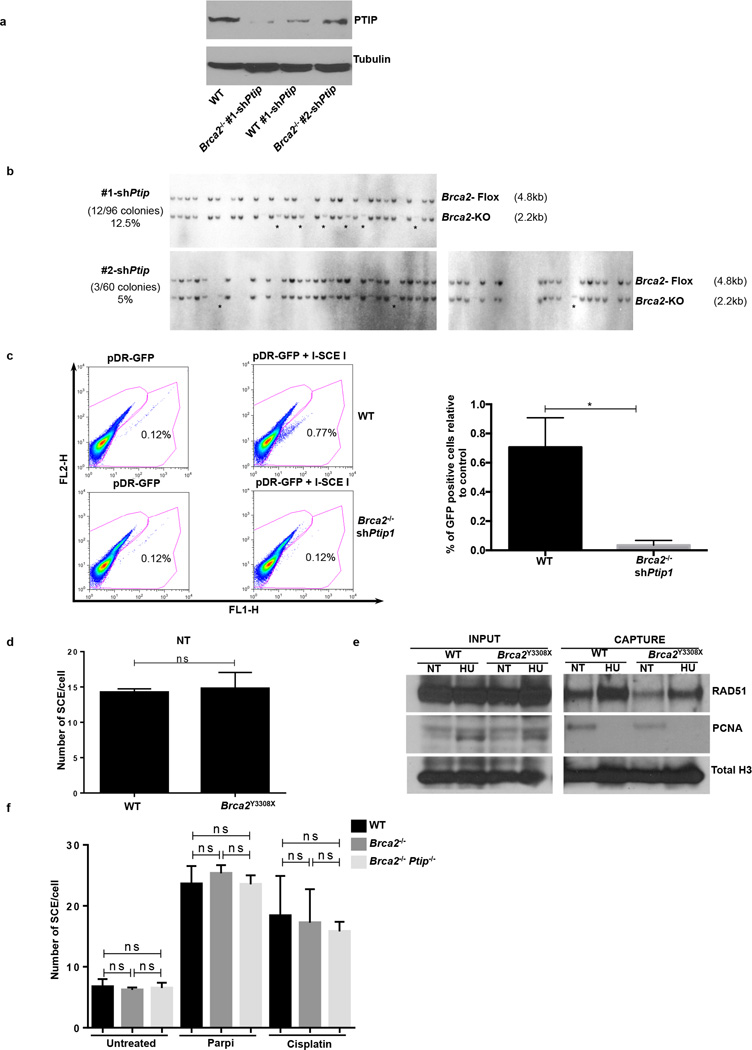
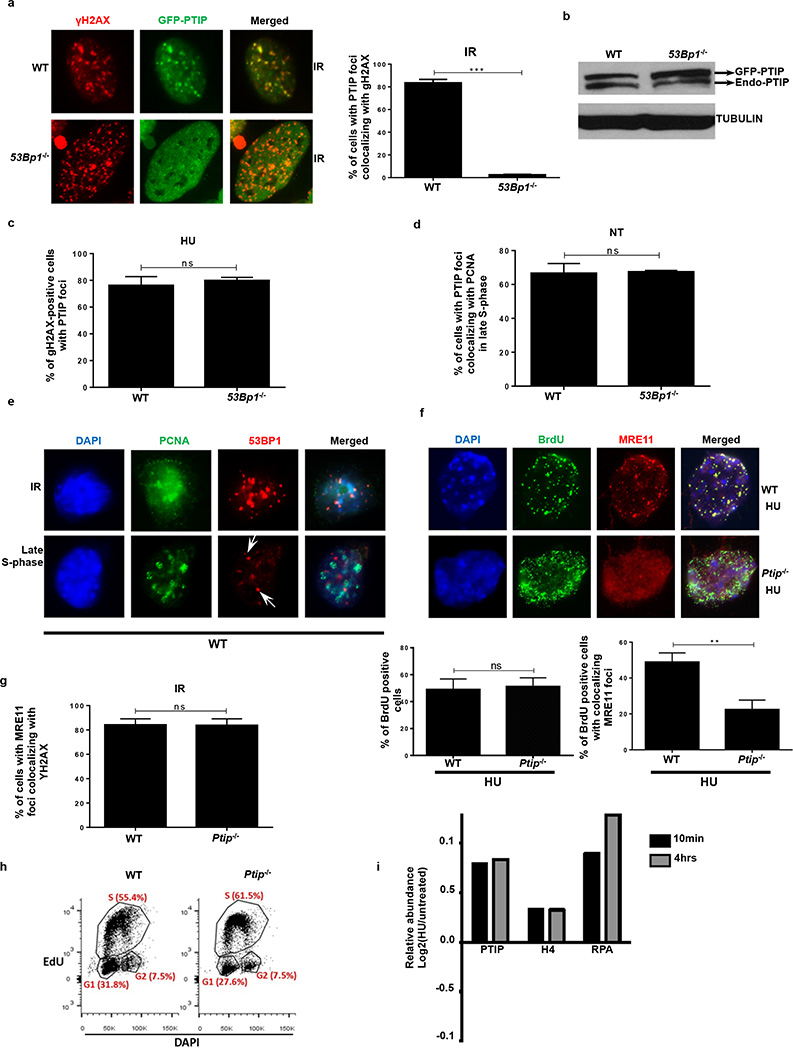
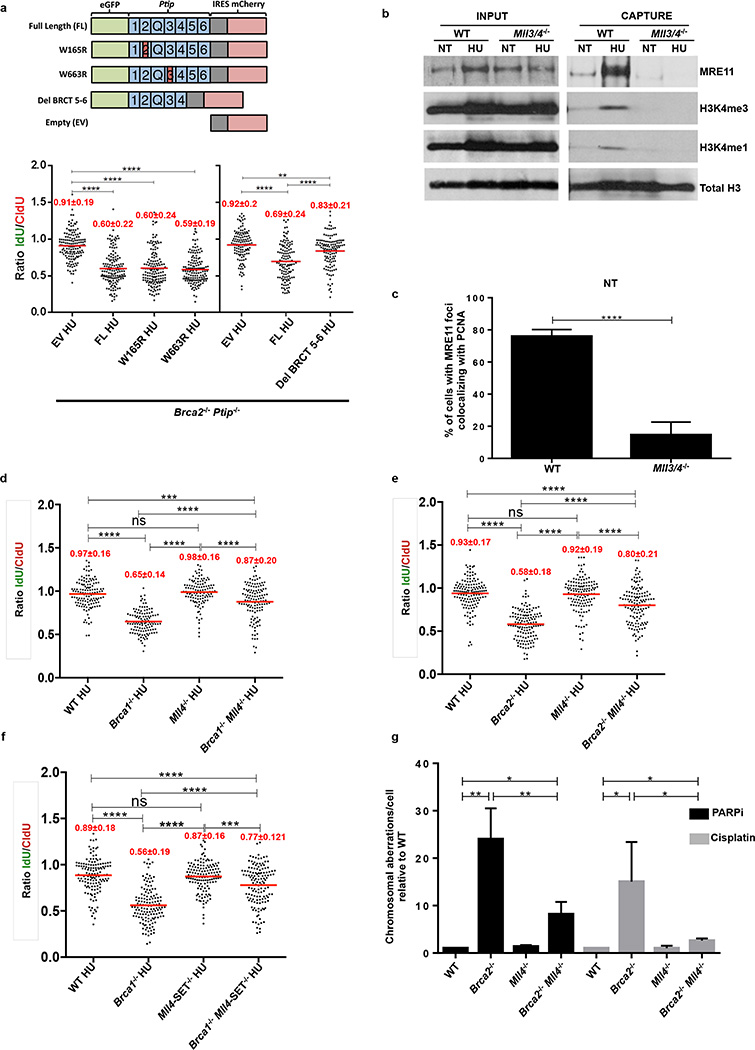
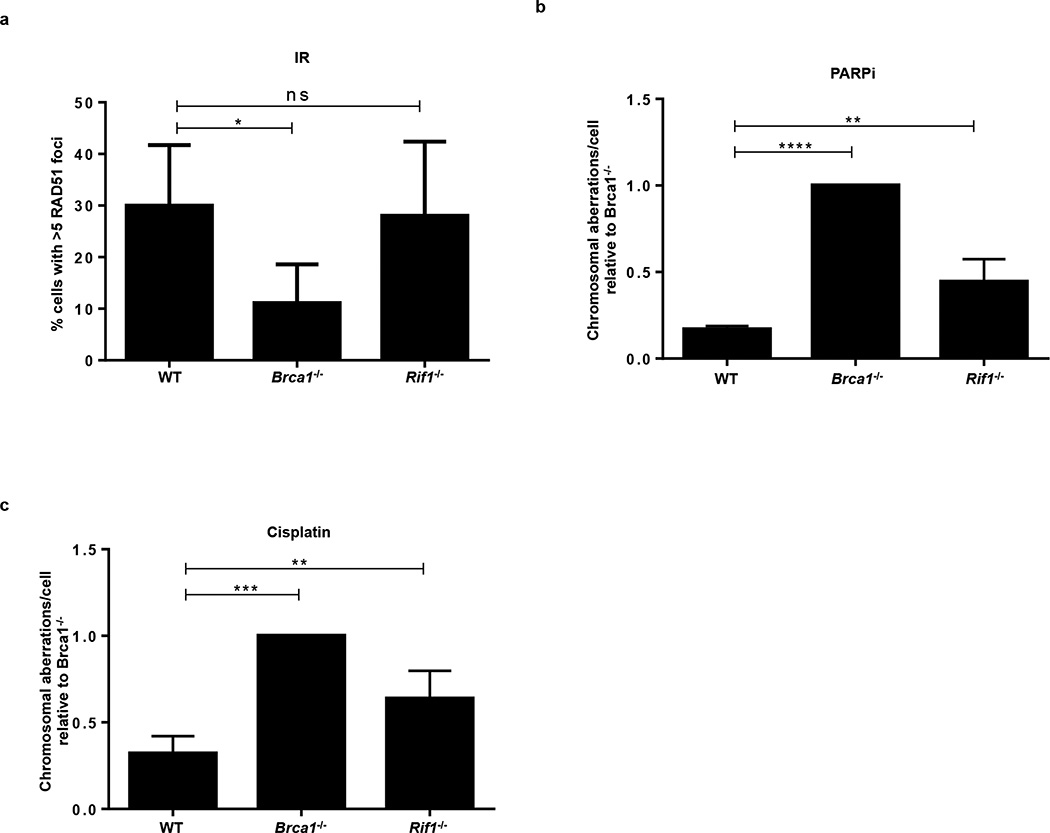
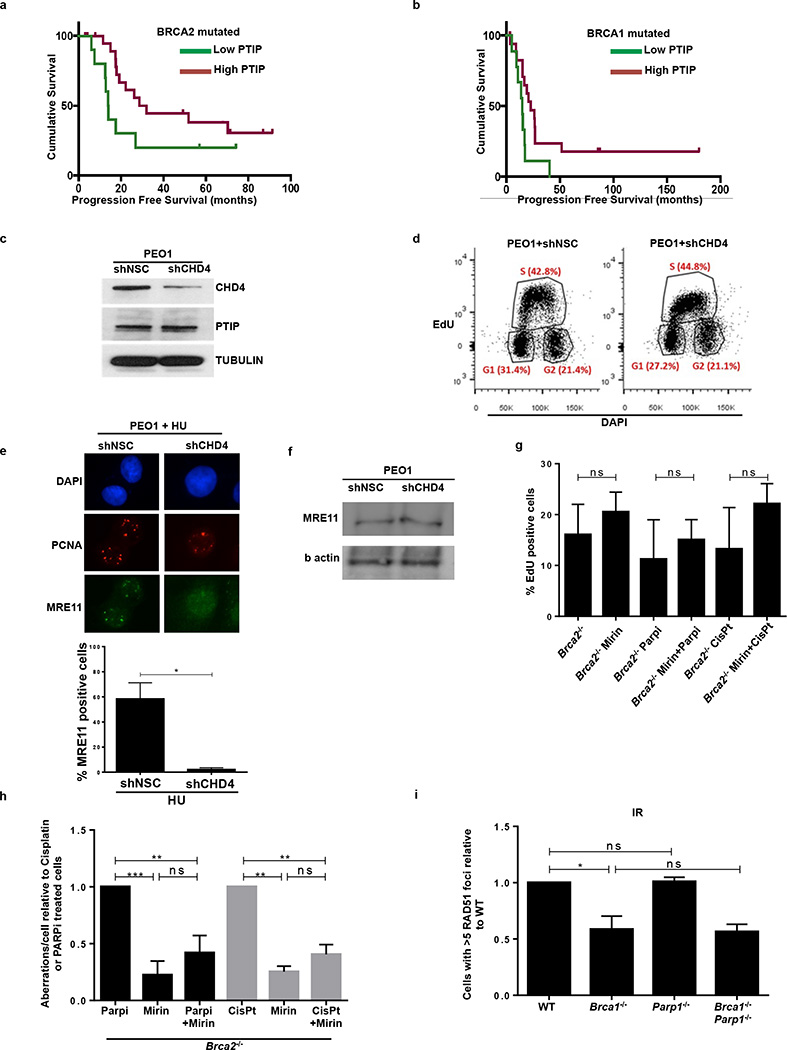
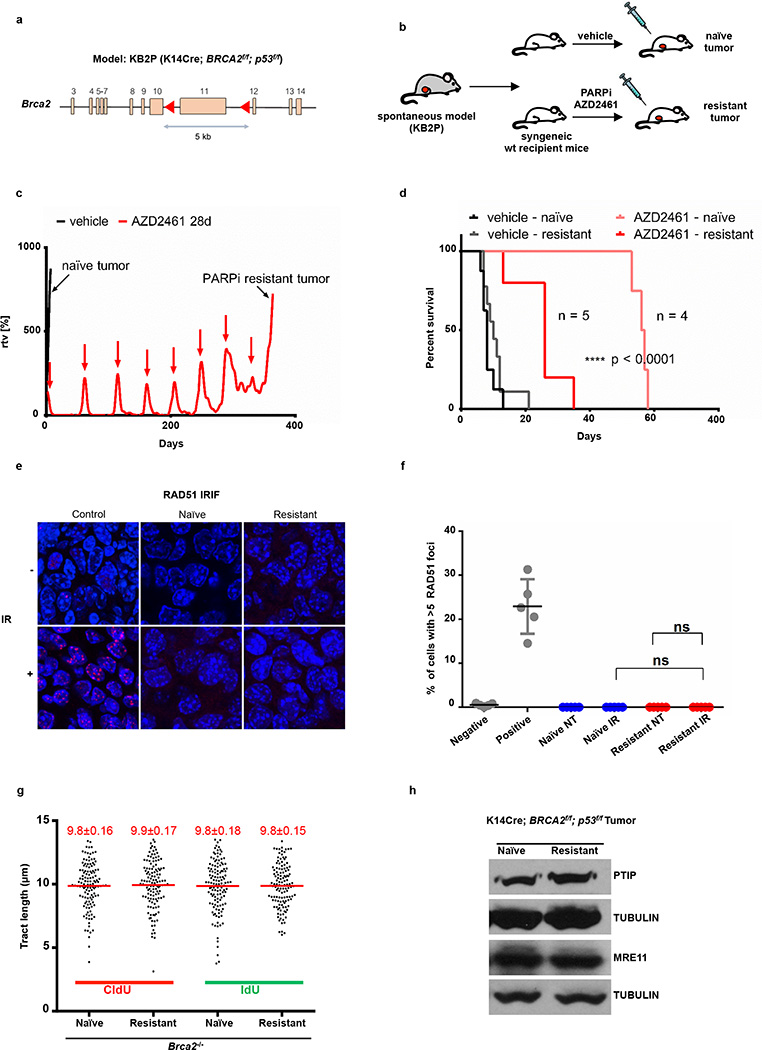
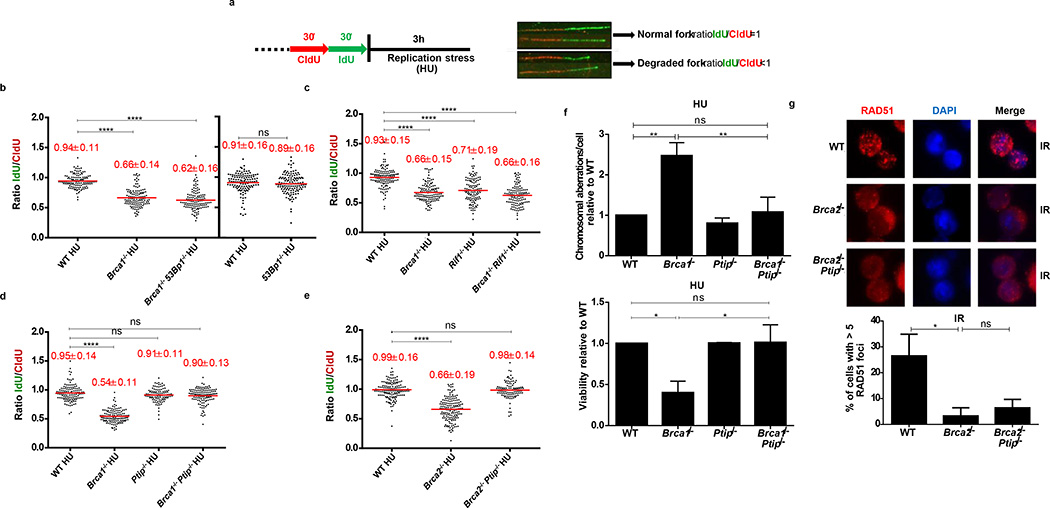
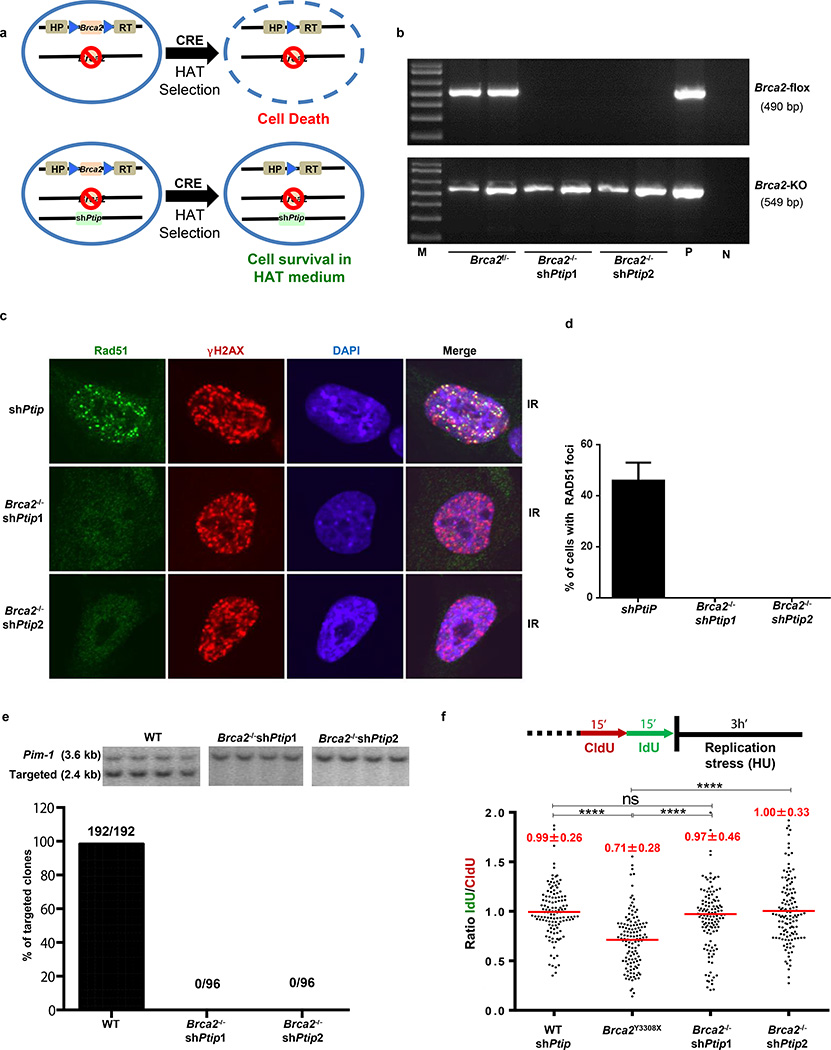
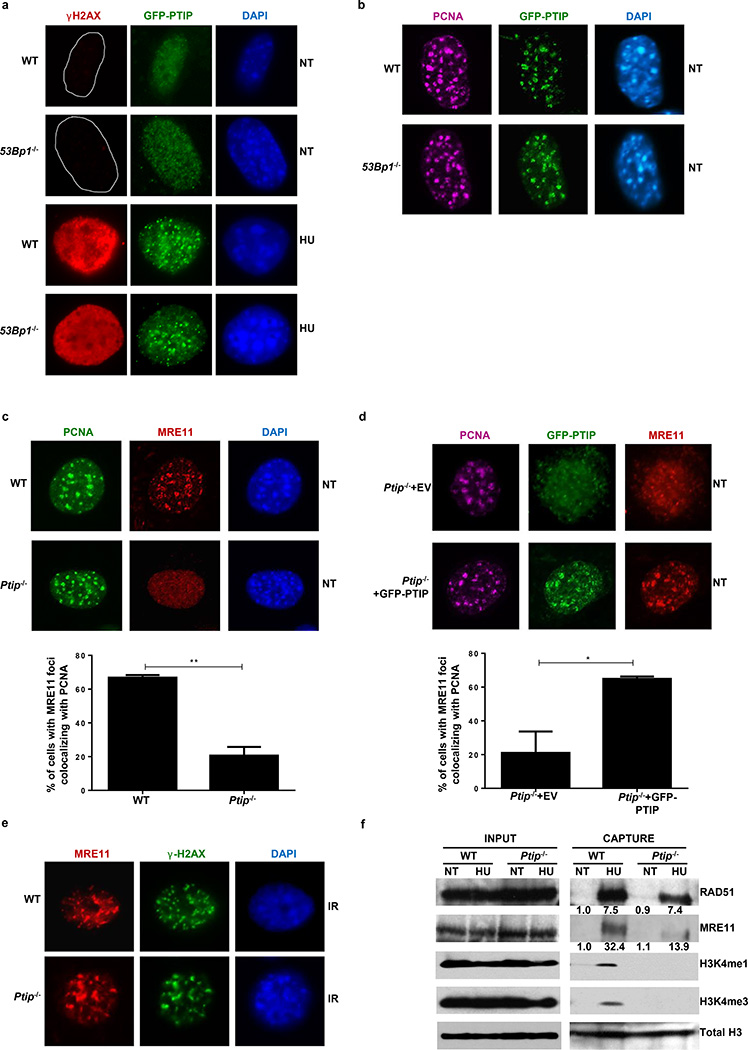
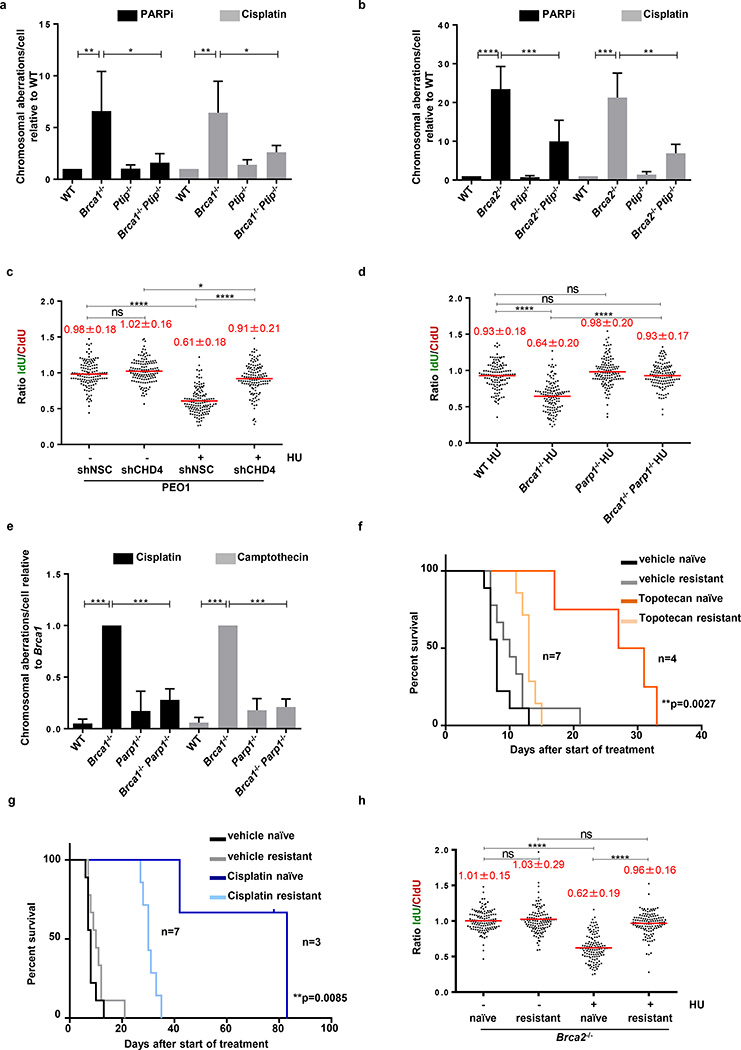
Cells deficient in the Brca1 and Brca2 genes have reduced capacity to repair DNA double-strand breaks by homologous recombination and consequently are hypersensitive to DNA-damaging agents, including cisplatin and poly(ADP-ribose) polymerase (PARP) inhibitors. Here we show that loss of the MLL3/4 complex protein, PTIP, protects Brca1/2-deficient cells from DNA damage and rescues the lethality of Brca2-deficient embryonic stem cells. However, PTIP deficiency does not restore homologous recombination activity at double-strand breaks. Instead, its absence inhibits the recruitment of the MRE11 nuclease to stalled replication forks, which in turn protects nascent DNA strands from extensive degradation. More generally, acquisition of PARP inhibitors and cisplatin resistance is associated with replication fork protection in Brca2-deficient tumour cells that do not develop Brca2 reversion mutations. Disruption of multiple proteins, including PARP1 and CHD4, leads to the same end point of replication fork protection, highlighting the complexities by which tumour cells evade chemotherapeutic interventions and acquire drug resistance.


Figures

Extended Data Fig. 1
Extended Data Fig. 1. Fork degradation in BRCA-deficient B lymphocytes is mediated by MRE11 exonuclease activity
(a, b) Ratio of IdU vs. CldU upon HU treatment in (a) WT, Brca1−/− and (b) WT, Brca2−/− B lymphocytes with or without mirin pre-treatment. Numbers in red indicate the mean and standard deviation for each sample (ns, not significant, ** P ≤ 0.05, *** P ≤ 0.001, ****P ≤ 0.0001, Mann-Whitney test). 125 replication forks were analyzed for each genotype. (c) Ratio of IdU vs. CldU upon HU treatment in Brca2−/− B lymphocytes with or without mirin, PFM39 (MRE11 exonuclease inhibitor), PC5 (DNA2 inhibitor) or WRNi pre-treatment. Numbers in red indicate the mean and standard deviation for each sample (ns, not significant, ** P ≤ 0.05, ****P ≤ 0.0001, Mann-Whitney test). 125 replication forks were analyzed for each genotype.
Extended Data Fig. 2
Extended Data Fig. 2. Replication fork progression rates and DSBs in B lymphocytes
(a) Quantitative PCR analysis for Brca1, Brca2, Ptip and Rif1 gene deletions in WT, Brca1−/−, Brca1−/− Rif1−/−, Brca1−/−Ptip−/−, Brca2−/− and Brca2−/− Ptip−/− primary B lymphocytes after infection with CRE. (b) PFGE analysis for detection of DSBs in WT, Brca2−/− and Brca2−/− Ptip−/− B lymphocytes treated with or without 4 mM HU for 3 hr. Positive control for DSBs includes treatment of 15 Gy IR and HU +ATRi treatment for 3 hr. Quantification of -fold change in DSBs across genotypes relative to non-treated WT is plotted on the right. (c-f) Replication fork progression rates measured by tract lengths in µM of CldU (red) and IdU (green) in WT, Brca1−/−, Brca1−/− 53Bp1−/−, Rif1−/−, Brca1−/−Rif1−/−, Ptip−/−, Brca1−/− Ptip−/−, Brca2−/− and Brca2−/− Ptip−/− primary B lymphocytes. Samples were not treated with HU. Numbers in red indicate the mean and standard deviation for each sample. 125 replication forks were analyzed for each genotype.
Extended Data Fig. 3
Extended Data Fig. 3. Loss of PTIP rescues fork progression and restart defects in Brca2-deficient B lymphocytes but does not affect RAD51 IRIF
(a) Genomic instability measured in metaphase spreads from B lymphocytes derived from WT, Brca1−/−, Rif1−/−, Brca1−/−Rif1−/− mice treated for 6 hr with 10 mM HU (ns, not significant, * P ≤ 0.05, Unpaired t-test). 50 metaphases were analyzed per condition. Experiments were repeated 3 times. (b) Genomic instability measured in metaphase spreads from B lymphocytes derived from WT, Brca2−/−, Ptip−/−, Brca2−/−Ptip−/− mice treated for 6 hr with 10 mM HU (ns, not significant, * P ≤ 0.05, Unpaired t-test). 50 metaphases were analyzed per condition. Experiments were repeated 3 times. (c) Fork progression in B lymphocytes derived from WT, Brca2−/−, Ptip−/−, Brca2−/−Ptip−/− mice treated for 1 hr with 0.2 mM HU. Y-axis represents the tract lengths in µm. Numbers in red indicate the mean and standard deviation for each sample (ns, not significant, ****P ≤ 0.0001, Mann-Whitney test). 150 replication forks were analyzed for each genotype. (d) Percentage of restarted replication forks in WT, Brca2−/−, Ptip−/−, Brca2−/−Ptip−/− B cells treated for 1 hr with 1 mM HU followed by 90 min recovery. 200 replication forks were analyzed for each genotype. (e) Tract lengths of restarted replication forks in WT, Brca2−/−, Ptip−/−, Brca2−/−Ptip−/− B cells treated for 1 hr with 1 mM HU followed by 90 min recovery. Y-axis represents the tract lengths in µm. Numbers in red indicate the mean and standard deviation for each sample (ns, not significant, ****P ≤ 0.0001, Mann-Whitney test). 150 replication forks were analyzed for each genotype. (f) Western blot analysis for RAD51 levels in WT, Ptip−/−, Brca2−/− and Brca2−/−Ptip−/− B cell extracts. Tubulin is used as loading control. (g) Quantification of RAD51 foci formation in WT, Brca2−/− and Brca2−/−Ptip−/− B cells upon treatment with 5 and 10 Gy IR and recovery for 2, 4 and 6 hr (n=150 cells analyzed).
Extended Data Fig. 4
Extended Data Fig. 4. Depletion of PTIP rescues the lethality of Brca2-deficient ES cells
(a) Western blot analysis for PTIP levels in WT and two different clones of Brca2−/− ES cells electroporated with shPtip. (b) Southern blot analysis for determination of Brca2 deletion in surviving clones electroporated with shPtip. Probes distinguishing the Brca2-flox/ allele (4.8 kb) (upper band) and Brca2 KO allele (2.2 kb) (lower band) were used. * indicates surviving ES cell clones with Brca2 deletion and simultaneous down-regulation of PTIP (12/96 Brca2-deleted colonies were found with shPtip1 and 3/60 colonies were found with shPtip2). Genotyping was confirmed by PCR (Fig. 2b). (c) Upper panel shows representative FACS profiles of WT and Brca2−/−/shPtip ES cells electroporated with either pDR-GFP plasmid only (control) or pDRGFP and I-SceI expressing vector for 48 hr. Gene conversion of the pDR-GFP construct by HR is determined by the percentage of GFP-positive cells (FL1, green-detection filter; FL2, red-detection filter). Lower graph shows the quantification of the percentage of GFP-positive cells in WT and Brca2−/−/shPtip ES cells across 3 independent experiments. ns, not significant, *P ≤ 0. 05, Unpaired t-test. (d) Sister chromatid exchange (SCE) analysis in WT and Brca2Y3308X hypomorphic ES cells. Twenty metaphases were analyzed per condition; experiments were repeated 3 times. (e) WT and Brca2Y3308X hypomorphic ES cells were preincubated with mirin, EdU-labeled for 15 min and treated with 4 mM HU for 2 hr. Proteins associated with replication forks were isolated by iPOND and detected by Western blotting with the indicated antibodies. (f) SCEs in WT, Brca2−/− and Brca2−/− Ptip−/− B cells either untreated or treated overnight with 1 µM PARPi or with 0.5 µM cisplatin (ns, not significant, *P ≤ 0.05, ** P ≤ 0.001, Unpaired t-test). Twenty metaphases were analyzed per condition; experiments were repeated 3 times.
Extended Data Fig. 5
Extended Data Fig. 5. PTIP localizes to sites to DNA replication independently of DSBs
(a) WT and 53Bp1−/− MEFs were retrovirally infected with a GFP-tagged PTIP construct. Cells were then irradiated with 10 Gy and allowed to recover. Co-localization of γ-H2AX (red) and PTIP (green) was assessed. Adjoining graph quantifies the percentage of cells with γ-H2AX foci co-localizing with PTIP upon irradiation. (n=150 cells analyzed). Experiments were repeated 3 times. (b) Western Blot analysis for endogenous and overexpressed PTIP levels in WT and 53Bp1−/− MEFs retrovirally infected with a GFP-tagged PTIP construct (GFP-PTIP). (c) Quantification of the percentage of pan-nuclear γ-H2AX-positive cells with PTIP foci in WT and 53Bp1−/− MEFs upon treatment with HU (related to Fig. 3a) (n=150 cells analyzed). Experiments were repeated 3 times. (d) Quantification of the percentage of cells with PTIP foci co-localizing with PCNA in WT and 53Bp1−/− MEFs in late S-phase (related to Fig. 3b) (n=150 cells analyzed). Experiments were repeated 3 times. (e) Representative immunofluorescence images of PCNA and 53BP1 co-staining in irradiated WT cells (10 Gy) or in late S-phase sites. White arrows indicate that the few 53BP1 foci observed in late S-phase cells do not colocalize with PCNA. (n=50 cells analyzed). Experiments were repeated 3 times. (f) Representative immunofluorescence images of WT and Ptip−/− MEFs treated with 4 mM HU for 2 hr and analyzed for ssDNA (BrdU) and MRE11 colocalization. Bottom panels shows the quantification of BrdU-positive cells (left) and the percentage of MRE11colocalization in BrdU-positive cells (right) upon HU treatment in WT and Ptip−/− MEFs. (n=150 cells analyzed). Experiments were repeated 3 times. (g) Quantification of the percentage of cells with MRE11 foci co-localizing with γ-H2AX upon IR treatment (10 Gy) in WT and Ptip−/− MEFs (related to Fig. 3e) (n=150 cells analyzed). Experiments were repeated 3 times. (h) Cell cycle profiles in WT and Ptip−/− MEFs as measured by the incorporation EdU (y-axis) vs. DAPI (x-axis). (i) iPOND coupled to SILAC Mass-Spectrometry analysis for PTIP, H4 and RPA enrichment at stalled forks in 293T cells upon 3 mM HU treatment for 10 min and 4 hr.Y-axes represent the relative abundance of the indicated proteins on a log2 scale.
Extended Data Fig. 6
Extended Data Fig. 6. MLL3/4 promotes replication fork degradation in Brca2- deficient cells
(a) Upper panel shows the schematic of the retroviral PTIP mutant constructs used to identify the domain of PTIP involved in driving replication fork degradation. Different BRCT domains in PTIP are numbered and Q represents the glutamine rich region between the 2nd and the 3rd BRCT domains. Lower graph panel shows the ratio of IdU vs. CldU upon HU treatment of Brca2−/− Ptip−/− B lymphocytes retrovirally infected with either EV, FL, W165R, W663R and Del BRCT 6-5 PTIP-mutant constructs and sorted for GFP or mCherry expression. Numbers in red indicate the mean and standard deviation for each sample (**P ≤ 0.01, ****P ≤ 0.0001, Mann-Whitney test). 125 replication forks were analyzed for each condition. (b) WT and Mll3/4−/− MEFs were EdU-labeled for 15 min and treated with 4 mM HU for 4 hr. Proteins associated with replication forks were isolated by iPOND and detected by Western blotting with the indicated antibodies. (c) Quantification of the percentage of cells with MRE11 foci co-localizing with PCNA in late S-phase in WT and MLL3/4−/− MEFs (n=150 cells analyzed). Experiments were repeated 3 times. (d-f) Ratio of IdU vs. CldU upon HU treatment in WT, Brca1−/−, Brca2−/− Mll4−/−, Mll4-SET−/−, Brca1−/−Mll4−/−, Brca2−/−Mll4−/− and Brca1−/−Mll4-SET−/− B cells. Numbers in red indicate the mean and standard deviation for each sample (ns, not significant, ****P ≤ 0.0001, Mann-Whitney test). At least 125 replication forks were analyzed for each genotype. (g) Genomic instability measured in metaphase spreads from splenic B cells derived from WT, Brca2−/−, Mll4−/−, Brca2−/−Mll4−/− B cells treated overnight with 1 µM PARPi or with 0.5 µM cisplatin (**P ≤ 0.01, ***P ≤ 0.001, Unpaired t test). 50 metaphases were analyzed per condition. Experiments were repeated 3 times.
Extended Data Fig. 7
Extended Data Fig. 7. Loss of RIF1 results in chromosomal instability
(a) Quantification of RAD51 foci formation in WT, Brca1−/− and Rif1−/− B cells. Cells were treated with 10 Gy and harvested 4 hr post-IR (ns, not significant, *P ≤ 0.05). At least 100 cells were analyzed per condition; experiments were repeated 3 times. (b-c) Genomic instability measured in metaphase spreads from splenic B cells derived from WT, Brca1−/− and Rif1−/− mice treated overnight with 1 µM PARPi (b) or with 0.5 µM cisplatin (c) (ns, not significant, **P ≤ 0.01, ***P ≤ 0.001, **** P ≤ 0.0001, unpaired t-test). 50 metaphases were analyzed per condition; experiments were repeated 3 times.
Extended Data Fig. 8
Extended Data Fig. 8. Multiple mutations can cause resistance to DNA damaging agents in Brca-deficient cells
(a-b) Difference in progression-free survival (PFS) of BRCA2- and BRCA1-mutated ovarian serous adenocarcinoma patients with standard platinum-based regimens. Data was obtained from the TCGA project. Patients were separated into PTIP low- or high-expression based on the 33rd percentile of PTIP expression z-scores. The difference between the PFS of PTIP-low versus PTIP-high was assessed by univariate Log-rank P value (P < 0.072 and P < 0.032 in a and b, respectively). Analysis included 38 tumors with BRCA1 mutations and 34 tumors with BRCA2 mutations out of 316 high-grade serous ovarian cancers that underwent whole exome sequencing. PFS curves for PTIP-low and PTIP-high expressing tumors were generated by the Kaplan-Meier method. All reported p values are two-sided. (c) Western blot analysis for CHD4 and PTIP levels in PEO1 cells infected with shNSC and shCHD4. Tubulin is used as loading control. (d) Cell cycle profiles in PEO1 cells infected with shNSC and shCHD4 as measured by the incorporation of EdU (y-axis) vs DAPI (x-axis). (e) Immunostaining for MRE11 and PCNA in PEO1 cells infected with shNSC and shCHD4 upon treatment with 4 mM HU. Lower panel shows the quantification for MRE11 recruitment upon HU treatment. At least 100 cells were analyzed per condition; experiments were repeated 3 times. (f) Western blot analysis for CHD4 and MRE11 levels in PEO1 cells infected with shNSC and shCHD4. Actin is used as loading control. (g) Percentage of EdU positive cells was analyzed 20 hr after Brca2−/− B cells were treated with mirin alone, mirin+PARPi or mirin+cisplatin (ns, not significant). EdU was pulsed for 20 min prior to FACS analysis. Experiments were repeated 3 times. (h) Genomic instability measured in metaphase spreads from B cells derived from Brca2−/− mice pretreated with 25 µM mirin for 2 hr followed by overnight with 1 µM PARPi or 0.5 µM cisplatin (ns, not significant, *P ≤ 0.05, ** P ≤ 0.001, Unpaired t-test). 50 metaphases were analyzed per condition. Experiments were repeated 3 times. (i) Quantification of RAD51 foci formation in WT, Brca1−/−, Parp1−/− and Brca1−/−Parp1−/− B cells treated with 10 Gy IR and harvested 4 hr post-treatment. At least 100 cells were analyzed per condition; experiments were repeated 3 times.
Extended Data Fig. 9
Extended Data Fig. 9. Brca2-deficient tumors acquire PARPi resistance without restoration of RAD51 foci formation
(a) Schematic depicting the conditional BRCA2 allele of the KB2P (K14CRE;Brca2f/f;p53f/f) spontaneous tumor model. (b) Outline of the PARPi intervention study. A spontaneous BRCA2-/p53-deficient tumor was generated and re-transplated into syngeneic wild-type mice. When the tumors reached 200 mm3, they were treated either with vehicle or PARPi AZD2461. (c) PARPi response curve of the KB2P tumor (relative tumor volume (rtv) vs. days). The treatment for 28 consecutive days was started when the tumor reached 200 mm3 (rtv=100%). In response to the treatment the tumor shrank but eventually grew back. When it reached 100% rtv the treatment was repeated (as indicated with red arrows) for another 28 days. This regime was continued until the tumor became resistant to PARPi (black arrow). (d) The stability of acquired resistance of the KB2P tumor was confirmed by re-transplanting matched naive and resistant tumors and treating animals either with vehicle or AZD2461 (only one 28-day cycle). Kaplan-Meier survival curve indicates that resistant tumors did not respond to the AZD2461 treatment, while naive tumors exhibited high sensitivity, indicative of a stable genetic mechanism of resistance. (e, f) IR-induced RAD51 foci were detected by immunofluorescence in the KB2P donor: RAD51 foci formation was undetectable in naive and resistant tumors, suggesting that HR restoration is not an underlying mechanism of PARPi resistance. Spontaneous tumors from K14 Cre; p53f/f mice treated with IR were used as positive control for RAD51 foci. Unirradiated K14 Cre; p53f/f cells were used as a negative control. (g) Replication fork progression rates measured by tract lengths in µm of CldU (red) and IdU (green) in PARPi-naive or PARPi-resistant tumors. Numbers in red indicate the mean and standard deviation for each sample. 125 replication forks were analyzed for each condition. (h) Western blot analysis for PTIP and MRE11 levels in PARPi-naive or PARPi-resistant tumors. Tubulin is used as loading control.
Extended Data Fig. 10
Extended Data Fig. 10. Brca2-deficient ES cells have higher levels of chromatin-bound MRE11
(a) Representative image of a Brca2 hypomorph mouse ES (denoted Brca2Y3308X) cell showing MRE11 foci (red) in S-phase (identified by PCNA foci (green). DNA was stained with DAPI (blue). (b) High-throughput microscopy analysis quantifying the overall levels of chromatin-bound MRE11 per individual nucleus in WT and Brca2Y3308X cells treated as indicated (a.u., arbitrary units).
Figure 1
Figure 1. Loss of Ptip in Brca1/2-deficient B cells protects nascent DNA from degradation without restoring HR
(a) Schematic for labeling B cells with CldU and IdU. (b-e) Ratio of IdU vs. CldU upon HU treatment. Numbers in red indicate the mean and standard deviation. (ns, not significant, ****P ≤ 0.0001, Mann-Whitney test). 125 replication forks were analyzed for each genotype. (f) Genomic instability (top) and viability upon HU treatment (lower panel) relative to WT upon 6 hr of 10 mM HU treatment. (ns, not significant, ** P ≤ 0.001, *P ≤ 0.05, Unpaired t- test). 50 metaphases were analyzed. (g) Representative images (top) and quantification (below) of IR-induced RAD51 foci. (ns, not significant, *P ≤ 0.05, Unpaired t-test (n=120 cells examined)). Experiments were repeated 3 times.
Figure 2
Figure 2. PTIP deficiency rescues the lethality of Brca2-null mouse ES cells and confers fork protection
(a) Schematic for deletion of Brca2. (b) PCR genotyping of ES cell clones (M, marker; P, positive control for Brca2f/−; N, no DNA control). (c-d) Representative images (c) and quantification (d) of IR-induced foci in shPtip and Brca2−/−/shPtip ES cells (n=110 cells examined). (e) Representative Southern blot images (top) and quantification for targeting efficiency (bottom) for 59xDR-GFP gene targeting to the pim1 locus. (f) Ratio of IdU vs CldU. (ns, not significant, ****P ≤ 0.0001, Mann-Whitney test). 125 replication forks were analyzed.
Figure 3
Figure 3. PTIP localizes to sites of replication and recruits MRE11 to active and stalled replication forks
(a) WT and 53Bp1−/− MEFs expressing GFP-tagged PTIP were either treated or not (NT) with 4 mM HU and assessed for γ-H2AX (red) and PTIP (green). DAPI indicated in blue. Quantitation in Extended Data Fig. 5c. (b) Co-localization of PCNA (magenta) and PTIP (green). Quantitation in Extended Data Fig. 5d. (c) Co-localization of PCNA (green) and MRE11 (red). Quantitation in lower panel (n=150 cells examined). (d) Ptip−/− MEFs infected with either empty vector (EV, containing IRES-GFP) or full-length PTIP (FL) and probed for GFP (green), MRE11 (red), and PCNA (magenta). Quantitation in lower panel (n=150 cells examined). (e) MRE11 (red) and γ-H2AX (green) IR-induced foci. Quantitation in Extended Data Fig. 5g. (f) iPOND analyses of proteins at replication forks (capture). Input represents 0.25% of the total cellular protein content. RAD51 and MRE11 levels (shown below) were normalized to total H3. Experiments were repeated 3 times.
Figure 4
Figure 4. Replication fork protection confers genome stability and chemotherapeutic resistance
(a-b) Genomic instability measured in metaphase spreads from B cells (n=50; ns, not significant, *P ≤ 0.05, ** P ≤ 0.01, *** P ≤ 0.001,****P ≤ 0.0001, Unpaired t-test). Experiments were repeated 4 times. (c) Ratio of IdU vs. CldU in BRCA2-mutated PEO1 cells either mock (shNSC) infected or infected with shRNA against CHD4 (shCHD4). (ns, not significant, *P ≤ 0.05, ****P ≤ 0.0001, Mann-Whitney test). 125 replication forks were analyzed. (d) Ratio of IdU vs. CldU in HU-treated B cells. (ns, not significant, *P ≤ 0.05, ****P ≤ 0.0001, Mann-Whitney test). 125 replication forks were analyzed. (e) Genomic instability in B cells (n=50; ns, not significant, *** P ≤ 0.001, Unpaired t-test). Experiments repeated 4 times. (f-g) Kaplan-Meier survival curves in mice implanted with either PARPi-naïve or -resistant tumors and treated with either topotecan (f) or cisplatin (g) using Log-rank (Mantel-Cox) test. (h) Ratio of IdU vs. CldU in untreated or HU-treated tumors (PARPi naive vs. PARPi resistant). (ns, not significant, ****P ≤ 0.0001, Mann-Whitney test). 125 replication forks were analyzed.

References

    1. Lord CJ, Ashworth A. Mechanisms of resistance to therapies targeting BRCA-mutant cancers. Nature medicine. 2013;19:1381–1388. - PubMed
    1. Schlacher K, et al. Double-strand break repair-independent role for BRCA2 in blocking stalled replication fork degradation by MRE11. Cell. 2011;145:529–542. - PMC - PubMed
    1. Schlacher K, Wu H, Jasin M. A Distinct Replication Fork Protection Pathway Connects Fanconi Anemia Tumor Suppressors to RAD51-BRCA1/2. Cancer cell. 2012;22:106–116. - PMC - PubMed
    1. Ying S, Hamdy FC, Helleday T. Mre11-dependent degradation of stalled DNA replication forks is prevented by BRCA2 and PARP1. Cancer research. 2012;72:2814–2821. - PubMed
    1. Pathania S, et al. BRCA1 haploinsufficiency for replication stress suppression in primary cells. Nature communications. 2014;5:5496. - PMC - PubMed

Publication types

MeSH terms