. 2016 Jul 22:6:30187.
doi: 10.1038/srep30187.

Prolonged secretion of cortisol as a possible mechanism underlying stress and depressive behaviour

Affiliations

Prolonged secretion of cortisol as a possible mechanism underlying stress and depressive behaviour

Dong-Dong Qin et al. Sci Rep. .

Abstract

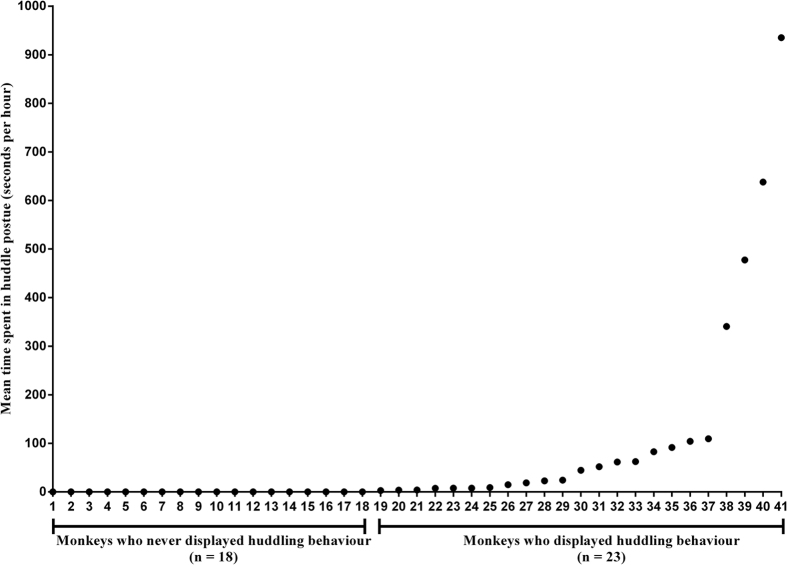
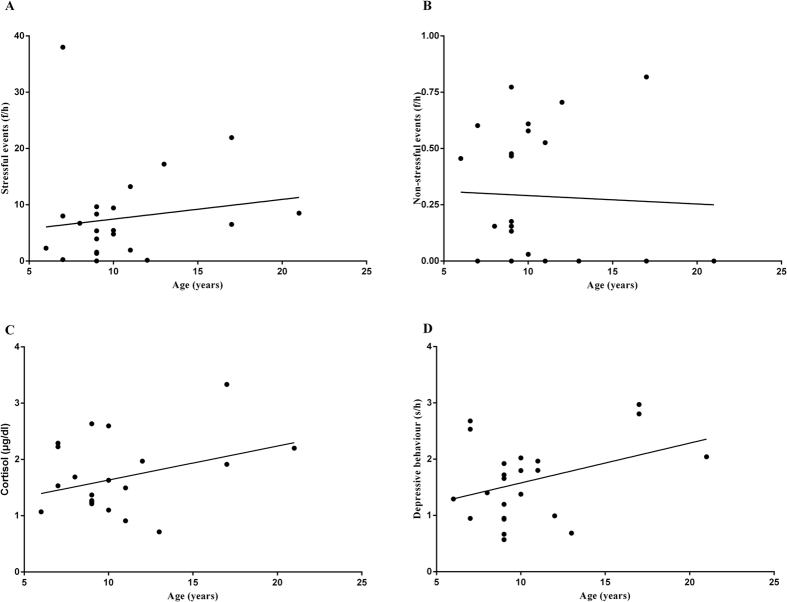
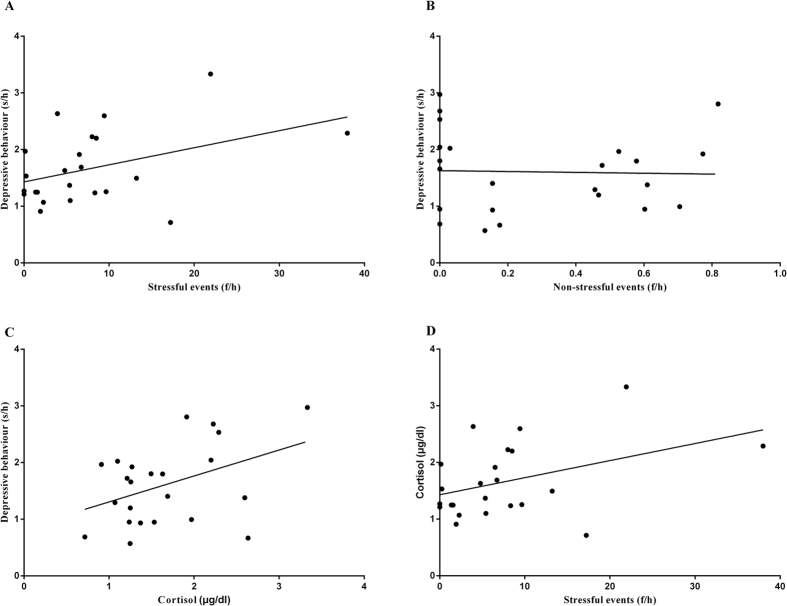
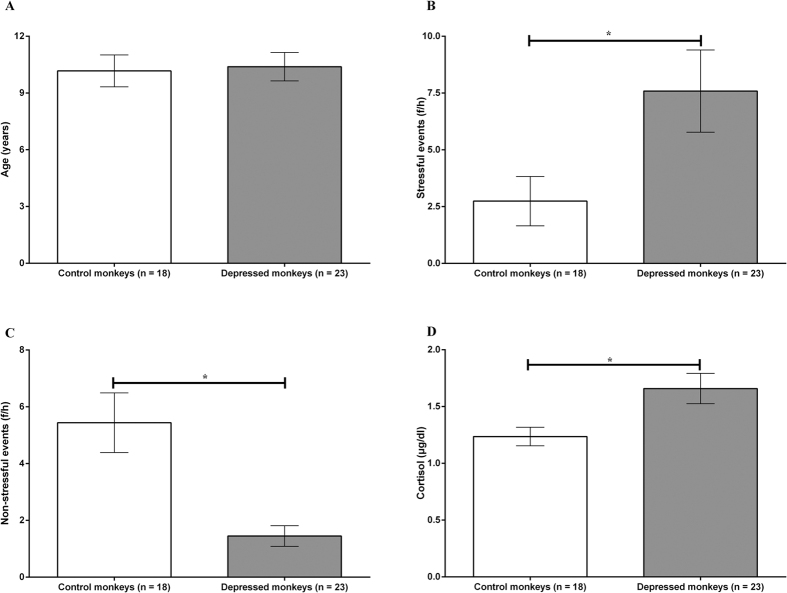
Stress is associated with the onset of depressive episodes, and cortisol hypersecretion is considered a biological risk factor of depression. However, the possible mechanisms underlying stress, cortisol and depressive behaviours are inconsistent in the literature. This study examined the interrelationships among stress, cortisol and observed depressive behaviours in female rhesus macaques for the first time and explored the possible mechanism underlying stress and depressive behaviour. Female monkeys were video-recorded, and the frequencies of life events and the duration of huddling were analysed to measure stress and depressive behaviour. Hair samples were used to measure chronic cortisol levels, and the interactions between stress and cortisol in the development of depressive behaviour were further evaluated. Significant correlations were found between stress and depressive behaviour measures and between cortisol levels and depressive behaviour. Stress was positively correlated with cortisol levels, and these two factors interacted with each other to predict the monkeys' depressive behaviours. This finding extends the current understanding of stress/cortisol interactions in depression, especially pertaining to females.


Figures

Figure 1
Figure 1. Huddling behaviours.
On the x-axis, monkey individuals are divided into two groups: monkeys who never displayed huddling behaviours (n = 18) and monkeys who displayed huddling behaviours (n = 23). The y-axis displays the mean time spent in a huddled posture (seconds per hour).
Figure 2
Figure 2. Relationships of age to life events, cortisol levels and depressive behaviour.
The x-axis represents the monkeys’ ages (years). The y-axis represents (A) the mean frequencies of stressful events that monkeys experienced per hour (f/h); (B) the logarithm of the mean frequencies of non-stressful events that monkeys experienced per hour (f/h); (C) the mean hair cortisol levels (μg/dl); and (D) the logarithm of the mean huddling time that monkeys displayed per hour (s/h).
Figure 3
Figure 3. Interrelationships among life events, cortisol and depressive behaviours.
(A) The x-axis represents the mean frequencies of stressful events that monkeys experienced per hour (f/h). The y-axis represents the logarithm of the mean huddling time that the monkeys displayed per hour (s/h). (B) The x-axis represents the logarithm of the mean frequencies of non-stressful events that the monkeys experienced per hour (f/h). The y-axis represents the logarithm of mean huddling time that monkeys displayed per hour (s/h). (C) The x-axis represents mean hair cortisol levels (μg/dl). The y-axis represents the logarithm of the mean huddling time that the monkeys displayed per hour (s/h). (D) The x-axis represents the mean frequencies of stressful events that the monkeys experienced per hour (f/h). The y-axis represents the mean hair cortisol levels (μg/dl).
Figure 4
Figure 4. Differences between control monkeys and depressed monkeys.
(A) On the x-axis, individuals are divided into control monkeys (n = 18) and depressed monkeys (n = 23). The y-axis represents the monkeys’ ages (years). (B) On the x-axis, individuals are divided into control monkeys (n = 18) and depressed monkeys (n = 23). The y-axis represents mean frequencies of stressful events that the monkeys experienced per hour (f/h). (C) On the x-axis, individuals are divided into control monkeys (n = 18) and depressed monkeys (n = 23). The y-axis represents the mean frequencies of non-stressful events that the monkeys experienced per hour (f/h). (D) On the x-axis, individuals are divided into control monkeys (n = 18) and depressed monkeys (n = 23). The y-axis represents the mean levels of hair cortisol (μg/dl).

References

    1. Gruenberg A. M., Goldstein R. D. & Pincus H. A. Classification of Depression: Research and Diagnostic Criteria: DSM-IV and ICD-10. Biology of Depression 1–12 (2005).
    1. Knol M. J. et al. Depression as a risk factor for the onset of type 2 diabetes mellitus. A meta-analysis. Diabetologia 49, 837–845 (2006). - PubMed
    1. Mathers C. D. & Loncar D. Projections of global mortality and burden of disease from 2002 to 2030. PLoS medicine 3, e442–e442 (2006). - PMC - PubMed
    1. Garde K. Depression–gender differences. Ugeskr Laeger 169, 2422–2425 (2007). - PubMed
    1. Burt V. K. & Stein K. Epidemiology of depression throughout the female life cycle. Journal of Clinical Psychiatry 63 Suppl 7, 9–15 (2002). - PubMed

Publication types