. 2016 Jul 21:6:30054.
doi: 10.1038/srep30054.

Dynamics of membrane nanotubes coated with I-BAR

Affiliations

Dynamics of membrane nanotubes coated with I-BAR

Younes F Barooji et al. Sci Rep. .

Abstract

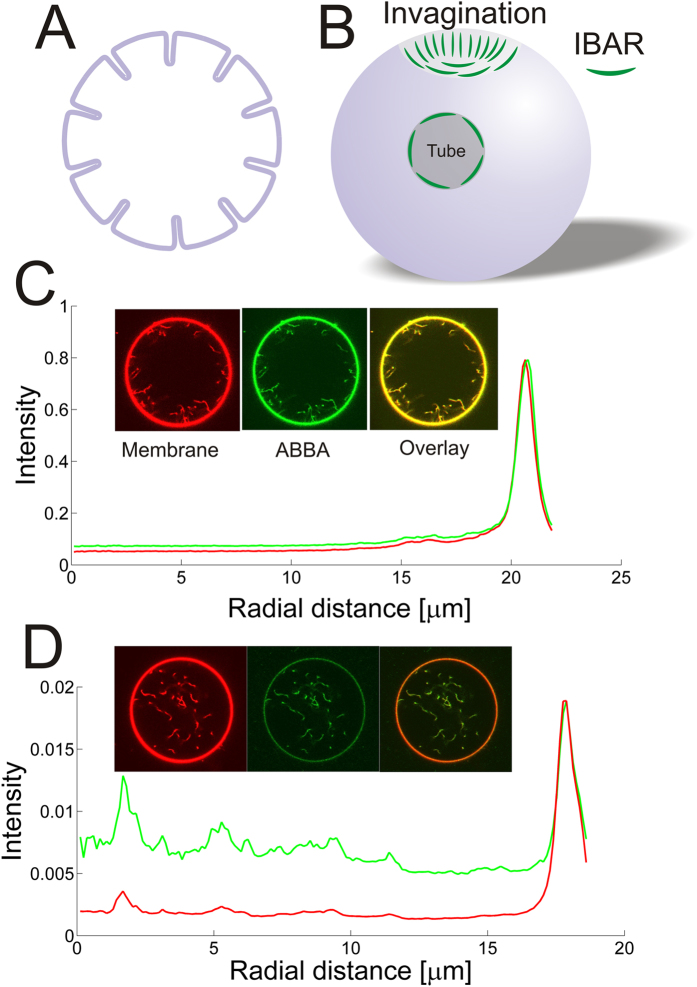
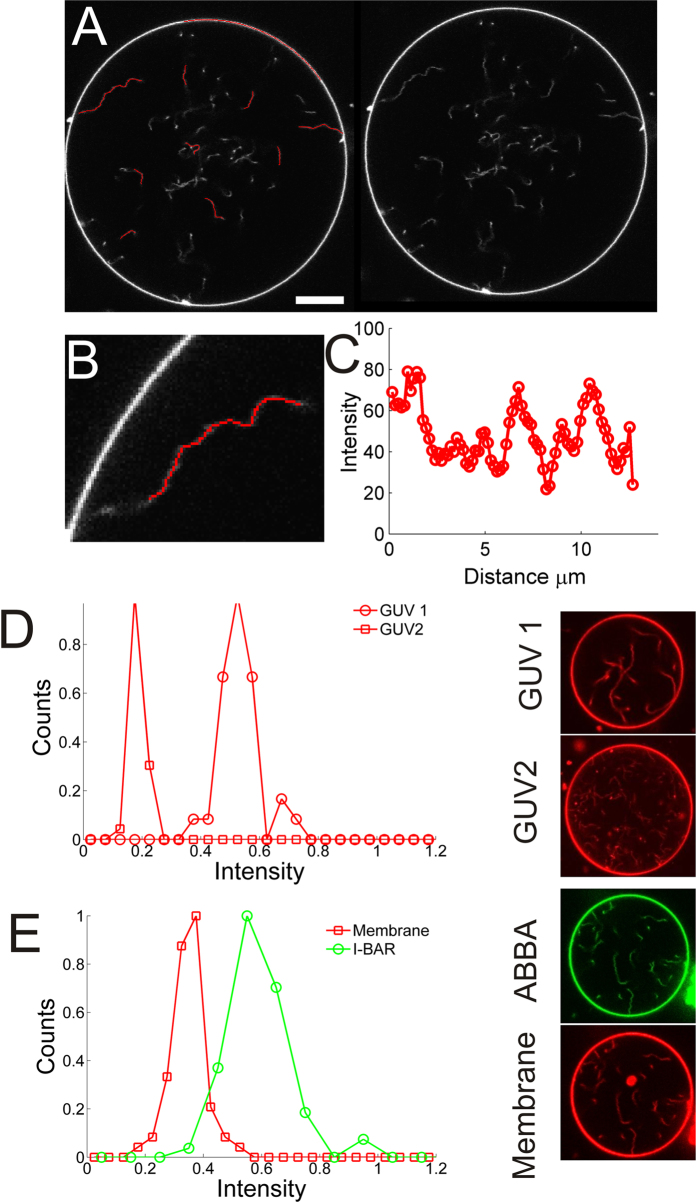
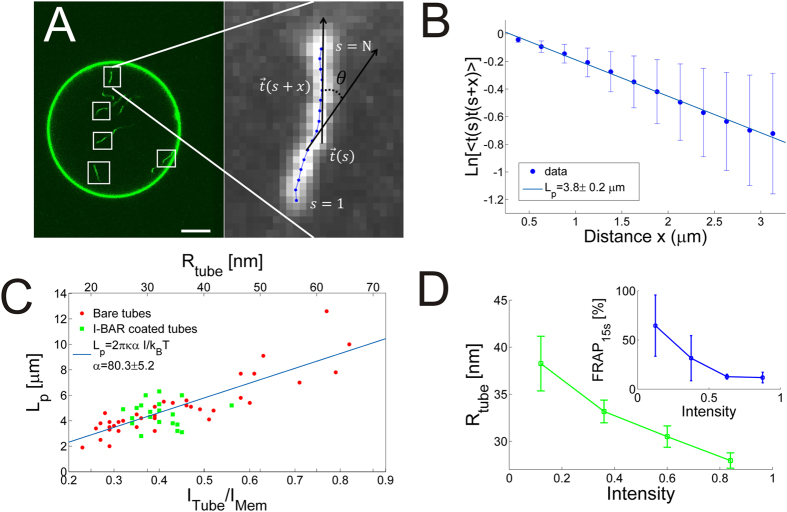
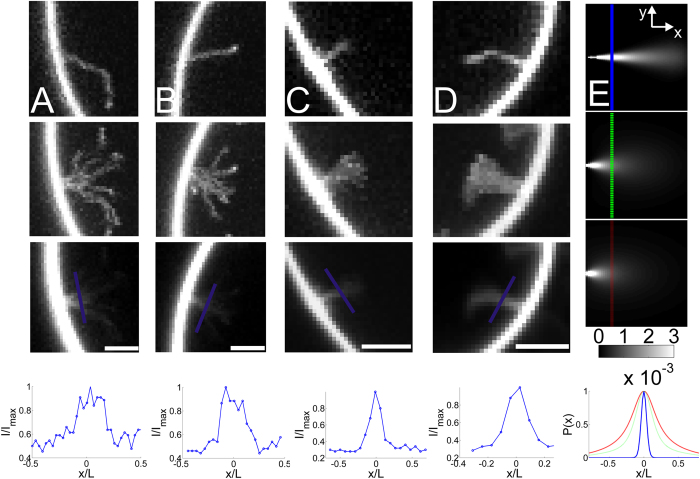
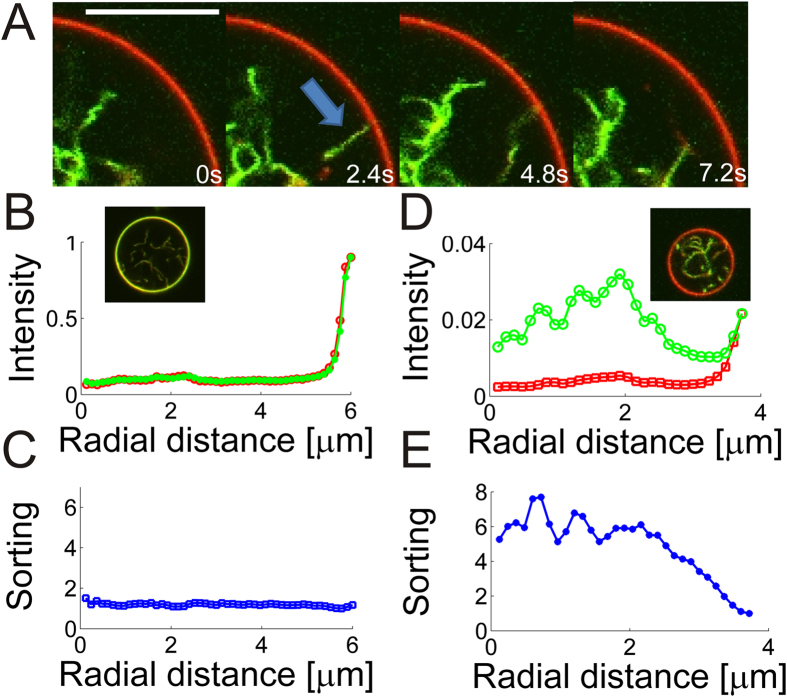
Membrane deformation is a necessary step in a number of cellular processes such as filopodia and invadopodia formation and has been shown to involve membrane shaping proteins containing membrane binding domains from the IRSp53-MIM protein family. In reconstituted membranes the membrane shaping domains can efficiently deform negatively charged membranes into tubules without any other proteins present. Here, we show that the IM domain (also called I-BAR domain) from the protein ABBA, forms semi-flexible nanotubes protruding into Giant Unilamellar lipid Vesicles (GUVs). By simultaneous quantification of tube intensity and tubular shape we find both the diameter and stiffness of the nanotubes. I-BAR decorated tubes were quantified to have a diameter of ~50 nm and exhibit no stiffening relative to protein free tubes of the same diameter. At high protein density the tubes are immobile whereas at lower density the tubes diffuse freely on the surface of the GUV. Bleaching experiments of the fluorescently tagged I-BAR confirmed that the mobility of the tubes correlates with the mobility of the I-BAR on the GUV membrane. Finally, at low density of I-BAR the protein upconcentrates within tubes protruding into the GUVs. This implies that I-BAR exhibits strong preference for negatively curved membranes.


Figures

Figure 1
Figure 1. I-BAR domains from ABBA can form tubes pointing into Giant Unilamellar lipid Vesicles (GUVs) at high density or bind to existing tubes at lower density.
(A,B) Schematic depiction showing I-BAR binding to tubes pointing inwards into the lumen of a GUV. (C) Incubation of a GUV with 2.3 μM I-BAR. Graph shows radial intensity plot of TR-DHPE signal (red) and YFP labeled I-BAR signal (green) from a GUV containing a number of inward pointing tubes as shown by the confocal images. (D) Incubation of a GUV with 290 nM I-BAR. Graph shows radial intensity of TR-DHPE signal (red) and YFP labeled I-BAR signal (green) from a GUV containing a number of inward pointing tubes as shown by the confocal images. Each intensity plotted in (C,D) is the average of all pixels with the same distance to the center of the GUV. The YFP intensities in (C,D) are normalized by the same constant. Membrane composition is DOPC:DOPS:TR-DHPE 59.7:40:0.3.
Figure 2
Figure 2. Examples of how intensities of tube segments are recorded and quantified.
Tube segments transiently diffuse into focus of the confocal microscope. An adaptive filament algorithm was used to track the filaments and extract the intensity while they are in focus. By recording a number of images several different tube segments can be analyzed. (A) A GUV displaying a number of tube segments which are in focus (right panel). Left panel shows the fitted curves (red curves) which overlap with the tube segments which are in focus. The GUV membrane can similarly be quantified using the same strategy. Scale bar, 10 μm. (B) Enlarged image of a tube from (A) with the fitted curve as an overlay (red curve). (C) Intensity profile along the red curve in (B). The portion of the tube which is closest to the microscope focus corresponds to the maximum intensity value and is used in the following quantification of tube intensities. (D) Distribution of the maximum intensities from a number of tube segments from two different GUVs (images of GUV1 and GUV2 are shown to the right). The number of tube segments are Nseg = 31 (GUV1) and Nseg = 33 (GUV2). (E) Distribution of tube intensities from a GUV containing YFP labeled I-BAR coated tubes ([I-BAR] = 2.9 μM). The red squares represent maximum tube intensities from the membrane channel (TR-DHPE) and the green circles corresponds to the equivalent signal from the YFP labeled I-BAR (Nseg = 64). To the right are shown confocal images of the YFP labeled I-BAR (green) and membrane (red). Membrane composition is DOPC:DOPS:TR-DHPE 59.7:40:0.3.
Figure 3
Figure 3. Membrane nanotubes coated with I-BAR domains have uniform widths with well-defined stiffness.
(A) Quantification of tubular shape by finding local tangent vectors is performed on tube segments which are transiently within the focal plane of the microscope. Scale bar, 10 μm. (B) By analyzing the shape of <Nseg> = 92 tube segments from each GUV the average correlation between tangent vectors along the tube segments is found. The slope of the graph equals the persistence length. (C) Persistence lengths versus the intensity ratio between the tube membrane and the GUV membrane. The corresponding radius of the nanotube is found from eq. 2 and plotted in the top axis. Each data point is obtained by analyzing, on average, the shape of 29 tube segments from each GUV. Green data points represent tubes which contain I-BAR bound to the interior of the tubes and red data points represent spontaneous tubes formed in GUVs in absence of I-BAR. Tubes from a total of 59 GUVs were analyzed and the intensity distributions had an average width of 17.0% of the mean. (D) Tubule width as a function of intensity of YFP labeled I-BAR. Inset shows the relative recovery after 15s, following photo bleaching of spot on the GUV membrane, as a function of intensity of YFP labeled I-BAR on the GUV membrane. The inset graph shows binned data from 21 FRAP experiments, error bars denote the standard deviation. Membrane composition DOPC:DOPS:TR-DHPE 59.7:40:0.3.
Figure 4
Figure 4. Short membrane nanotubes coated with high density of I-BAR are semi-flexible with Lp ~L and do not move laterally on the GUV membrane.
(A) From top to bottom panel, (i) example of a tube fixed on the GUV membrane (ii) the corresponding maximum projection of the intensity of a series of images of the same tube (iii) the corresponding average intensity from the entire time series and (iv) line profile parallel to the GUV membrane at a distance corresponding to L/3 from the GUV membrane. (B–D) More examples of short tubes plotted in the same sequence as in (A). (E) Theoretical calculation of the probability of a fluctuating rod which is fixed at one end. Top image shows a rod which has Lp/L = 20, in the middle image Lp/L = 1.7 and in the bottom image Lp/L = 0.7. x and y axes range from 0 to L and –L to L, respectively. The graph below the images corresponds to line profiles along the depicted lines in the three images, Lp/L = 20 (blue), Lp/L = 1.7 (green) and Lp/L = 0.7 (red). All images in (A–D) present intensities from YFP labeled I-BAR. Membrane composition DOPC:DOPS:TR-DHPE 59.7:40:0.3. The figure shows representative examples of the (Nshort > 100) short tubes observed in this work. All scale bars are 2 μm.
Figure 5
Figure 5. Membrane curvature sensing by I-BAR depends on protein density on the membrane.
(A) Overlay of the membrane (red) and YFP labeled I-BAR (green) showing higher intensity of the protein inside the highly curved tube than on the nearly flat GUV membrane. The arrow shows an example of a tube connected with the GUV membrane. In subsequent images the tube disappears due to high mobility of the tube at low protein density. Protein concentration in solution is 290 nM. Scale bar, 10 μm. (B) Radial intensity of the membrane and YFP signal in a GUV incubated with YFP labeled I-BAR [I-BAR] = 2.3 μM. (C) Protein sorting as a function of distance from the center of the GUV. Sorting is defined as the ratio between the protein density on the tube and on the GUV membrane which can be calculated by using eq. 4. (D) Example of radial intensity at lower density of [I-BAR] = 290 nM. (E) Corresponding sorting of the signals presented in (D). Each intensity plotted in (B,D) is the average of all pixels with the same distance to the center of the GUV. Confocal images in (B,D) show the overlay of the protein (green) and membrane (red). Membrane composition DOPC:DOPS:TR-DHPE 59.7:40:0.3. Data were recorded for 15 GUVs incubated with 290 nM of YFP labeled I-BAR and all showed similar level of sorting. At micromolar concentrations of the protein we never detected any sorting (N = 59 GUVs).

References

    1. Doherty G. J. & McMahon H. T. Mechanisms of endocytosis. Annu. Rev. Biochem. 78, 857–902 (2009). - PubMed
    1. Scholey J. M., Brust-Mascher I. & Mogilner A. Cell division. Nature 422, 746–752 (2003). - PubMed
    1. Leijsne N., Oddershede L. B. & Bendix P. M. An updated view at actin dynamics within filopodia. Cytoskeleton 72, 71–79 (2015). - PubMed
    1. Mattila P. K. & Lappalainen P. Filopodia: molecular architecture and cellular functions. Nat. Rev. Mol. Cell Biol. 9, 446–454 (2008). - PubMed
    1. Lowery L. A. & Van Vactor D. The trip of the tip: understanding the growth cone machinery. Nat. Rev. Mol. Cell Biol. 10, 332–343 (2009). - PMC - PubMed

Publication types

LinkOut - more resources