

Boosting the discriminatory power of sparse survival models via optimization of the concordance index and stability selection
- PMID: 27444890
- PMCID: PMC4957316
- DOI: 10.1186/s12859-016-1149-8
Boosting the discriminatory power of sparse survival models via optimization of the concordance index and stability selection
Abstract
Background: When constructing new biomarker or gene signature scores for time-to-event outcomes, the underlying aims are to develop a discrimination model that helps to predict whether patients have a poor or good prognosis and to identify the most influential variables for this task. In practice, this is often done fitting Cox models. Those are, however, not necessarily optimal with respect to the resulting discriminatory power and are based on restrictive assumptions. We present a combined approach to automatically select and fit sparse discrimination models for potentially high-dimensional survival data based on boosting a smooth version of the concordance index (C-index). Due to this objective function, the resulting prediction models are optimal with respect to their ability to discriminate between patients with longer and shorter survival times. The gradient boosting algorithm is combined with the stability selection approach to enhance and control its variable selection properties.
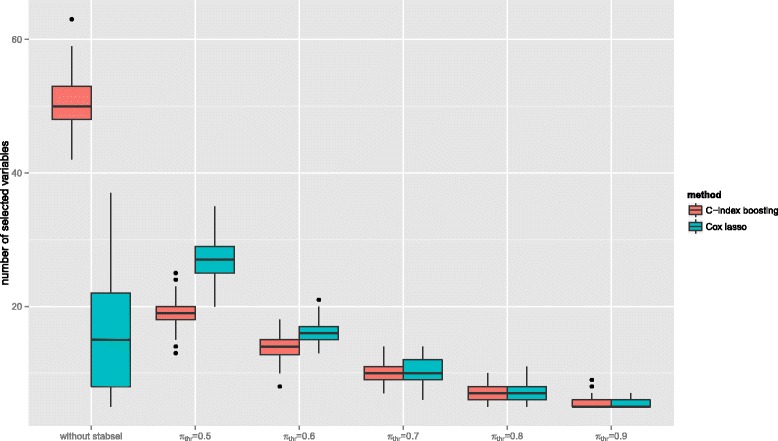
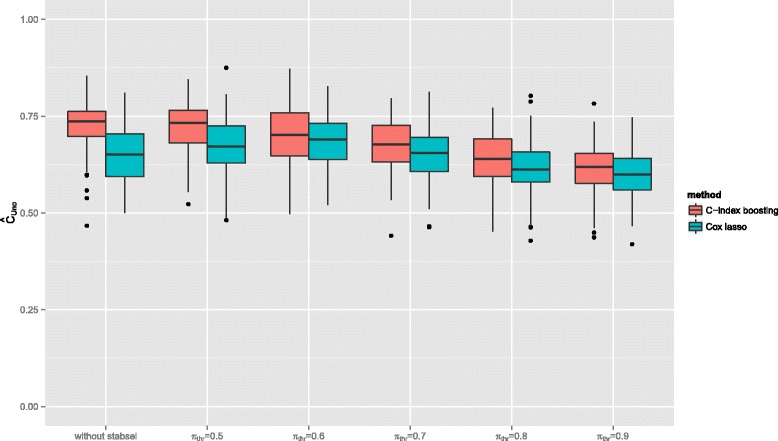
Results: The resulting algorithm fits prediction models based on the rankings of the survival times and automatically selects only the most stable predictors. The performance of the approach, which works best for small numbers of informative predictors, is demonstrated in a large scale simulation study: C-index boosting in combination with stability selection is able to identify a small subset of informative predictors from a much larger set of non-informative ones while controlling the per-family error rate. In an application to discover biomarkers for breast cancer patients based on gene expression data, stability selection yielded sparser models and the resulting discriminatory power was higher than with lasso penalized Cox regression models.
Conclusion: The combination of stability selection and C-index boosting can be used to select small numbers of informative biomarkers and to derive new prediction rules that are optimal with respect to their discriminatory power. Stability selection controls the per-family error rate which makes the new approach also appealing from an inferential point of view, as it provides an alternative to classical hypothesis tests for single predictor effects. Due to the shrinkage and variable selection properties of statistical boosting algorithms, the latter tests are typically unfeasible for prediction models fitted by boosting.
Keywords: Boosting; Concordance index; High-dimensional data; Stability selection; Time-to-event data; Variable selection.
Figures
Similar articles
-
Randomized boosting with multivariable base-learners for high-dimensional variable selection and prediction.BMC Bioinformatics. 2021 Sep 16;22(1):441. doi: 10.1186/s12859-021-04340-z. BMC Bioinformatics. 2021. PMID: 34530737 Free PMC article.
-
Boosting the concordance index for survival data--a unified framework to derive and evaluate biomarker combinations.PLoS One. 2014 Jan 6;9(1):e84483. doi: 10.1371/journal.pone.0084483. eCollection 2014. PLoS One. 2014. PMID: 24400093 Free PMC article.
-
Controlling false discoveries in high-dimensional situations: boosting with stability selection.BMC Bioinformatics. 2015 May 6;16:144. doi: 10.1186/s12859-015-0575-3. BMC Bioinformatics. 2015. PMID: 25943565 Free PMC article.
-
Empirical extensions of the lasso penalty to reduce the false discovery rate in high-dimensional Cox regression models.Stat Med. 2016 Jul 10;35(15):2561-73. doi: 10.1002/sim.6927. Epub 2016 Mar 10. Stat Med. 2016. PMID: 26970107 Review.
-
Extending statistical boosting. An overview of recent methodological developments.Methods Inf Med. 2014;53(6):428-35. doi: 10.3414/ME13-01-0123. Epub 2014 Aug 12. Methods Inf Med. 2014. PMID: 25112429 Review.
Cited by
-
Probing for Sparse and Fast Variable Selection with Model-Based Boosting.Comput Math Methods Med. 2017;2017:1421409. doi: 10.1155/2017/1421409. Epub 2017 Jul 31. Comput Math Methods Med. 2017. PMID: 28831289 Free PMC article.
-
Machine learning algorithms for identifying predictive variables of mortality risk following dementia diagnosis: a longitudinal cohort study.Sci Rep. 2023 Jun 10;13(1):9480. doi: 10.1038/s41598-023-36362-3. Sci Rep. 2023. PMID: 37301891 Free PMC article.
-
Development of a novel lipid metabolism-based risk score model in hepatocellular carcinoma patients.BMC Gastroenterol. 2021 Feb 12;21(1):68. doi: 10.1186/s12876-021-01638-3. BMC Gastroenterol. 2021. PMID: 33579192 Free PMC article.
-
Randomized boosting with multivariable base-learners for high-dimensional variable selection and prediction.BMC Bioinformatics. 2021 Sep 16;22(1):441. doi: 10.1186/s12859-021-04340-z. BMC Bioinformatics. 2021. PMID: 34530737 Free PMC article.
-
An Update on Statistical Boosting in Biomedicine.Comput Math Methods Med. 2017;2017:6083072. doi: 10.1155/2017/6083072. Epub 2017 Aug 2. Comput Math Methods Med. 2017. PMID: 28831290 Free PMC article. Review.
References
Publication types
MeSH terms
Substances
LinkOut - more resources
Full Text Sources
Other Literature Sources
