. 2016 Jul 26;134(4):270-85.
doi: 10.1161/CIRCULATIONAHA.116.021803.

Aptamer-Based Proteomic Profiling Reveals Novel Candidate Biomarkers and Pathways in Cardiovascular Disease

Affiliations

Aptamer-Based Proteomic Profiling Reveals Novel Candidate Biomarkers and Pathways in Cardiovascular Disease

Debby Ngo et al. Circulation. .

Abstract

Background: Single-stranded DNA aptamers are oligonucleotides of ≈50 base pairs in length selected for their ability to bind proteins with high specificity and affinity. Emerging DNA aptamer-based technologies may address limitations of existing proteomic techniques, including low sample throughput, which have hindered proteomic analyses of large cohorts.

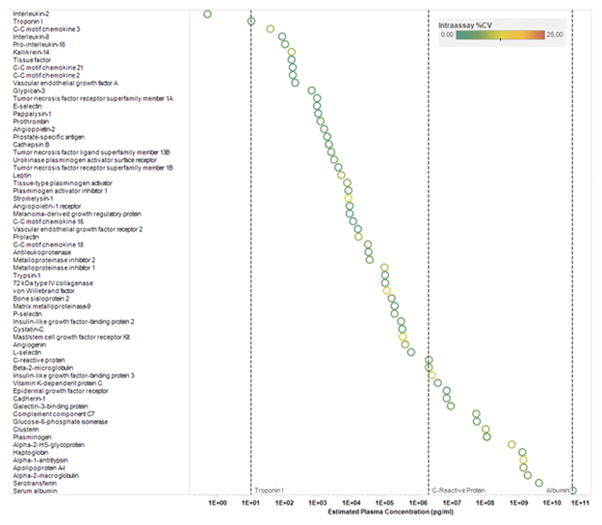
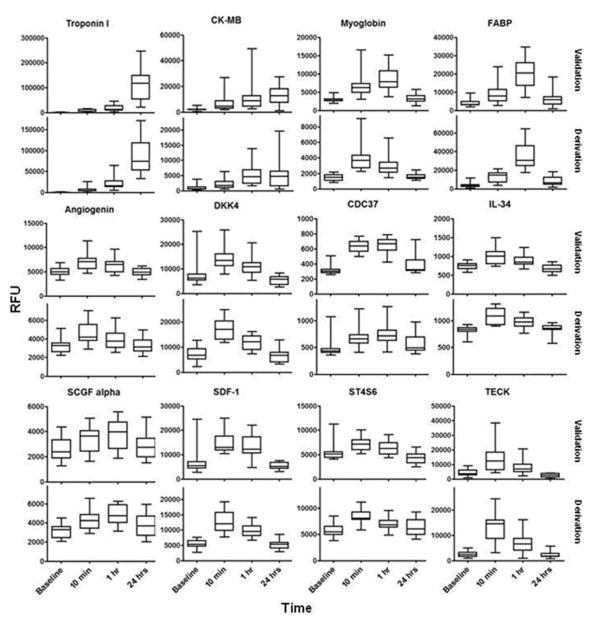
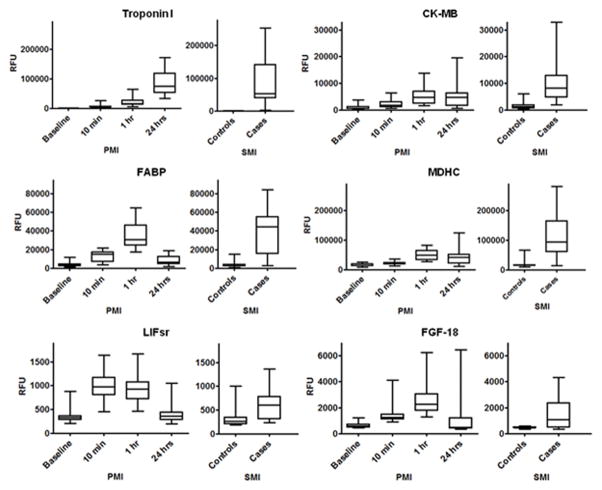
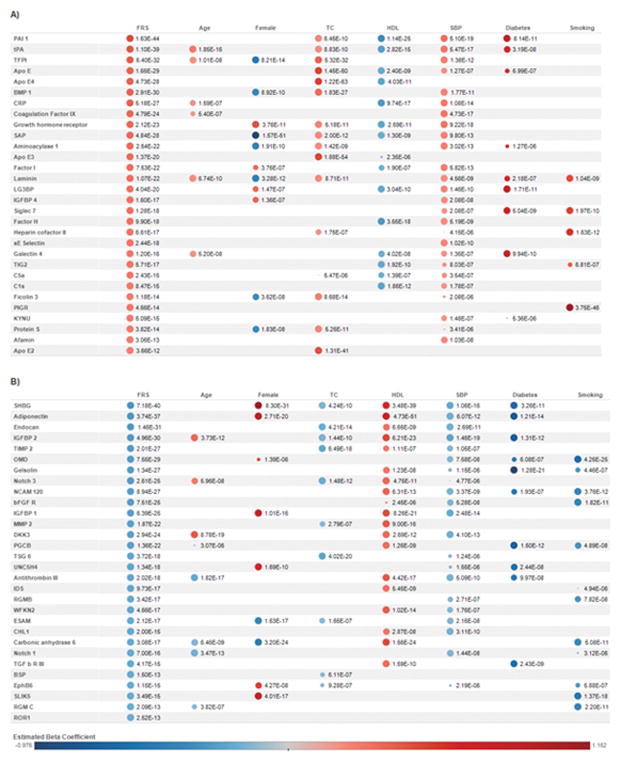
Methods: To identify early biomarkers of myocardial injury, we applied an aptamer-based proteomic platform that measures 1129 proteins to a clinically relevant perturbational model of planned myocardial infarction (PMI), patients undergoing septal ablation for hypertrophic cardiomyopathy. Blood samples were obtained before and at 10 and 60 minutes after PMI, and protein changes were assessed by repeated-measures analysis of variance. The generalizability of our PMI findings was evaluated in a spontaneous myocardial infarction cohort (Wilcoxon rank-sum). We then tested the platform's ability to detect associations between proteins and Framingham Risk Score components in the Framingham Heart Study, performing regression analyses for each protein versus each clinical trait.

Results: We found 217 proteins that significantly changed in the peripheral vein blood after PMI in a derivation cohort (n=15; P<5.70E-5). Seventy-nine of these proteins were validated in an independent PMI cohort (n=15; P<2.30E-4); >85% were directionally consistent and reached nominal significance. We detected many protein changes that are novel in the context of myocardial injury, including Dickkopf-related protein 4, a WNT pathway inhibitor (peak increase 124%, P=1.29E-15) and cripto, a growth factor important in cardiac development (peak increase 64%, P=1.74E-4). Among the 40 validated proteins that increased within 1 hour after PMI, 23 were also elevated in patients with spontaneous myocardial infarction (n=46; P<0.05). Framingham Heart Study analyses revealed 156 significant protein associations with the Framingham Risk Score (n=899), including aminoacylase 1 (β=0.3386, P=2.54E-22) and trigger factor 2 (β=0.2846, P=5.71E-17). Furthermore, we developed a novel workflow integrating DNA-based immunoaffinity with mass spectrometry to analytically validate aptamer specificity.

Conclusions: Our results highlight an emerging proteomics tool capable of profiling >1000 low-abundance analytes with high sensitivity and high precision, applicable both to well-phenotyped perturbational studies and large human cohorts, as well.

Keywords: aptamer, nucleotides; cardiovascular diseases; mass spectrometry; myocardial infarction; proteomics.


Figures

Figure 1
Figure 1. Intra-assay CVs of selected proteins
Data represent intra-assay CVs of selected proteins across a broad range of plasma concentrations. Proteins are sorted by increasing plasma concentration reference range (http://www.plasmaproteome.org/plasmaframes.htm). The color of the circle represents intra-assay CV as denoted in the key above. See Supplemental Table 1 for full protein names, Entrez Gene symbol/ID and UniProt ID.
Figure 2
Figure 2. Protein markers that are increased early after the onset of myocardial injury in peripheral blood
Data from selected proteins that increased in both derivation and validation cohorts [(P < 5.70E-05 in derivation cohort (n=15) and P < 2.30E-04 in validation cohort (n=15)]. P calculated by one-way ANOVA performed on log transformed RFU values. Edges of boxes denote 25th and 75th percentiles, lines denote median, whiskers denote minimum and maximum values. See Supplemental Table 1 for full protein names, Entrez Gene symbol/ID and UniProt ID. RFU: relative fluorescent units.
Figure 3
Figure 3. Proteins increased during planned and spontaneous myocardial injury
Representative proteins that increased in PMI derivation and validation cohorts and an independent SMI cohort. PMI data shown from validation cohort (n=15; P < 2.30E-04; one-way ANOVA on log RFU values). SMI cohort (n=23 cases and 23 controls, P < 1.25E-03; Wilcoxon rank-sum on log RFU values). Edges of boxes denote 25th and 75th percentiles, lines denote median, whiskers minimum and maximum values. See Supplemental Table 1 for full protein names, Entrez Gene symbol/ID and UniProt ID. RFU: relative fluorescent units.
Figure 4
Figure 4. Top protein associations with the Framingham Risk Score (FRS) and component clinical traits
Shown are the top 30 proteins with positive (Panel A) and negative (Panel B) associations. Within groups of positive/negative associations, proteins are sorted by ascending P. Estimated beta coefficients and P were generated from age- and sex- adjusted regression analyses of each protein (log transformed then standardized) with FRS and clinical traits (standardized). The size of the circles corresponds to P (larger circles represent smaller P). Protein-trait associations with P > 5.54E-06 were not represented by circles. The color of the circles represents estimated beta coefficients as denoted in the key above. Abbreviations: FRS: Framingham Risk Score, TC: total cholesterol, HDL: high-density lipoprotein, SBP: systolic blood pressure. Diabetes and current smoking status were categorical variables. See Supplemental Table 1 for full protein names, Entrez Gene symbol/ID and UniProt ID.
Figure 5
Figure 5
Figure 5a. Aptamers bind their cognate proteins spiked into plasma Proteins were spiked into plasma in the absence (top panel) or presence (bottom panel) of biotinylated aptamers bound to streptavidin bead. Following elution and digestion of the affinity enriched sample, LC-MRM-MS analysis was performed. Shown are MS signal intensities for peptides unique to eight proteins in the study that were extracted from the total ion chromatogram. Figure 5b. Response curves for ERBB1, PSA and Annexin A1 spiked into plasma. Measured protein concentrations are compared to the expected concentrations based on the observed ratio of analyte peptide from spiked protein standard to heavy isotope labeled standard. Limits of detection (LODs) were determined for each of the three selected transitions for the proteins. Calibration curves were prepared by method of standard addition in plasma, enriched using a multiplex of 29 aptamers, digested with trypsin and quantified by LC-MRM-MS using heavy isotope labeled standards for selected peptides as described in Supplemental Methods. Regression analysis was performed and the slope and the x-intercept were used to estimate the relative recovery and lower limit of detection (LLOD) respectively (see Supplemental Methods and Supplemental Tables 19 and 20). Response was linear over 3 orders of concentration for all peptides, and LODs were in the range of 10’s to 100’s of amol/uL except in cases where the endogenous protein was present at sufficiently high levels and caused an earlier plateau in response as was observed for ERBB1. Figure 5c. Demonstration of aptamers binding endogenous protein (ERBB1) MS response of fragment-ion transitions monitored for three peptides unique to ERBB1 are plotted for plasma samples containing protein standards enriched using SA beads without aptamers (column 1), and with aptamers in the absence (column 2) or presence (column 3) of the added protein standard. The peak areas of co-eluting fragment-ion transitions in the same retention time window are designated by color (Supplemental Table 17). The relative intensities of the fragment ions for each peptide observed in the positive control (protein standards and aptamer added), and the patient plasma samples without exogenous protein added, confirms the identification and detection of these peptides and of endogenous ERBB1 in patient plasma using aptamer affinity enrichment. See Supplemental Methods for details of sample handling, affinity enrichment, elution, digestion and MS analysis.
Figure 5
Figure 5
Figure 5a. Aptamers bind their cognate proteins spiked into plasma Proteins were spiked into plasma in the absence (top panel) or presence (bottom panel) of biotinylated aptamers bound to streptavidin bead. Following elution and digestion of the affinity enriched sample, LC-MRM-MS analysis was performed. Shown are MS signal intensities for peptides unique to eight proteins in the study that were extracted from the total ion chromatogram. Figure 5b. Response curves for ERBB1, PSA and Annexin A1 spiked into plasma. Measured protein concentrations are compared to the expected concentrations based on the observed ratio of analyte peptide from spiked protein standard to heavy isotope labeled standard. Limits of detection (LODs) were determined for each of the three selected transitions for the proteins. Calibration curves were prepared by method of standard addition in plasma, enriched using a multiplex of 29 aptamers, digested with trypsin and quantified by LC-MRM-MS using heavy isotope labeled standards for selected peptides as described in Supplemental Methods. Regression analysis was performed and the slope and the x-intercept were used to estimate the relative recovery and lower limit of detection (LLOD) respectively (see Supplemental Methods and Supplemental Tables 19 and 20). Response was linear over 3 orders of concentration for all peptides, and LODs were in the range of 10’s to 100’s of amol/uL except in cases where the endogenous protein was present at sufficiently high levels and caused an earlier plateau in response as was observed for ERBB1. Figure 5c. Demonstration of aptamers binding endogenous protein (ERBB1) MS response of fragment-ion transitions monitored for three peptides unique to ERBB1 are plotted for plasma samples containing protein standards enriched using SA beads without aptamers (column 1), and with aptamers in the absence (column 2) or presence (column 3) of the added protein standard. The peak areas of co-eluting fragment-ion transitions in the same retention time window are designated by color (Supplemental Table 17). The relative intensities of the fragment ions for each peptide observed in the positive control (protein standards and aptamer added), and the patient plasma samples without exogenous protein added, confirms the identification and detection of these peptides and of endogenous ERBB1 in patient plasma using aptamer affinity enrichment. See Supplemental Methods for details of sample handling, affinity enrichment, elution, digestion and MS analysis.

Comment in

References

    1. Keshishian H, Burgess MW, Gillette MA, Mertins P, Clauser KR, Mani DR, Kuhn EW, Farrell LA, Gerszten RE, Carr SA. Multiplexed, quantitative workflow for sensitive biomarker discovery in plasma yields novel candidates for early myocardial injury. Molecular & cellular proteomics: MCP. 2015;14:2375–2393. - PMC - PubMed
    1. Addona TA, Shi X, Keshishian H, Mani DR, Burgess M, Gillette MA, Clauser KR, Shen D, Lewis GD, Farrell LA, Fifer MA, Sabatine MS, Gerszten RE, Carr SA. A pipeline that integrates the discovery and verification of plasma protein biomarkers reveals candidate markers for cardiovascular disease. Nature biotechnology. 2011;29:635–643. - PMC - PubMed
    1. Wang H, Hanash S. Mass spectrometry based proteomics for absolute quantification of proteins from tumor cells. Methods. 2015;81:34–40. - PMC - PubMed
    1. Zhang S, Mercado-Uribe I, Hanash S, Liu J. Itraq-based proteomic analysis of polyploid giant cancer cells and budding progeny cells reveals several distinct pathways for ovarian cancer development. PloS one. 2013;8:e80120. - PMC - PubMed
    1. Yin X, Subramanian S, Hwang SJ, O’Donnell CJ, Fox CS, Courchesne P, Muntendam P, Gordon N, Adourian A, Juhasz P, Larson MG, Levy D. Protein biomarkers of new-onset cardiovascular disease: Prospective study from the systems approach to biomarker research in cardiovascular disease initiative. Arteriosclerosis, thrombosis, and vascular biology. 2014;34:939–945. - PMC - PubMed

Publication types

MeSH terms