. 2016 Jul 22:6:30323.
doi: 10.1038/srep30323.

Familial bias and auditory feedback regulation of vocal babbling patterns during early song development

Affiliations

Familial bias and auditory feedback regulation of vocal babbling patterns during early song development

Daisuke Sato et al. Sci Rep. .

Abstract

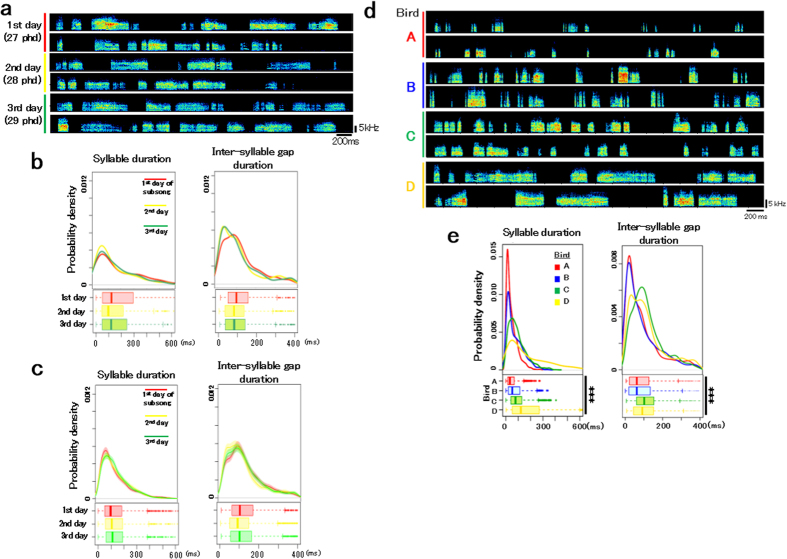
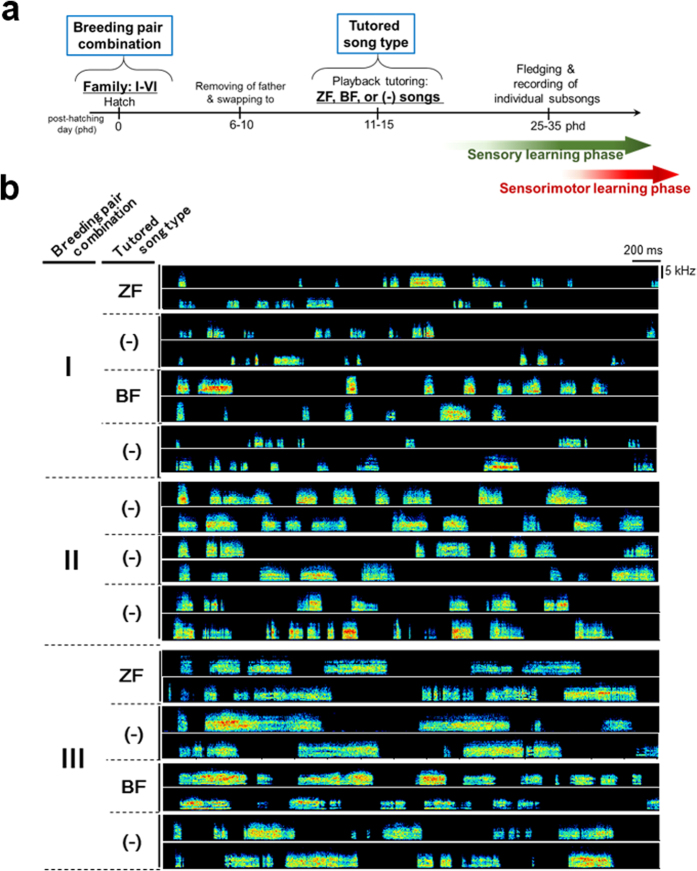
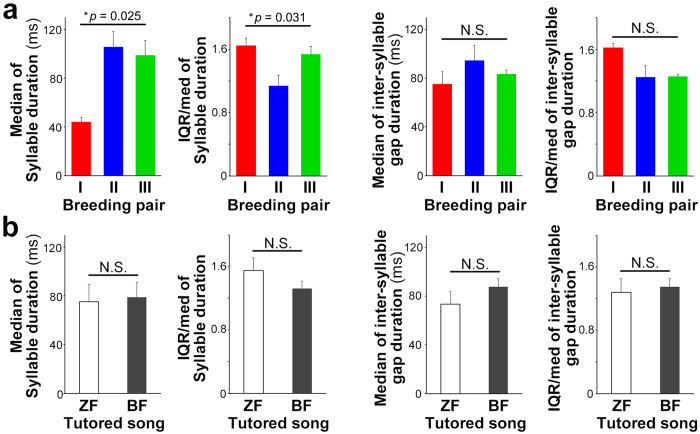
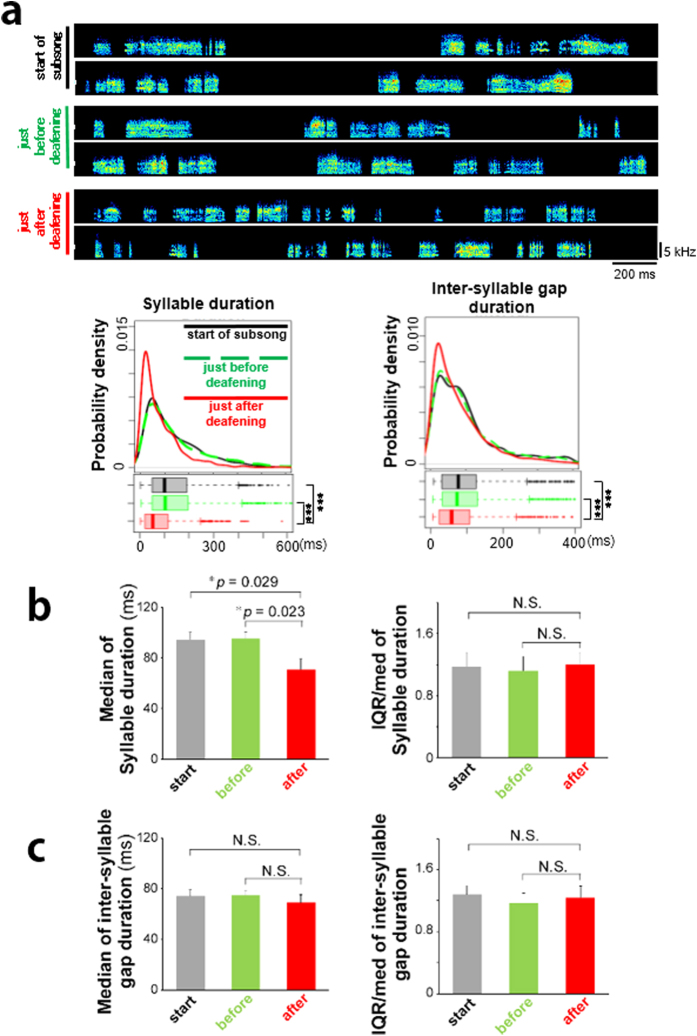
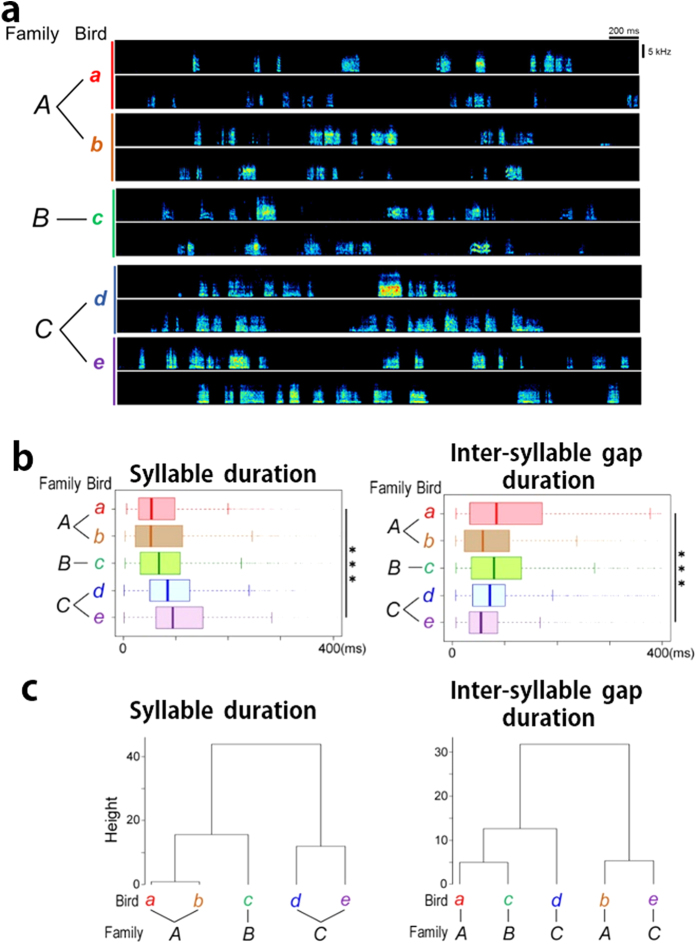
Learned vocalizations are a crucial acoustic biosignal conveying individual traits in many species. Songbirds learn song patterns by listening to a tutor song and performing vocal practice during a sensitive developmental period. However, when and how individual differences in song patterns develop remain unknown. Here, we report that individual differences in vocal output exist even at the earliest song development stage, called subsong. Experiments involving the manipulation of both breeding pairs and song tutoring conditions revealed that the parental pair combination contributes to generating familial differences in syllable duration and variability in the subsong of offspring. Furthermore, after deafening, juveniles immediately changed their subsong by shortening the syllable durations but maintained the individual variability of their subsong temporal patterns, suggesting both auditory-sensitive modification and independent intrinsic regulation of vocal output. These results indicate that the temporal patterns of subsong are not merely disordered vocalization but are regulated by familial bias with sensitivity to auditory feedback, thus generating individual variability at the initiation of vocal development.


Figures

Figure 1
Figure 1. Consistency and individual differences in the subsong temporal patterns of zebra finches.
(a) An example of subsong during three consecutive days after the onset of subsong in a zebra finch male. (b) Temporal patterns of the same bird (a) on each of the three days. Distribution of probability densities (upper box) and boxplot (lower box) of the syllable and inter-syllable gap durations. (c) Average temporal pattern distributions of subsong on three consecutive days after the onset of subsong (n = 4 birds). Shaded areas in the distribution of probability density indicate 95% confidence interval. (d) Examples of individual differences in the subsong pattern on the first day of subsong singing in four juvenile zebra finch males (n = 4 birds each from four different families). (e) Distribution of the probability densities of the syllable and inter-syllable gap durations of subsongs in the four juveniles shown in panel (d). (1,200 syllables/bird from initial subsong production; ***p < 2.2e-16 for the duration of syllables and inter-syllable gaps, Kruskal-Wallis test). In the box plots shown in (b,c,e), the edges of boxes indicate the upper- and lower-quartile of each group, respectively. The whiskers indicate the most extreme data point that is no more than 1.5 times the inter-quartile range from the box. Dots indicate the outliers.
Figure 2
Figure 2. Subsongs of juvenile zebra finches reared with tutoring manipulation.
(a) Outline of the experiment with tutoring manipulation. (b) Examples of subsongs from juvenile zebra finches reared under the experimental combinations described above from breeding families I, II, and III. ZF, BF, and (−) mean playback conditions with zebra finch songs, Bengalese finch songs, and no song tutoring, respectively.
Figure 3
Figure 3. Familial breeding pair bias in temporal patterns of subsongs in offspring.
(a) Differences in the median and IQR/median of the subsong syllable duration, but not the inter-syllable gap duration of non-tutored juveniles among breeding pairs (n = 4, 6, 4 from breeding pair I, II, and II, respectively) (*p = 0.025 and 0.031 for the median and IQR/median of the subsong syllable duration, respectively. p = 0.632 and 0.185 for the median and IQR/median of the inter-syllable gap duration, respectively. One-factor ANOVA). Error bars: s.e.m. (b) No significant differences in the median and IQR/median of the duration of subsong syllables and inter-syllable gaps between ZF and BF song tutoring juveniles (n = 5 and 6, respectively) (p = 0.845 and 0.235, the median and IQR/median of the subsong syllable duration, respectively. p = 0.272 and 0.717 for the median and IQR/median of the inter-syllable gap duration, respectively. Student’s t-test). Error bars: s.e.m.
Figure 4
Figure 4. Effect of deafening on the temporal patterns of subsong and persistent individual differences of subsong patterns after deafening.
(a: upper) An example of subsong of a juvenile zebra finch at 33 phd, just before deafening at 34 phd, and just after deafening at 36 phd. (a: bottom) Temporal patterns of the same bird (a) on each day. Distributions of the probability density (upper box) and boxplot (lower box) (***p < 1.0e-5: Wilcoxon signed-rank test). (b) Median and IQR/median of the syllable duration in subsongs (n = 5 birds) during the start of subsong (black), before deafening (green), and after deafening (red). (*p = 0.029 and 0.023: paired t-test after Holm’s correction). Error bars: s.e.m. (c) Median and IQR/median of the inter-syllable gap duration in subsongs (n = 5 birds) during the start of subsong (black), before deafening (green), and after deafening (red). Error bars: s.e.m.
Figure 5
Figure 5. Persistent individual variability of subsong temporal patterns after deafening.
(a) Examples of subsong of the deafened juvenile zebra finches (n = 5 from three different breeding pairs). Birds “a and b” and “d and e” were siblings from two different breeding families A and C, respectively. (b) Temporal patterns of subsongs of the five birds after deafening shown in (a). Distributions of the probability density (upper box) and boxplot (lower box) (***p < 2.2e-16, Kruskal-Wallis test). (c) Hierarchical Cluster analyses calculating the Euclidean distance of the value of median and IQR/med of the duration of syllable and inter-syllable gap of subsongs of the deafened juveniles.

Similar articles

Cited by

References

    1. Marler P. & Slabbekoorn H. Nature’s Music: The Science of Birdsong (Elsevier Academic Press, 2004).
    1. Immelmann K. In Bird Vocalizations (ed Hinde R. A.) 61–74 (Cambridge University Press, 1969).
    1. Zann R. The Zebra Finch: A Synthesis of Field and Laboratory Studies (Oxford University Press, 1996).
    1. Aronov D., Andalman A. S. & Fee M. S. A specialized forebrain circuit for vocal babbling in the juvenile songbird. Science 320, 630–634, doi: 10.1126/science.1155140 (2008). - DOI - PubMed
    1. Goldberg JH F. M. Vocal babbling in songbirds requires the basal ganglia-recipient motor thalamus but not the basal ganglia. J Neurophysiol 105, 2729–2739, doi: 10.1152/jn.00823.2010.-Young (2011). - DOI - PMC - PubMed

Publication types