. 2016 Jul 20;36(29):7676-92.
doi: 10.1523/JNEUROSCI.4201-15.2016.

Spike-Based Functional Connectivity in Cerebral Cortex and Hippocampus: Loss of Global Connectivity Is Coupled to Preservation of Local Connectivity During Non-REM Sleep

Affiliations

Spike-Based Functional Connectivity in Cerebral Cortex and Hippocampus: Loss of Global Connectivity Is Coupled to Preservation of Local Connectivity During Non-REM Sleep

Umberto Olcese et al. J Neurosci. .

Abstract

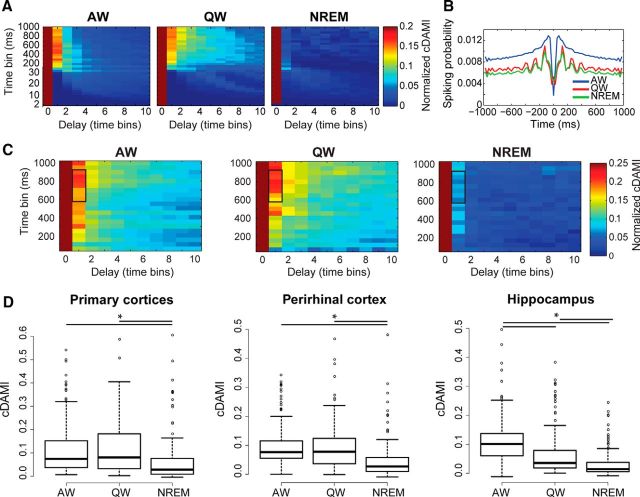
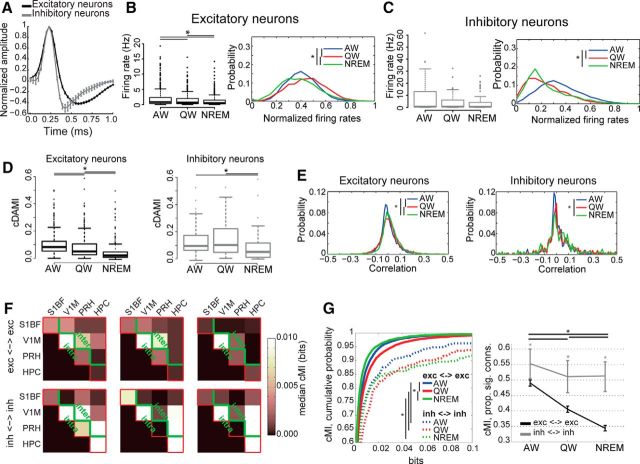
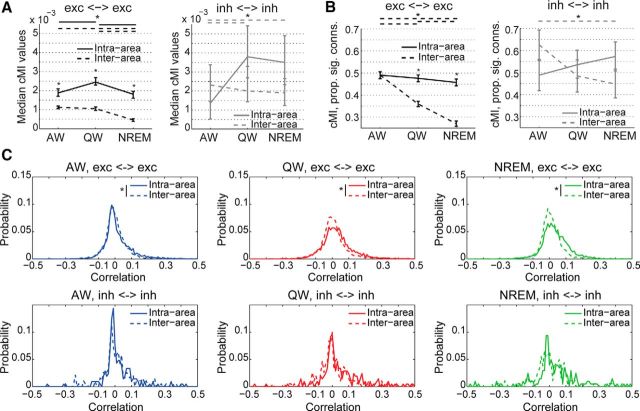
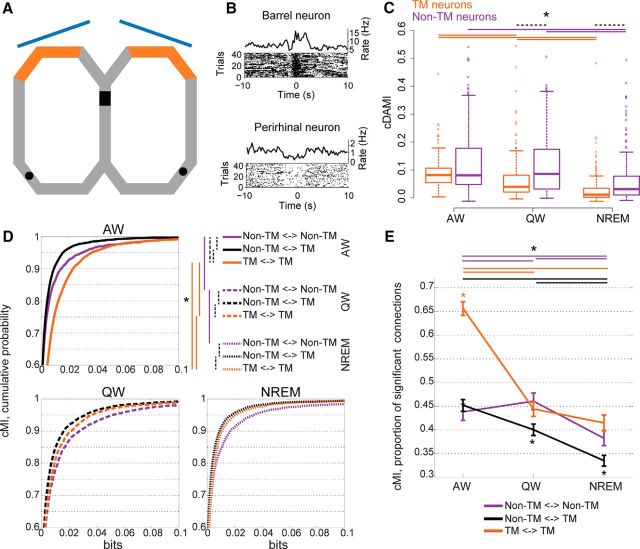
Behavioral states are commonly considered global phenomena with homogeneous neural determinants. However, recent studies indicate that behavioral states modulate spiking activity with neuron-level specificity as a function of brain area, neuronal subtype, and preceding history. Although functional connectivity also strongly depends on behavioral state at a mesoscopic level and is globally weaker in non-REM (NREM) sleep and anesthesia than wakefulness, it is unknown how neuronal communication is modulated at the cellular level. We hypothesize that, as for neuronal activity, the influence of behavioral states on neuronal coupling strongly depends on type, location, and preceding history of involved neurons. Here, we applied nonlinear, information-theoretical measures of functional connectivity to ensemble recordings with single-cell resolution to quantify neuronal communication in the neocortex and hippocampus of rats during wakefulness and sleep. Although functional connectivity (measured in terms of coordination between firing rate fluctuations) was globally stronger in wakefulness than in NREM sleep (with distinct traits for cortical and hippocampal areas), the drop observed during NREM sleep was mainly determined by a loss of inter-areal connectivity between excitatory neurons. Conversely, local (intra-area) connectivity and long-range (inter-areal) coupling between interneurons were preserved during NREM sleep. Furthermore, neuronal networks that were either modulated or not by a behavioral task remained segregated during quiet wakefulness and NREM sleep. These results show that the drop in functional connectivity during wake-sleep transitions globally holds true at the cellular level, but confine this change mainly to long-range coupling between excitatory neurons.

Significance statement: Studies performed at a mesoscopic level of analysis have shown that communication between cortical areas is disrupted in non-REM sleep and anesthesia. However, the neuronal determinants of this phenomenon are not known. Here, we applied nonlinear, information-theoretical measures of functional coupling to multi-area tetrode recordings from freely moving rats to investigate whether and how brain state modulates coordination between individual neurons. We found that the previously observed drop in functional connectivity during non-REM (NREM) sleep can be explained by a decrease in coupling between excitatory neurons located in distinct brain areas. Conversely, intra-area communication and coupling between interneurons are preserved. Our results provide significant new insights into the neuron-level mechanisms responsible for the loss of consciousness occurring in NREM sleep.

Keywords: brain network integration; brain states; functional connectivity; neuronal network analysis; spiking activity; wakefulness and sleep.


Figures

Figure 1.
Figure 1.
Scoring of behavioral states. A, Example LFP traces from one cortical channel (S1BF) recorded during (top to bottom) AW, QW, and NREM. Note the predominance of lower frequencies and higher amplitude during NREM. B, Example single-session power spectra for the LFP channel shown in A during epochs characterized as AW (blue), QW (red), or NREM (green). In NREM, a theta peak is absent, whereas lower frequencies become more prominent. See the Materials and Methods for definitions of all criteria used to score behavioral states. C, Average SWA measured from epochs classified as AW, QW, or NREM, measured from the LFP channel shown in A and B. Note the strong increase during NREM epochs. D, Average total number of ripples reported from all hippocampal channels in each epoch (classified as AW, QW, or NREM). Ripples are mostly present in QW and NREM epochs. E, Example results from the motion tracking algorithm. The animal was either confined in a flower pot (left) or roaming in a figure-8 maze environment. Each blue dot represents the identified animal position in a video frame. F, Average body motion (measured as the average of pixel displacement for frames within single epochs) as a function of behavioral state (classified as AW, QW, or NREM). Motion is mostly confined to AW epochs, with remaining motion in QW and NREM being due to nonlocomotory activity (e.g., grooming) and noise level of the object tracking algorithm. Data are expressed as mean ± SEM. Asterisks in C, D, and F indicate significant differences (p < 0.05, one-way ANOVA followed by post hoc Bonferroni correction).
Figure 2.
Figure 2.
cMI values reflect coordinated firing rate fluctuations between neurons. A, Example normalized firing rates (800 ms bin) for two example neurons (blue and red traces) across the three brain states (left: AW, middle: QW, right: NREM). All epochs classified as AW, QW, or NREM have been collapsed (i.e., drawn adjacent to each other). Firing rates for each neuron have been normalized to the highest firing rate recorded across all brain states. B, Enlarged fragments of the firing rate traces shown in A. C, cMI values for the same example neuronal pair, computed using equispaced amplitude binning as a function of brain state, number of amplitude bins, and temporal bin duration. Each plot corresponds to one behavioral state (left: AW, middle: QW, right: NREM). cMI was computed for time bins of different durations (y-axis, 50 to 1000 ms with a step size of 50 ms) and for different amplitude bins (x-axis, 2 to 50 bins). The black outline indicates the time bins and amplitude bins that were used in all further analyses (time bins: 600–900 ms, amplitude bins: 10–20). The average cMI value in the interval within the black outline is indicated in the header of each subplot. D, Same as C but using equipopulated amplitude binning. White areas indicate ranges with fewer distinct firing rate values than number of bins for which no cMI value was estimated. The average cMI value in the interval within the black outline is indicated in the header of each subplot (time bins: 600–900 ms, amplitude bins: 5–15). Note the similarity between the cMI values computed in C and D (see also Materials and Methods).
Figure 3.
Figure 3.
cMI values vary across behavioral states and are an extension of linear correlation values. A, cMI values between individual neurons measured during a single recording session as a function of behavioral state. Brackets indicate in which brain areas neurons were located. Each row and column represent a single neuron. B, Cumulative distribution plot for cMI values (all pairs of neurons in all brain regions and recording sessions) as a function of brain state (blue: AW, red: QW, green: NREM). Inset, Enlargement of the distributions around the 80th-100th percentiles. Nonparametric testing revealed significant differences between cMI values for all connections between the three behavioral states, with values being the largest for QW and the lowest for NREM (*p < 0.05, Friedman test with post hoc analysis). C, Probability distribution of pairwise “linear” correlation values between trains of binned firing rates for all recorded neurons across brain states (blue: AW, red: QW, green: NREM). Firing rates were computed using an 800 ms time bin. Asterisks indicate significant differences between distributions (p < 0.05, Kolmogorov–Smirnov test with post hoc analysis). D, Scatter plot showing the relationship between the pairwise correlation values of B and the cMI values of C as a function of brain state (blue: AW, red: QW, green: NREM).
Figure 4.
Figure 4.
Functional connectivity between and within brain areas is modulated heterogeneously by behavioral state. A, Average values of cMI for pairs of neurons within S1BF for a single recording session. Each plot corresponds to one behavioral state. cMI has been computed for time bins of different durations (y-axis, 50 to 1000 ms with a step size of 50 ms) and for different amplitude bins (x-axis, 2 to 50 bins). The black outline indicates the time bins and amplitude bins that were used in all further analyses. B, Graphs of median cMI between and within regions as a function of behavioral state. The thickness of each connection is proportional to the cMI between or within a region (rounded to the closest multiple of 1 × 10−3 bits; refer to C for non-approximated values). Absence of a connection indicates a median value not significantly larger than 0 (one-sided Wilcoxon test). Colors indicate the outcome of a Friedman test with post hoc analysis performed separately for each set of connections across behavioral states. Red indicates that a connection was significantly stronger in one or more specific behavioral states than in all others. Blue indicates that a connection was significantly weaker in one or more specific behavioral states than in all others. Black indicates an intermediate value. C, Same as in B, indicating the non-approximated values of median cMI for each connection as a function of the behavioral state. Error bars indicate confidence intervals for the medians. For significant differences across behavioral states, see B. D, Plot indicating the proportion of neuronal pairs for which cMI values are significantly larger than 0 (p < 0.05, based on the distribution of shuffled estimates, see Materials and Methods). Each line corresponds to a specific connection between or within areas. Error bars are bootstrap-estimated confidence intervals (see Materials and Methods). Asterisks indicate significant differences across behavioral states for each type of connection (p < 0.05, bootstrap-estimated).
Figure 5.
Figure 5.
Recurrent connectivity is heterogeneously modulated by behavioral state. A, cDAMI plot for a single example neocortical neuron. Each plot corresponds to one behavioral state. cDAMI has been computed for time bins of different durations (y-axis, 2 to 1000 ms), for different delay bins (x-axis), and for different time bin widths (the duration of one delay bin is equal to the corresponding time bin width given on the y-axis; e.g., a delay of 1 time bin for a time bin width of 600 ms is exactly 600 ms). For each time bin width, cDAMI for delay bins >0 is normalized to the corresponding value with no delay (see Materials and Methods). B, Auto-correlogram (probability of one spike by a neuron being followed or preceded by a spike by the same neuron) for the neuron shown in A computed using a 25 ms bin in the range −1 to 1 s for each behavioral state (blue: AW, red: QW, green: NREM). C, Average values of cDAMI across neurons in the barrel cortex for a single recording session. Each plot corresponds to one behavioral state. cDAMI has been computed as described for A (for time bins ranging between 50 and 1000 ms). The black outline indicates the values of time bins and delays that were used in all further analyses. D, Boxplots indicating the average values of cDAMI for all recorded neurons (see Materials and Methods) in the three different brain regions that we considered. Asterisks indicate significant differences (p < 0.05, Friedman test with post hoc analysis).
Figure 6.
Figure 6.
Differential modulation of functional connectivity between excitatory and inhibitory neurons as a function of behavioral state. A, Average action potential waveforms (mean ± SEM) for neurons classified as either broad-spiking (putative excitatory neurons, black) or fast-spiking (putative inhibitory neurons, gray). B, Left, Firing rates for putative excitatory neurons across brain states. Asterisks indicate significant differences (p < 0.05, Friedman test with post hoc analysis). Right, Distribution of normalized firing rates for excitatory neurons only as a function of brain state (blue: AW, red: QW, green: NREM) computed using an 800 ms time bin. Firing rates within each brain state have been normalized (independently for each neuron) to the highest value recorded across all three brain states. Asterisks indicate significant differences between distributions across behavioral states (p < 0.05, Wilcoxon rank-sum test with post hoc analysis). C, Same as B but for inhibitory neurons. D, Boxplots of cDAMI for putative excitatory neurons (left, black) and putative inhibitory neurons (right, gray) as a function of behavioral state. For both excitatory and inhibitory neurons, cDAMI is weaker in NREM than in AW and QW, with cDAMI being larger in AW than QW for excitatory neurons (asterisks indicate p < 0.05, Friedman test with post hoc analysis). For all behavioral states, cDAMI was larger for inhibitory than for excitatory neurons (p < 0.05, Mann–Whitney U test). E, Probability distribution of pairwise linear correlation values between firing rate trains separately for all recorded excitatory (left) or inhibitory (right) neurons, across brain states (blue: AW, red: QW, green: NREM). Firing rates were computed using an 800 ms time bin. Asterisks indicate significant differences between distributions across behavioral states (p < 0.05, Kolmogorov–Smirnov test with post hoc analysis). F, Median cMI values within and between brain areas measured during a single recording session as a function of behavioral state. Red lines indicate the border between computed cMI values and empty portion of the matrix (see also Figure 3A). Top, Median cMI values between pairs of excitatory neurons. Bottom, Median cMI values between pairs of inhibitory neurons. Green lines indicate the boundary between intra-area and inter-area connections (below and above the green line, respectively). G, Left, Cumulative probability distribution curves of cMI values as a function of behavioral state for pairs of putative excitatory neurons (solid lines) and pairs of putative inhibitory neurons (dashed lines) pooled across all areas for different behavioral states (blue: AW, red: QW, green: NREM). Asterisks indicate significant differences (p < 0.05, Friedman test with post hoc analysis). Right, Proportion of connections significantly larger than 0 (p < 0.05) for the different types of neuronal pairs (black: pairs of excitatory neurons; gray: pairs of inhibitory neurons) as a function of behavioral state. Error bars indicate bootstrap-estimated confidence intervals (see Materials and Methods). Asterisks and lines at the top of each panel indicate significant differences across behavioral states (p < 0.05, bootstrap-estimated, only one asterisk for all lines); line colors and styles correspond to the connection to which they refer, as indicated in the legend; asterisks on top of error bars indicate significant differences between types of connections within each behavioral state.
Figure 7.
Figure 7.
Differential state-dependent modulation of functional connectivity between excitatory and inhibitory neurons for intra-area versus inter-area connections. A, Median cMI values as a function of behavioral state between different types of neuronal pairs based on whether neurons were located in the same brain area or in different areas (solid lines: intra-area connections; dashed lines: inter-area connections). Error bars indicate confidence intervals for the medians. Left, black, cMI between pairs of excitatory neurons; for inter-area connections, cMI values during NREM were significantly lower than during both AW and QW; for intra-area connections, cMI values during NREM were lower than during QW but not AW. Right, gray, cMI between pairs of inhibitory neurons; the only significant difference was observed for inter-areal connections, for which cMI values during AW were lower than during both QW and NREM. Asterisks and lines at the top of each panel indicate significant differences across behavioral states (p < 0.05, Kruskal–Wallis test with post hoc analysis); line colors and styles correspond to the connection to which they refer, as indicated in the legend; asterisks on top of error bars indicate significant differences between types of connections within each behavioral state (p < 0.05, Wilcoxon rank-sum test). B, Proportions of significant (p < 0.05) cMI values for different types of connection as a function of behavioral state and based on whether neurons were located in the same or different areas (solid line: intra-area connections; dashed line: inter-area connections). Left, black, Pairs of excitatory neurons; no significant change was observed across behavioral states for intra-area connections, whereas a significant progressive decrease change was found for inter-area connections going from AW to QW and NREM. Right, gray, Pairs of inhibitory neurons; the only significant difference was present for inter-areas connections between AW and NREM (but not between QW and NREM). Error bars are bootstrap-estimated confidence intervals (see Materials and Methods). Asterisks and lines at the top of each panel indicate significant differences across behavioral states (p < 0.05, bootstrap-estimated, only one asterisk for all lines); line colors and styles correspond to the connection to which they refer, as indicated in the legend; asterisks on top of error bars indicate significant differences between types of connections, within each behavioral state. C, Probability distribution of pairwise correlation values between firing rate trains as a function of brain state (blue, left: AW; red, middle: QW; green, right: NREM), neuronal subtype (top: excitatory neuron; bottom: inhibitory neurons), and type of connection (solid lines: intra-area; dashed lines: inter-area). Asterisks indicate significant differences between types of connection within brain state and neuronal subtype (p < 0.05, Kolmogorov–Smirnov test).
Figure 8.
Figure 8.
Task-related networks remain segregated in quiet wakefulness and NREM sleep. A, Outline of maze (gray track) and behavioral task. Black rectangle indicates the starting point of each trial, where visual stimuli (blue: screens) were observed. Orange areas are the maze portion with sandpaper on side walls. Black areas are the reward locations. B, PETHs and raster plots for two example TM neurons. Top, Neuron in S1BF (time 0: entrance in the sandpaper zone). Bottom, Neuron in PRH (time 0: reward delivery). C, cDAMI for neurons of which the firing rate was either modulated (TM, orange traces) or not (non-TM neurons, purple traces) during task performance. Horizontal lines (with one asterisk for all lines): significant differences across behavioral states (solid lines: orange for TM neurons, purple for non-TM neurons; Friedman test with post hoc analysis) and between TM and non-TM neurons within each behavioral state (dashed black lines: differences between TM and non-TM within a single state, p < 0.05, Wilcoxon rank-sum test). D, Cumulative probability distribution of cMI values during the different behavioral states as a function of the type of neuronal pair: pairs of non-TM neurons (purple curves), pairs of one non-TM and one TM neuron (black curves), and pairs of TM neurons (orange curves). Top left, AW (solid lines). Bottom left, QW (dashed lines). Bottom right, NREM (dotted lines). Top right, Dashed lines: significant differences within each behavioral state (p < 0.05, Kruskal–Wallis test with post hoc analysis). Solid lines indicate significant differences across behavioral states (p < 0.05, Friedman test with post hoc analysis) for each type of neuronal pair (indicated by the corresponding color). E, Proportion of cMI values significantly larger than 0 for the different types of pairs of neurons (orange: pairs of TM neurons; purple: pairs of non-TM neurons; black: one non-TM and one TM neuron) as a function of behavioral state. Error bars are bootstrap-estimated confidence intervals. Colored asterisk above (or below) all lines at single brain states indicate the connection with the significantly (p < 0.05) highest (lowest) proportion of positive cMI values. Horizontal lines (with one asterisk for all lines) indicate significant differences across behavioral states for each type of neuronal pair (colors correspond to neuronal pair types, p < 0.05, bootstrap-estimated).

Similar articles

Cited by

References

    1. Arabzadeh E, Panzeri S, Diamond ME. Whisker vibration information carried by rat barrel cortex neurons. J Neurosci. 2004;24:6011–6020. doi: 10.1523/JNEUROSCI.1389-04.2004. - DOI - PMC - PubMed
    1. Balduzzi D, Tononi G. Integrated information in discrete dynamical systems: motivation and theoretical framework. PLoS Comput Biol. 2008;4:e1000091. doi: 10.1371/journal.pcbi.1000091. - DOI - PMC - PubMed
    1. Barthó P, Hirase H, Monconduit L, Zugaro M, Harris KD, Buzsáki G. Characterization of neocortical principal cells and interneurons by network interactions and extracellular features. J Neurophysiol. 2004;92:600–608. doi: 10.1152/jn.01170.2003. - DOI - PubMed
    1. Bastianini S, Berteotti C, Gabrielli A, Lo Martire V, Silvani A, Zoccoli G. Recent developments in automatic scoring of rodent sleep. Arch Ital Biol. 2015;153:58–66. - PubMed
    1. Bettinardi RG, Tort-Colet N, Ruiz-Mejias M, Sanchez-Vives MV, Deco G. Gradual emergence of spontaneous correlated brain activity during fading of general anesthesia in rats: Evidences from fMRI and local field potentials. Neuroimage. 2015;114:185–198. doi: 10.1016/j.neuroimage.2015.03.037. - DOI - PMC - PubMed

LinkOut - more resources