. 2016 Jul 20;36(29):7718-26.
doi: 10.1523/JNEUROSCI.4577-15.2016.

Dynamics of Propofol-Induced Loss of Consciousness Across Primate Neocortex

Affiliations

Dynamics of Propofol-Induced Loss of Consciousness Across Primate Neocortex

Yumiko Ishizawa et al. J Neurosci. .

Abstract

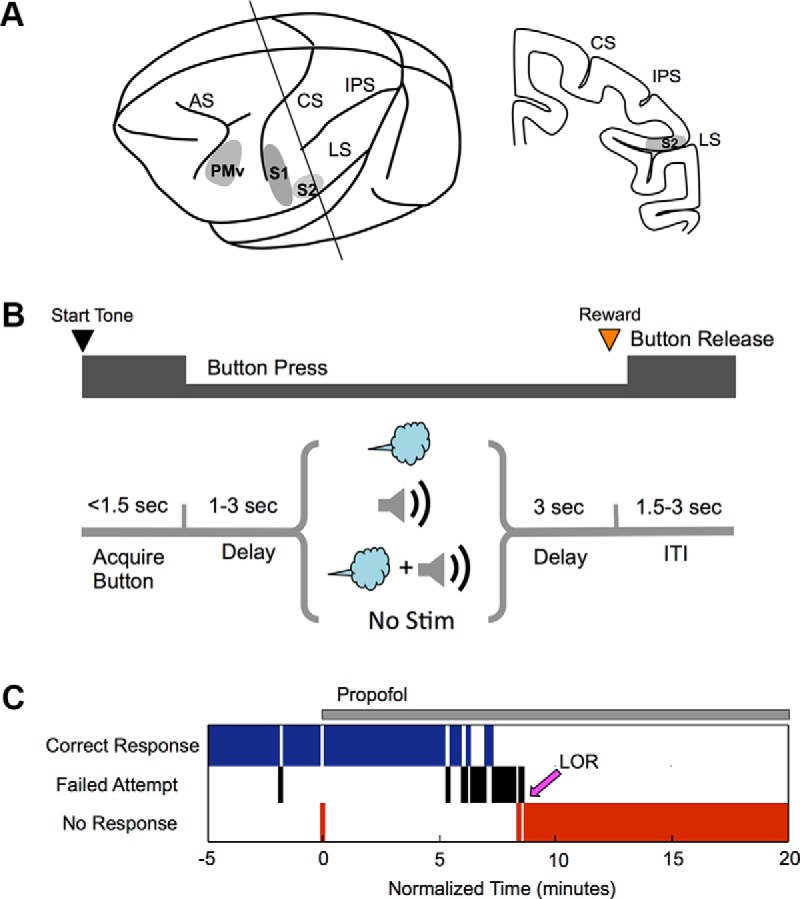
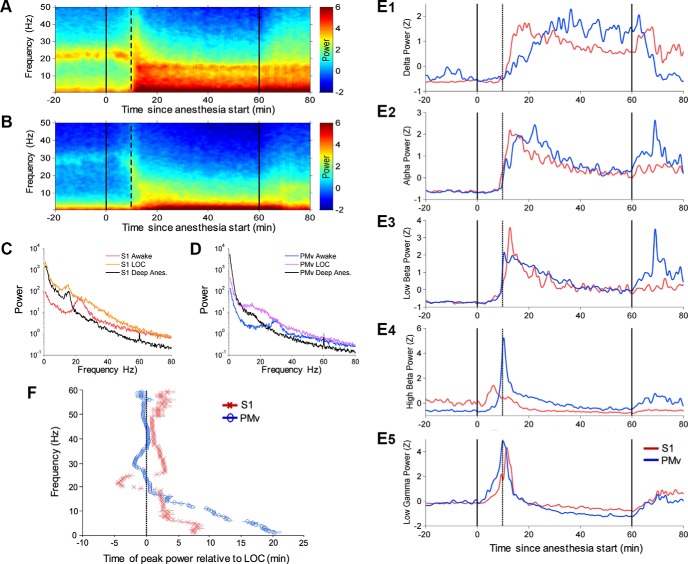
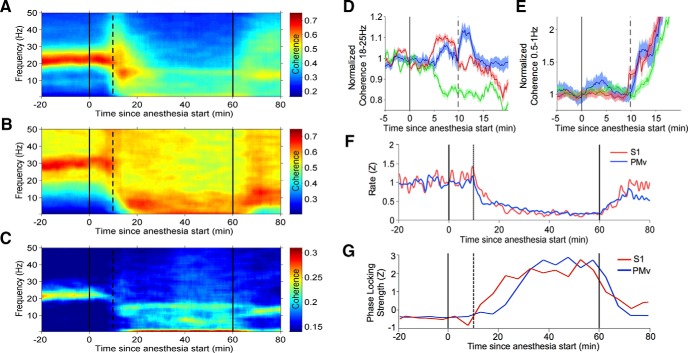
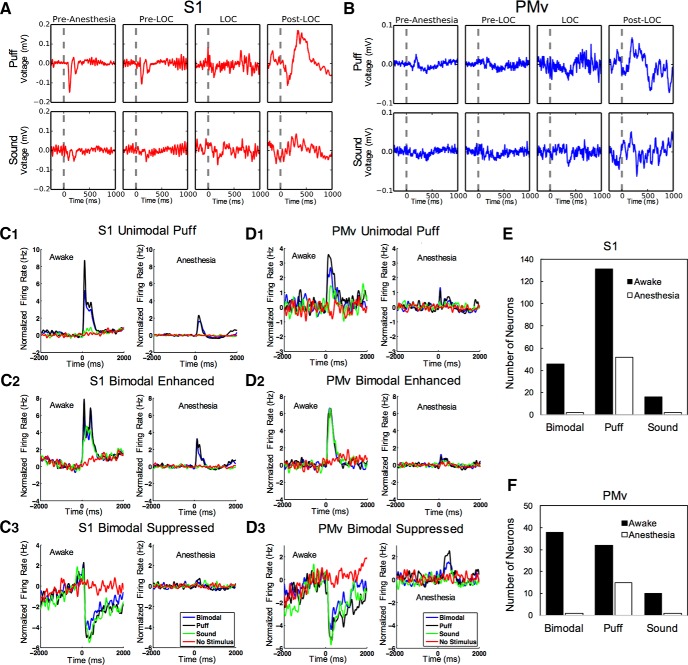
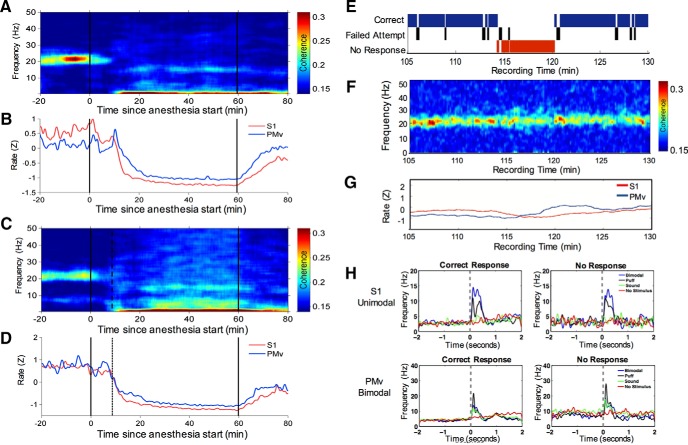
The precise neural mechanisms underlying transitions between consciousness and anesthetic-induced unconsciousness remain unclear. Here, we studied intracortical neuronal dynamics leading to propofol-induced unconsciousness by recording single-neuron activity and local field potentials directly in the functionally interconnecting somatosensory (S1) and frontal ventral premotor (PMv) network during a gradual behavioral transition from full alertness to loss of consciousness (LOC) and on through a deeper anesthetic level. Macaque monkeys were trained for a behavioral task designed to determine the trial-by-trial alertness and neuronal response to tactile and auditory stimulation. We show that disruption of coherent beta oscillations between S1 and PMv preceded, but did not coincide with, the LOC. LOC appeared to correspond to pronounced but brief gamma-/high-beta-band oscillations (lasting ∼3 min) in PMv, followed by a gamma peak in S1. We also demonstrate that the slow oscillations appeared after LOC in S1 and then in PMv after a delay, together suggesting that neuronal dynamics are very different across S1 versus PMv during LOC. Finally, neurons in both S1 and PMv transition from responding to bimodal (tactile and auditory) stimulation before LOC to only tactile modality during unconsciousness, consistent with an inhibition of multisensory integration in this network. Our results show that propofol-induced LOC is accompanied by spatiotemporally distinct oscillatory neuronal dynamics across the somatosensory and premotor network and suggest that a transitional state from wakefulness to unconsciousness is not a continuous process, but rather a series of discrete neural changes.

Significance statement: How information is processed by the brain during awake and anesthetized states and, crucially, during the transition is not clearly understood. We demonstrate that neuronal dynamics are very different within an interconnecting cortical network (primary somatosensory and frontal premotor area) during the loss of consciousness (LOC) induced by propofol in nonhuman primates. Coherent beta oscillations between these regions are disrupted before LOC. Pronounced but brief gamma-band oscillations appear to correspond to LOC. In addition, neurons in both of these cortices transition from responding to both tactile and auditory stimulation before LOC to only tactile modality during unconsciousness. We demonstrate that propofol-induced LOC is accompanied by spatiotemporally distinctive neuronal dynamics in this network with concurrent changes in multisensory processing.

Keywords: general anesthesia; local field potential; loss of consciousness; primate; sensory premotor network; single-neuron activity.


Figures

Figure 1.
Figure 1.
Recording location, behavioral task, and behavioral response to propofol. A, Location of recording sites in S1, S2, and PMv. CS, Central sulcus; IPS, intraparietal sulcus; LS, lateral sulcus; AS, arcuate sulcus. B, Sequence of events during behavioral trials. At the start tone (pure tone 1000 Hz, 100 ms), the animal initiates a trial by placing the hand on the button (using a hand ipsilateral to the recording hemisphere). The animal is required to keep its hand on the button until the end of the trial to be able to gain a liquid reward and then to release the button during the intertrial interval (ITI). During each trial, after a random delay, one of the four sensory stimulus sets is delivered regardless of the animal's behavioral response: nonaversive air puff at 12 psi to the lower face (250 ms, contralateral to the recording hemisphere), pure tone at 4000 Hz at 80 dB SPL (250 ms), simultaneous air puff and sound, or no stimulus. C, Typical behavioral response during propofol infusion. The animal's trial-by-trial behavioral response is recorded as a correct response (blue), failed attempt (black), or no response (red). Propofol was infused for 60 min at a fixed rate (200 μg/kg/min for Monkey E, 230 or 270 μg/kg/min for Monkey H). After the start of propofol infusion, failed attempts increased for 3–4 min before LOC (magenta arrow).
Figure 2.
Figure 2.
Brief increase in gamma/high-beta oscillations at LOC and different cortical dynamics in S1 and PMv during the time around LOC. A, B, LFP spectrograms in S1 and PMv. C, D, Power spectrum in S1 and PMv during wakefulness and LOC versus deep anesthesia (at 40 min of propofol infusion). E, Change in the power of different frequency bands in S1 (red) versus PMv (blue) (normalized using Z-scores): delta (0.5–4 Hz; E1), alpha (7–12 Hz; E2), low beta (12–18 Hz; E3), high beta (18–25 Hz; E4), and low gamma (25–34 Hz; E5). F, Peak power time analysis in S1 and PMv during propofol infusion. Propofol was infused from 0 to 60 min (black solid lines in A, B, E). LOC was detected at 10 min 26 s (black dotted lines in A, B, E, F).
Figure 3.
Figure 3.
Disruption of intercortically coherent beta oscillations before LOC and coherent slow oscillations after LOC. AC, LFP coherence time-frequency plot within S1 (A), PMv (B), and between S1 and PMv (C). D, Coherence change for dominant power before LOC (high beta 18–25 Hz) in S1 (red), PMv (blue), and between S1 and PMv (green). Error bars indicate ±SE. E, Coherence change for dominant power after LOC (slow oscillations 0.5–1 Hz) in S1 (red), PMv (blue), and between S1 and PMv (green). Error bars indicate ±SE. F, Average firing rate in S1 and PMv (normalized to preanesthetic average using Z-scores). G, Spike phase locking to delta frequency (0.5–4 Hz). The strength of phase locking was calculated based on the time-varying z-scored κ values. Propofol was infused from 0 to 60 min (black lines). LOC was detected at 10 min 2 s (a black dotted line).
Figure 4.
Figure 4.
Sensory-evoked LFP responses and single-neuron responses in awake and anesthetized conditions. A, Evoked potentials (averaged for 400 s) for air puff and sound in S1 during the preanesthesia, pre-LOC (after anesthesia start, before LOC), LOC, and post-LOC periods. B, Evoked potentials for air puff and sound in PMv. C, PSTHs for S1 unimodal puff-responsive neurons (C1), bimodal puff and sound-responsive neurons with enhanced firing responses (C2), and bimodal puff and sound-responsive neurons with suppressed firing responses (C3) during wakefulness versus anesthesia (averaged during the last 100 trials of propofol infusion). D, PSTHs for PMv unimodal puff-responsive neurons (D1), bimodal puff and sound-responsive neurons with enhanced firing responses (D2), and bimodal puff and sound-responsive neurons with suppressed firing responses (D3) during wakefulness versus anesthesia. E, F, Population summary of three subgroups (bimodal puff and sound-responsive, puff-responsive, and sound-responsive groups) in S1 and PMv during wakefulness versus anesthesia.
Figure 5.
Figure 5.
No task, blindfolding, and awake control studies. A, B, LFP coherence time-frequency plot between S1 and PMv (A) and the spike firing rate in S1 and PMv (B) in an animal that was not required to perform the task. No sensory stimulation was delivered. Propofol was infused from 0 to 60 min (black lines). C, D, LFP coherence time-frequency plot between S1 and PMv (C) and the spike firing rate in S1 and PMv (D) in an animal that was blindfolded and performing the task. Propofol was infused from 0 to 60 min (black lines). LOC was detected at 8 min 47 s (a black dotted line). EG, Behavioral responses (E), LFP coherence time-frequency plot between S1 and PMv (F), and the spike firing rate in S1 and PMv (G) during awake recording. Loss of response was detected at 116 min for the duration of 5 min and then the animal started responding again. H, PSTHs of an S1 unimodal puff-responsive neuron and a PMv bimodal puff and sound-responsive neuron during awake recording. PSTHs were averaged in the four different stimulus conditions for correct trials versus no response trials.

Similar articles

Cited by

References

    1. Acuña C, Pardo-Vazquez JL, Leborán V. Decision-making, behavioral supervision and learning: an executive role for the ventral premotor cortex? Neurotox Res. 2010;18:416–427. doi: 10.1007/s12640-010-9194-y. - DOI - PubMed
    1. Akeju O, Pavone KJ, Westover MB, Vazquez R, Prerau MJ, Harrell PG, Hartnack KE, Rhee J, Sampson AL, Habeeb K, Gao L, Pierce ET, Walsh JL, Brown EN, Purdon PL. A comparison of propofol- and dexmedetomidine-induced electroencephalogram dynamics using spectral and coherence analysis. Anesthesiology. 2014;121:978–989. doi: 10.1097/ALN.0000000000000419. - DOI - PMC - PubMed
    1. Alkire MT, Hudetz AG, Tononi G. Consciousness and anesthesia. Science. 2008;322:876–880. doi: 10.1126/science.1149213. - DOI - PMC - PubMed
    1. Asaad WF, Eskandar EN. A flexible software tool for temporally-precise behavioral control in Matlab. J Neurosci Methods. 2008a;174:245–258. doi: 10.1016/j.jneumeth.2008.07.014. - DOI - PMC - PubMed
    1. Asaad WF, Eskandar EN. Achieving behavioral control with millisecond resolution in a high-level programming environment. J Neurosci Methods. 2008b;173:235–240. doi: 10.1016/j.jneumeth.2008.06.003. - DOI - PMC - PubMed

Publication types

LinkOut - more resources