. 2016 Jul 20;36(29):7786-801.
doi: 10.1523/JNEUROSCI.3952-15.2016.

Diverse Functions of Retinoic Acid in Brain Vascular Development

Affiliations

Diverse Functions of Retinoic Acid in Brain Vascular Development

Stephanie Bonney et al. J Neurosci. .

Abstract

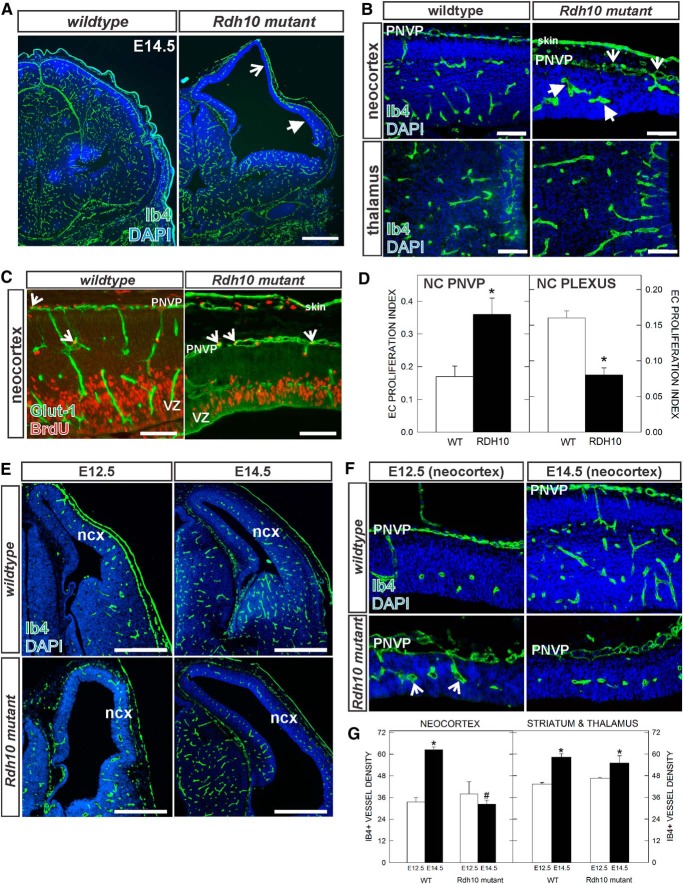
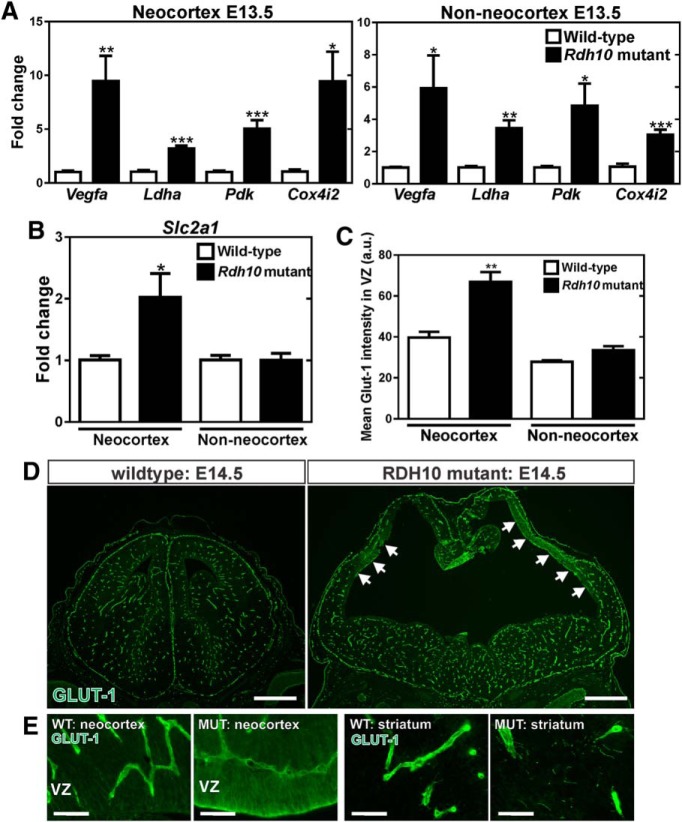
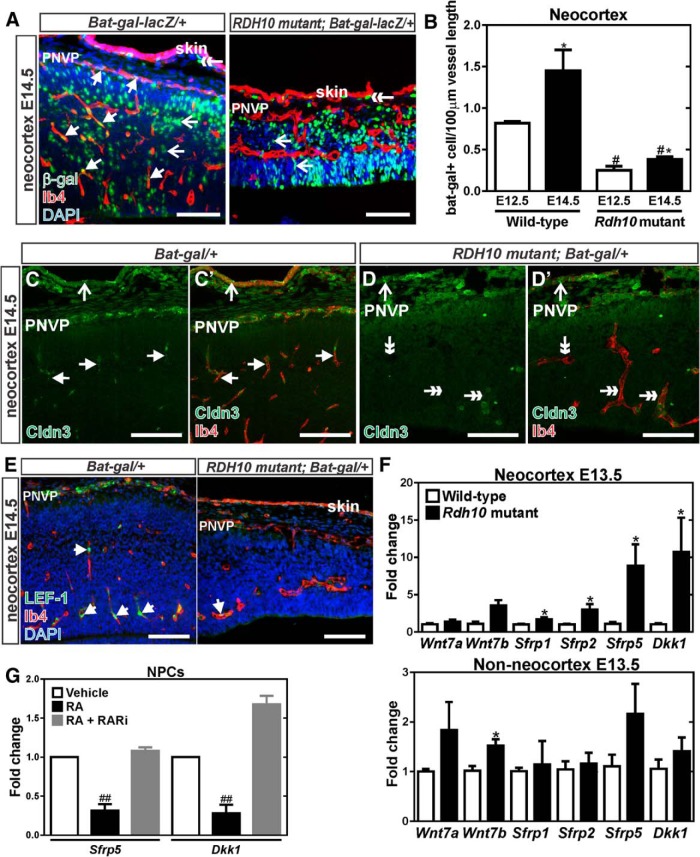
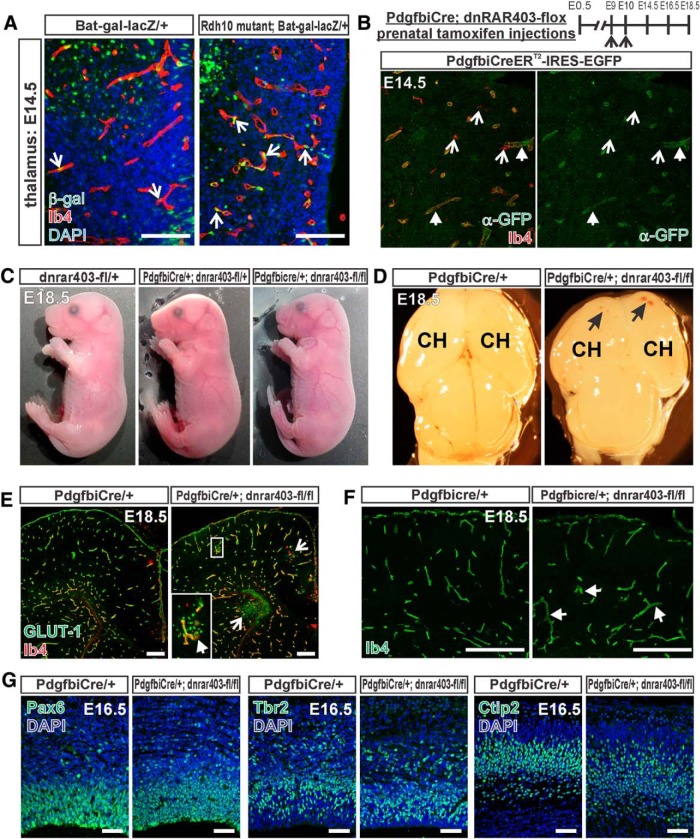
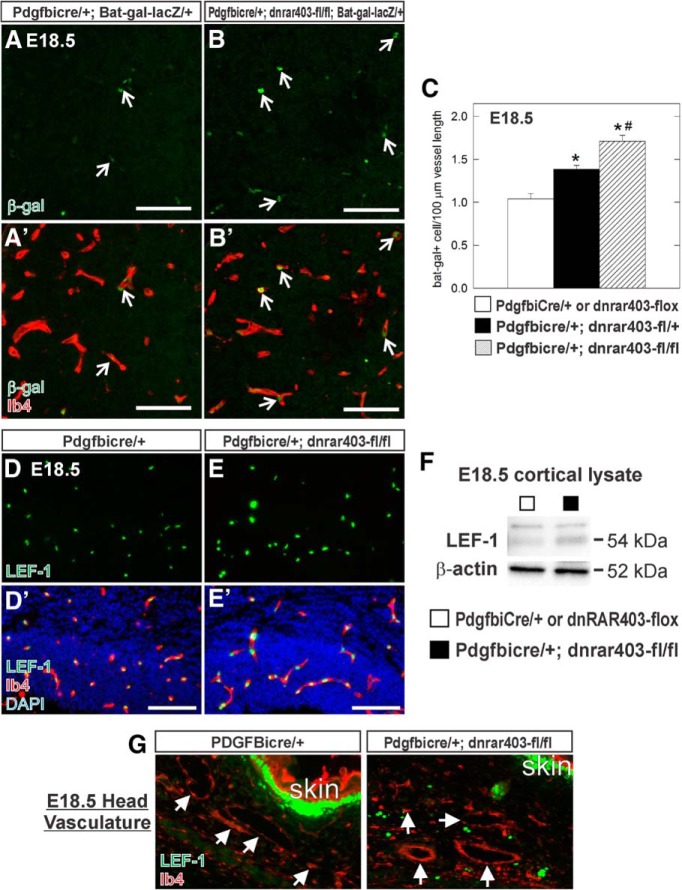
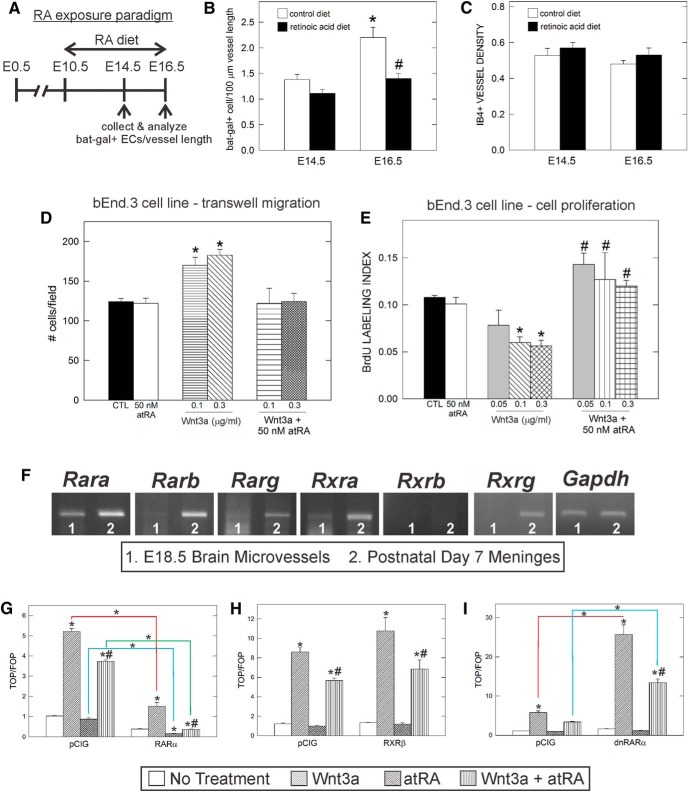
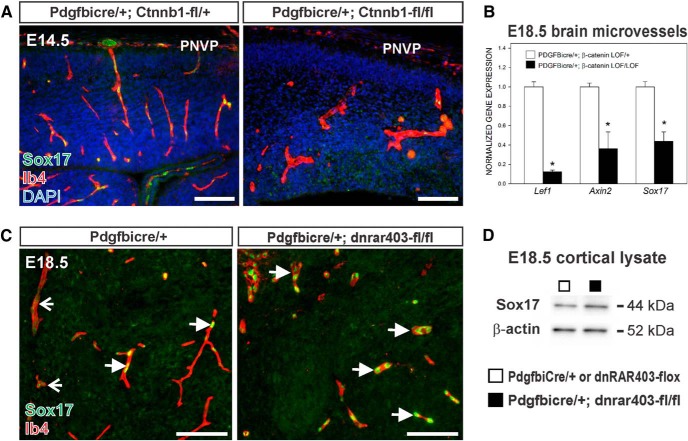
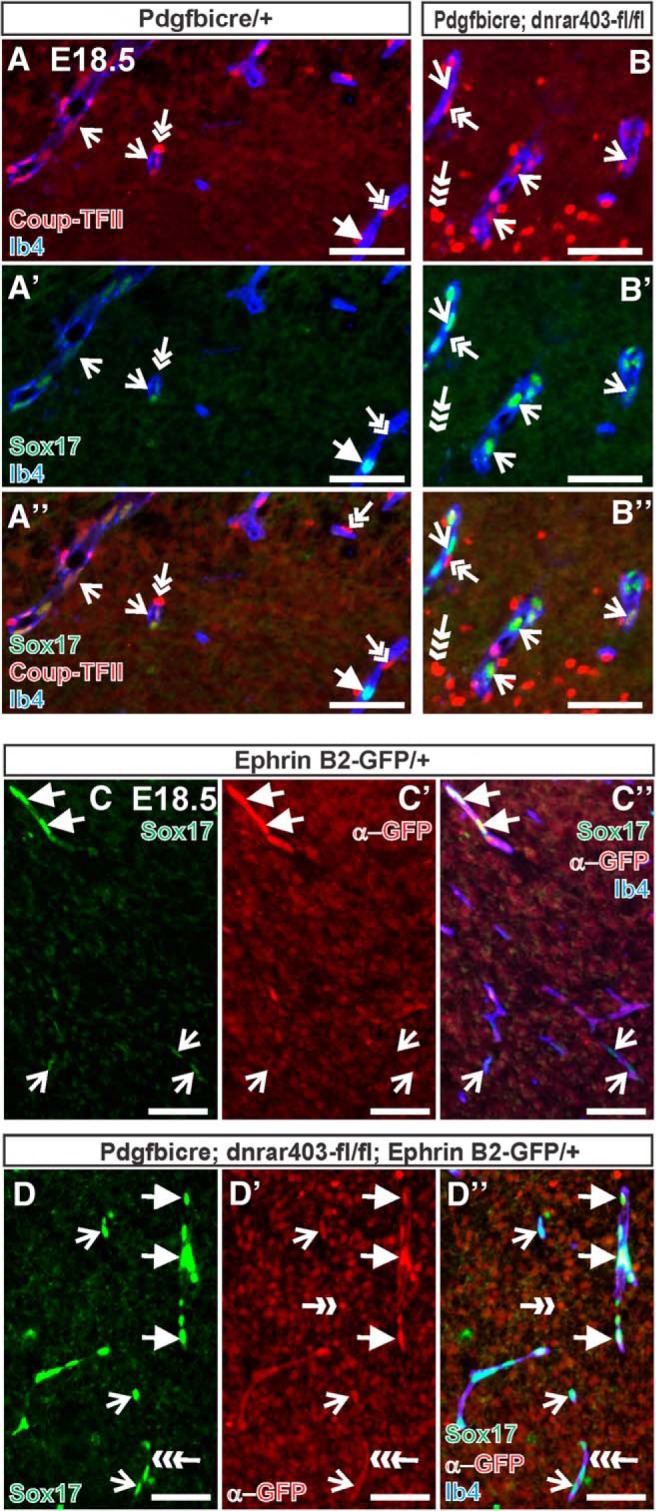
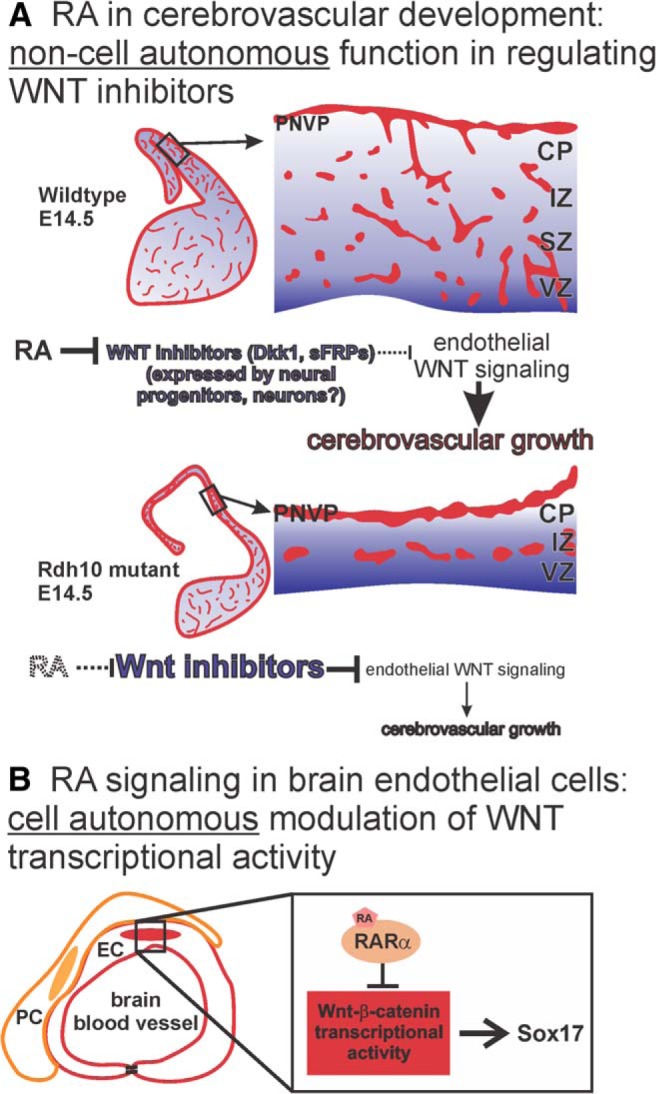
As neural structures grow in size and increase metabolic demand, the CNS vasculature undergoes extensive growth, remodeling, and maturation. Signals from neural tissue act on endothelial cells to stimulate blood vessel ingression, vessel patterning, and acquisition of mature brain vascular traits, most notably the blood-brain barrier. Using mouse genetic and in vitro approaches, we identified retinoic acid (RA) as an important regulator of brain vascular development via non-cell-autonomous and cell-autonomous regulation of endothelial WNT signaling. Our analysis of globally RA-deficient embryos (Rdh10 mutants) points to an important, non-cell-autonomous function for RA in the development of the vasculature in the neocortex. We demonstrate that Rdh10 mutants have severe defects in cerebrovascular development and that this phenotype correlates with near absence of endothelial WNT signaling, specifically in the cerebrovasculature, and substantially elevated expression of WNT inhibitors in the neocortex. We show that RA can suppress the expression of WNT inhibitors in neocortical progenitors. Analysis of vasculature in non-neocortical brain regions suggested that RA may have a separate, cell-autonomous function in brain endothelial cells to inhibit WNT signaling. Using both gain and loss of RA signaling approaches, we show that RA signaling in brain endothelial cells can inhibit WNT-β-catenin transcriptional activity and that this is required to moderate the expression of WNT target Sox17. From this, a model emerges in which RA acts upstream of the WNT pathway via non-cell-autonomous and cell-autonomous mechanisms to ensure the formation of an adequate and stable brain vascular plexus.

Significance statement: Work presented here provides novel insight into important yet little understood aspects of brain vascular development, implicating for the first time a factor upstream of endothelial WNT signaling. We show that RA is permissive for cerebrovascular growth via suppression of WNT inhibitor expression in the neocortex. RA also functions cell-autonomously in brain endothelial cells to modulate WNT signaling and its downstream target, Sox17. The significance of this is although endothelial WNT signaling is required for neurovascular development, too much endothelial WNT signaling, as well as overexpression of its target Sox17, are detrimental. Therefore, RA may act as a "brake" on endothelial WNT signaling and Sox17 to ensure normal brain vascular development.

Keywords: VEGF; WNT; brain vascular development; cerebrovasculature; endothelial cell; retinoic acid.


Figures

Figure 1.
Figure 1.
Neocortical vascular development in E14.5 Rdh10 mutant embryos. A, Ib4-labeled blood vessels in E14.5 wild-type and Rdh10 mutant forebrain. Open arrow indicates avascular area of the neocortex; arrow indicates reduced vascular plexus in expanded neocortex. B, High-magnification images of E14.5 vascular plexus in the neocortex and thalamus of wild-type and Rdh10 mutants. Open arrows and arrows indicate enlarged, dysplastic vessels in PNVP and within the neocortex, respectively. C, Representative images of GLUT-1/BrdU labeling in the two vascular plexus in the neocortex (NC): the superficial PNVP, and plexus within the neocortex. Open arrows indicate BrdU+/Glut+ cells in both panels. D, Graphs depicting quantification of EC proliferation index in the NC PNVP and NC plexus in E14.5 wild-type and Rdh10 mutants. Asterisks indicate significance from wild-type value. E, Low-magnification images of E12.5 and E14.5 wild-type and Rdh10 mutant forebrains. F, High-magnification images of neocortical PNVP and internal vascular plexus at E12.5 and E14.5 in wild-type and Rdh10 mutants. G, Graph depicting vascular density in the two genotypes in the neocortex and thalamus at E12.5 and E14.5. *Significance from E12.5 value of the same genotype; #significance from E14.5 wild-type value. Scale bars: A, E, 500 μm; B, C, 100 μm. Ncx, Neocortex.
Figure 2.
Figure 2.
Hypoxia-inducible targets VEGFA and GLUT-1 are elevated in Rdh10 mutant neocortices. A, qPCR for the hypoxia-inducible genes Vegfa, Ldha, Pdk, and Cox4i2 transcript expression in control and Rdh10 mutant neocortices and non-neocortical brain structures. B, qPCR for Slc2a1 (GLUT-1) transporter transcript expression in control and Rdh10 mutant neocortices and non-neocortical brain structures. C, Quantification of average intensity signal for GLUT-1 in the VZ of neocortical and striatum/thalamus brain regions of control (wild-type, Rdh10 heterozygous) and Rdh10 mutants. D, Low-magnification images of GLUT-1 labeling in E14.5 wild-type and Rdh10 mutant brains at the level of the cortex and striatum. Arrows indicate regions of high neuroepithelial GLUT-1 signal in the Rdh10 mutant neocortical VZ. E, High-magnification images of GLUT-1 labeling in the neocortical VZ and striatum of wild-type and Rdh10 mutants. *Significance from control (p < 0.05). Scale bars, 500 μm.
Figure 3.
Figure 3.
Diminished WNT signaling in Rdh10 mutant cerebrovasculature. A, β-gal (green) and Ib4 (red) coimmunolabeling in neocortical blood vessels at E14.5 of Bat-gal-LacZ/+ and Rdh10 mutant Bat-gal-LacZ/+ animals. Arrows indicate β-gal+ ECs, open arrows indicate β-gal+ neural cells, and double-head arrows point to β-gal+ cells in the skin. B, Quantification of number of β-gal+ ECs per vessel length in in the neocortex of control (wild-type and Rdh10 heterozygous) and Rdh10 mutant animals at E12.5 and E14.5. *Significance between control at E12.5 and E14.5; #significance from E12.5 wild-type; *#significance from E14.5 wild-type. C, D, Arrows indicate Ib4+ (red) vessels with Claudin-3 (green) signal in the neocortical region of a control, Bat-gal/+ brain. Open arrows in the control and mutant samples indicate Claudin-3 signal in the skin overlying the brain. Double arrows indicate Claudin-3-/Ib4+ vessels in the Rdh10 mutants. E, Arrows indicate LEF-1+ (green) ECs (Ib4 in red) in the neocortex of Bat-gal-LacZ/+ and Rdh10 mutant Bat-gal-LacZ/+ animals. F, qPCR for transcript expression of WNT ligands (Wnt7a, Wnt7b) and WNT inhibitors (Sfrp1, Sfrp2, Sfrp5, and Dkk1) in wild-type and Rdh10 mutant E13.5 neocortices and non-neocortical brain structures. *Significance between control and Rdh10 mutants. G, qPCR for transcription expression of the WNT inhibitors Sfrp5 and Dkk1 in cultured neocortical progenitors treated with RA or a pan RAR inhibitor; #significance from vehicle. Scale bars, 100 μm.
Figure 4.
Figure 4.
Elevated WNT signaling in non-cortical Rdh10 mutant vasculature and neurovascular development in PdgfbiCre;dnRAR403-flox animals. A, β-gal (green) and Ib4 (red) coimmunolabeling in the thalamic vasculature of E14.5 Bat-gal-LacZ/+ and Rdh10 mutant Bat-gal-LacZ/+ animals. Open arrows indicate β-gal+ ECs. B, Top, Depiction of prenatal tamoxifen injection timing for PdgfbiCre;dnRAR403-flox animals. Bottom, GFP (green) immunostaining and Ib4 (red) labeling in E14.5 PdgfbiCreERT2-IRES-GFP (also known as PdgfbiCre) brain to illustrate specific expression of transgene in blood vessels. Arrows indicate GFP+/Ib4+ blood vessels, open arrows indicate GFP−/Ib4+ microglia. C, Whole fetus images of E18.5 control (dnrar403-fl/+) and mutant (PdgfbiCre;dnRAR403-fl/+ or fl/fl). D, Low-magnification image of whole brains from PdgfbiCre/+ animals with zero or two copies of the dnRAR403-flox allele. Arrows indicate hemorrhage within the cerebral hemispheres (CH). E, GLUT-1- (green), Ib4- (red), and DAPI-stained cortical sections of E18.5 PdgfbiCre/+ and PdgfbiCre;dnRAR403-fl/fl mutant. Open arrows indicate microhemorrhages. Inset shows GLUT-1+ red blood cells in the brain parenchyma, indicative of hemorrhage. Arrow in inset indicates activated Ib4+ microglia with amoeboid morphology. F, Ib4+ cerebrovasculature in E18.5 PdgfbiCre/+ and PdgfbiCre;dnRAR403-fl/fl mutant sections. Arrows indicate enlarged vessels in mutant sample. G, Neocortical progenitor markers Pax6, Tbr2, and deep-layer cortical neuronal marker Ctip2 in E16.5 PdgfbiCre/+ and PdgfbiCre;dnRAR403-fl/fl mutant sections. Scale bars, A, G, 100 μm; E, F, 200 μm.
Figure 5.
Figure 5.
Endothelial WNT signaling is increased in fetal brain vasculature of PdgfbiCre;dnRAR403-flox mutants. A, B, Open arrows indicate β-gal+ (green), Ib4+ (red) ECs in the striatum of E18.5 PdgfbiCre/+;Bat-gal-LacZ/+ and PdgfbiCre;dnRAR403-fl/fl;Bat-gal-lacZ/+. C, Graph depicting quantification of β-gal+ ECs per vessel length in E18.5 control (PdgfbiCre/+;Bat-gal-LacZ/+ or dnRAR403-flox;Bat-gal-LacZ/+) and mutant (PdgfbiCre;dnRAR403-fl/+;Bat-gal-lacZ/+, PdgfbiCre;dnRAR403-fl/fl;Bat-gal-lacZ/+) cortical, striatal, and thalamic vasculature. *Significance from control; # significance from PdgfbiCre;dnRAR403-fl/+. D, E, LEF-1 (green), Ib4+ (red) ECs in the neocortex of PdgfbiCre/+ and PdgfbiCre;dnRAR403-fl/fl. F, LEF-1 (54 kDa), and β-actin (52 kDa) immunoblots on protein lysate from E18.5 control (□: PdgfbiCre/+ or dnRAR403-flox) or mutant (■: PdgfbiCre;dnRAR403-fl/fl) neocortices. G, LEF-1 (green) and Ib4 (red) immunofluorescence in the head area of E18.5 PdgfbiCre/+ and PdgfbiCre;dnRAR403-fl/fl animals. Arrows indicate Ib4+/LEF-1− vessels. Scale bars, 100 μm.
Figure 6.
Figure 6.
RA inhibits endothelial WNT signaling in vivo and in vitro. A, Depiction of RA treatment paradigm for pregnant Bat-gal-LacZ/+ animals. B, Graph depicting quantification of β-gal+ ECs per 100 μm vessel length in control and RA-exposed fetuses at E14.5 and E16.5. *Significant difference from E14.5 control diet; #significant difference from control diet at E16.5. C, Graph depicting quantification of vessel density in control and RA-treated animals at E14.5 and E16.5. D, Graph depicting quantification of transwell migration assay with bEnd.3 cell line after treatment with RA, WNT3a, or RA + WNT3a. *Significance from untreated cells (CTL). E, Quantification of cell proliferation of bEnd.3 cells after 3 d of treatment with RA, WNT3a, or both. *Significance from untreated cells (CTL); #significant difference from WNT3a treatment. F, RT-PCR for RARs and RXRs using E18.5 microvessel and postnatal day 7 meninges cDNA. The housekeeping gene GAPDH is used to show equal amount of RNA to generate the cDNA used in the RT-PCR. G, Transfection of a RARα construct decreases the response of cells to WNT stimulation. Two-way ANOVA revealed a significant difference due to construct (F(1, 16) = 1301, p < 0.001) and treatment (F(3, 16) = 518.1, p < 0.001), as well as a significant interaction between both factors (F(3, 16) = 200.1, p < 0.001). H, RXRβ does not alter the response of cells to WNT stimulation. Two-way ANOVA revealed a significant difference due to treatment (F(3, 16) = 90.17, p < 0.001), but no significant difference due to construct (F(1, 16) = 4.358, p > 0.05) and no interaction between the two factors (F(3, 16) = 1.188, p > 0.05). I, dnRARα increases the response of cells to WNT stimulation. Two-way ANOVA revealed a significant difference due to construct (F(1, 16) = 110.7, p < 0.001) and treatment (F(3, 16) = 110.7, p < 0.001), as well as a significant interaction between the two factors (F(3, 16) = 49.98, p < 0.001). For GI, asterisks directly above the bar indicate significance from untreated pCIG control and hash marks indicate significance from WNT3a treatment alone; within-group differences are indicated by connected lines.
Figure 7.
Figure 7.
Elevated expression of Sox17 in PdgfbiCre;dnRAR403-fl/fl neurovasculature. A, Immunostaining for Sox17 (green) in Ib4+ (red) cerebral vessels in tissue from control and an EC-specific knock-down of WNT signaling component β-catenin at E14.5 (PdgfbiCre;Ctnnb1-fl/fl). B, Graph depicting Lef1, Axin2, and Sox17 transcript levels in microvessels isolated from E18.5 PdgfbiCre/+;Ctnnb1-fl/+ and PdgfbiCre/+;Ctnnb1-fl/fl brains. Asterisks indicate significance from PdgfbiCre;Ctnnb1-fl/+ value. C, Representative Sox17 (green) immunostaining in Ib4+ (red) cerebral vessels at E18.5 from PdgfbiCre/+ and PdgfbiCre;dnRAR403-fl/fl brains. Open arrows indicate weakly Sox17+ vessels; arrows indicate vessels with high Sox17 expression. D, Sox17 (44 kDa) and β-actin (52 kDa) immunoblots on protein lysate from E18.5 control (□: PdgfbiCre/+ or dnRAR403-flox) or mutant (■: PdgfbiCre;dnRAR403-fl/fl) neocortices. Scale bars, 100 μm.
Figure 8.
Figure 8.
Elevated Sox17 expression in PdgfbiCre;dnRAR403-fl/fl venous and arterial vessels. A, B, Immunostaining for Sox17 (green) and Coup-TFII (red) on E18.5 PdgfbiCre/+ (A) and PdgfbiCre;dnRAR403-fl/fl (B) brains. Open arrows indicate Ib4+ (blue) vessels with Coup-TFII+ ECs (presumptive venous blood vessel). Arrow in A indicates blood vessel in control brain tissue that is Coup-TFII−/Sox17+ (presumptive arterial vessel). Double arrows indicate Coup-TFII+ mural cells; triple arrow indicates Coup-TFII+ neural cell. C, D, GFP (red) and Sox17 (green) immunostaining in control and PdgfbiCre;dnRAR403-fl/fl animals expressing Ephrin B2-GFP that labels arterial EC nuclei. Arrows indicate GFP+/Sox17+ arterial EC nuclei; open arrows indicate Sox17 expression in GFP- EC nuclei. C′′ and D′′ show overlay with Ib4 to label the vasculature (blue). Ephrin-B2-GFP is also expressed by some neurons (double-headed arrow). GFP IF is present in the endothelial cell membrane of images in D due to the IRES-GFP present in the PdgfbiCre allele construct (triple arrow). Scale bars, 100 μm.
Figure 9.
Figure 9.
Model of RA functions during brain vascular development. A, RA in the developing neocortex normally functions to suppress expression of WNT inhibitors (Dkk1, sFRPs) to create a permissive environment for endothelial WNT signaling that drives cerebrovascular development. In RA-deficient Rdh10 mutants, ectopic expression of WNT inhibitors impedes endothelial WNT signaling, which disrupts growth of the cerebrovasculature. B, RA functions cell-autonomously in brain ECs, likely through its receptor RARα, to inhibit WNT-β-catenin transcriptional and limit expression of its target gene Sox17.

References

    1. Al Tanoury Z, Piskunov A, Rochette-Egly C. Vitamin A and retinoid signaling: genomic and nongenomic effects. J Lipid Res. 2013;54:1761–1775. doi: 10.1194/jlr.R030833. - DOI - PMC - PubMed
    1. Ashique AM, May SR, Kane MA, Folias AE, Phamluong K, Choe Y, Napoli JL, Peterson AS. Morphological defects in a novel Rdh10 mutant that has reduced retinoic acid biosynthesis and signaling. Genesis. 2012;50:415–423. doi: 10.1002/dvg.22002. - DOI - PMC - PubMed
    1. Bauer HC, Bauer H, Lametschwandtner A, Amberger A, Ruiz P, Steiner M. Neovascularization and the appearance of morphological characteristics of the blood-brain barrier in the embryonic mouse central nervous system. Brain Res Dev Brain Res. 1993;75:269–278. doi: 10.1016/0165-3806(93)90031-5. - DOI - PubMed
    1. Bohnsack BL, Lai L, Dolle P, Hirschi KK. Signaling hierarchy downstream of retinoic acid that independently regulates vascular remodeling and endothelial cell proliferation. Genes Dev. 2004;18:1345–1358. doi: 10.1101/gad.1184904. - DOI - PMC - PubMed
    1. Brault V, Moore R, Kutsch S, Ishibashi M, Rowitch DH, McMahon AP, Sommer L, Boussadia O, Kemler R. Inactivation of the beta-catenin gene by Wnt1-Cre-mediated deletion results in dramatic brain malformation and failure of craniofacial development. Development. 2001;128:1253–1264. - PubMed

Publication types

MeSH terms