. 2016 Jul 22:6:30031.
doi: 10.1038/srep30031.

Impact of structural polymorphism for the Helicobacter pylori CagA oncoprotein on binding to polarity-regulating kinase PAR1b

Affiliations

Impact of structural polymorphism for the Helicobacter pylori CagA oncoprotein on binding to polarity-regulating kinase PAR1b

Hiroko Nishikawa et al. Sci Rep. .

Abstract

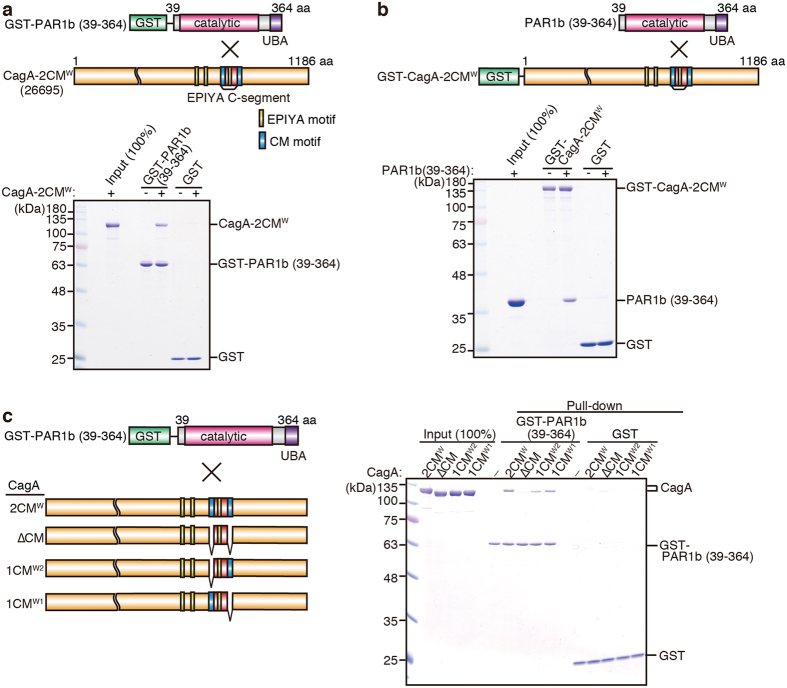
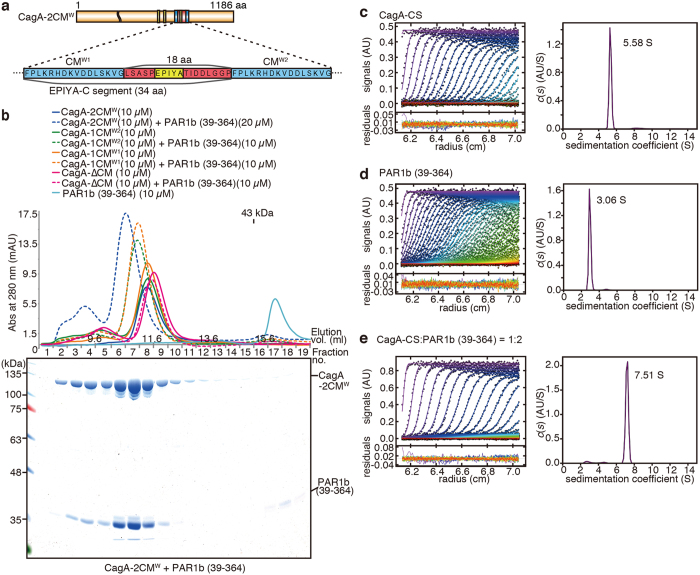
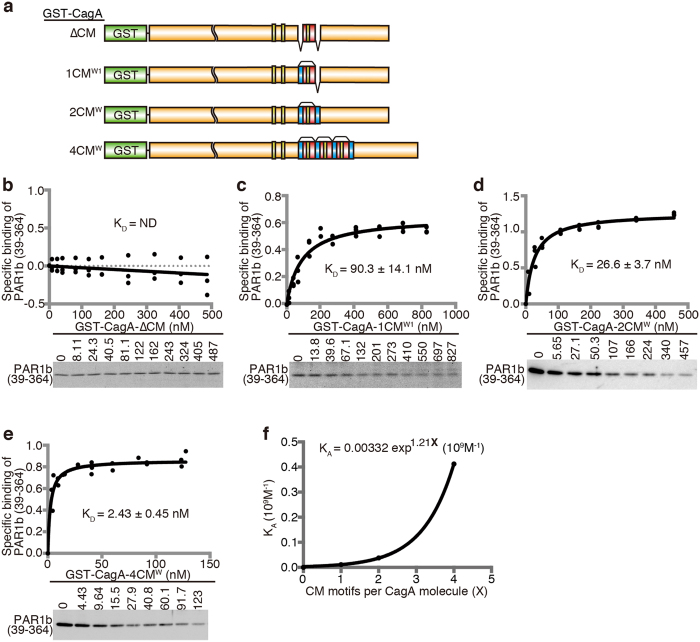
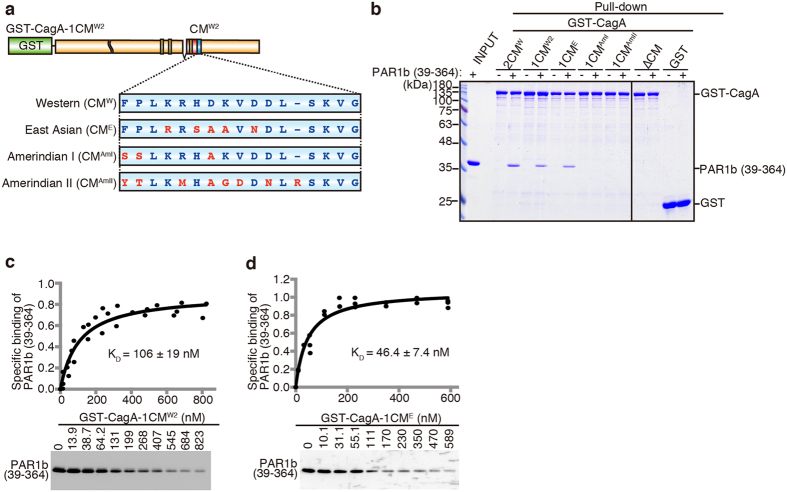
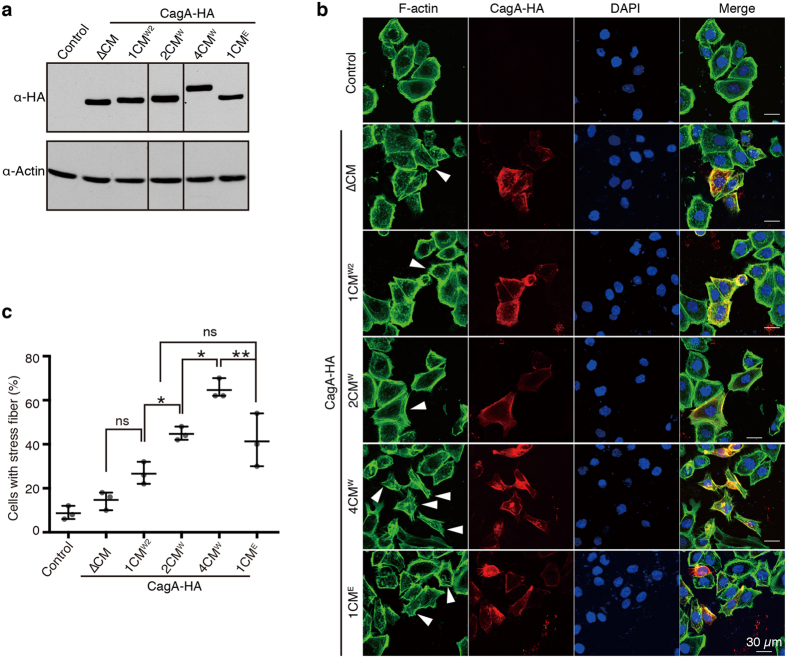
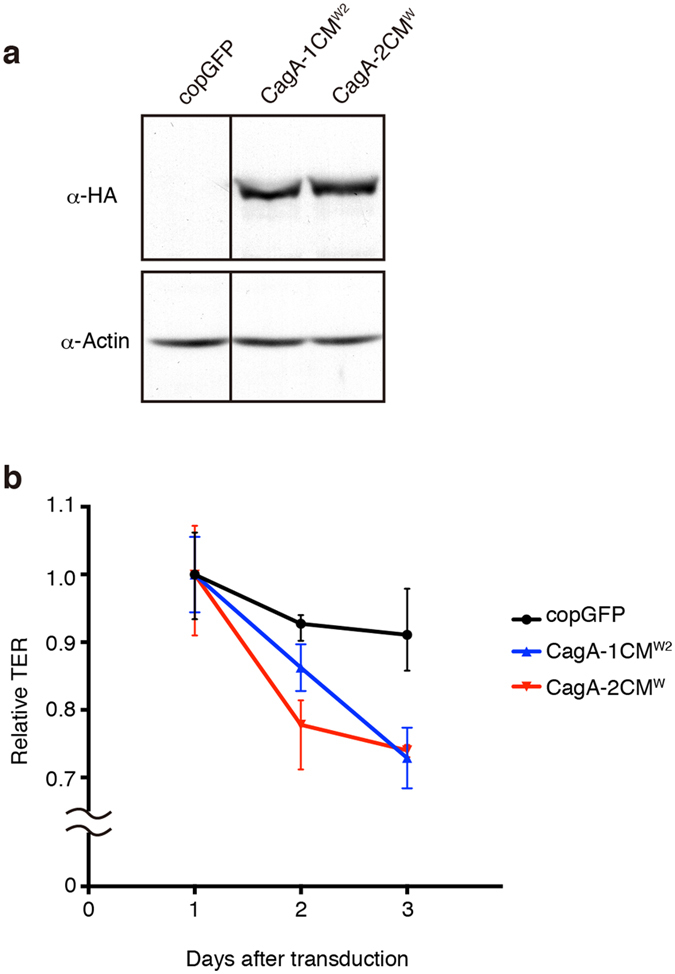
Chronic infection with cagA-positive Helicobacter pylori is the strongest risk factor for atrophic gastritis, peptic ulcers, and gastric cancer. CagA, the product of the cagA gene, is a bacterial oncoprotein, which, upon delivery into gastric epithelial cells, binds to and inhibits the polarity-regulating kinase, partitioning-defective 1b (PAR1b) [also known as microtubule affinity-regulating kinase 2 (MARK2)], via its CagA multimerization (CM) motif. The inhibition of PAR1b elicits junctional and polarity defects, rendering cells susceptible to oncogenesis. Notably, the polymorphism in the CM motif has been identified among geographic variants of CagA, differing in either the copy number or the sequence composition. In this study, through quantitative analysis of the complex formation between CagA and PAR1b, we found that several CagA species have acquired elevated PAR1b-binding activity via duplication of the CM motifs, while others have lost their PAR1b-binding activity. We also found that strength of CagA-PAR1b interaction was proportional to the degrees of stress fiber formation and tight junctional disruption by CagA in gastric epithelial cells. These results indicate that the CM polymorphism is a determinant for the magnitude of CagA-mediated deregulation of the cytoskeletal system and thereby possibly affects disease outcome of cagA-positive H. pylori infection, including gastric cancer.


Figures

Figure 1
Figure 1. In vitro reconstitution of CagA-PAR1b interaction.
(a) Schematic diagram of GST-PAR1b (39–364), which contains the catalytic and the UBA domains, and CagA-2CMW (H. pylori 26695 strain) which contains 2 CM motifs: one in the EPIYA-C segment and the other immediately downstream of the segment (top). Results for the GST pull-down between GST-PAR1b (39–364) and CagA-2CMW (bottom). (b) Schematic diagram of PAR1b (39–364) and GST-CagA-2CMW (top) and the results of the GST pull-down using these constructs (bottom). (c) Schematic diagram of GST-PAR1b (39–364) and GST-CagA-2CMW constructs with CM deletions (left) and the results of the GST pull-down using these constructs (right). All pull-downs were performed in HBS-P buffer. Samples were resolved on SDS-PAGE gels and visualized by CBB.
Figure 2
Figure 2. Two PAR1b can simultaneously bind to CagA.
(a) Schematic diagram of CagA-2CMW and a blow-up of the region containing the CM motifs. CMW1 resides in the 34-amino-acid EPIYA-C segment and CMW2 flanks the segment on the C-terminal side. The two CM sequences are 18 amino acid residues apart. (b) Results from the size-exclusion chromatography of CagA-PAR1b (39–364) complexes analysed on Superdex 200 10/300 GL using HBS-P as running buffer (top). Fractionated CagA-2CM + PAR1b (39–364) complex was further resolved on SDS-PAGE gel and stained by CBB (bottom). (c–e) Analytical ultracentrifugation of 5.5 μM CagA-C1164S (CagA-CS) (c), 11 μM PAR1b (39–364) (d), and 5.5 μM CagA-CS + 11 μM PAR1b (39–364) (e). Raw absorbance distributions, the best-fit model (left), and the continuous sedimentation distributions c(s) (right) calculated by the SEDFIT program.
Figure 3
Figure 3. Tandem CM motifs generate strong binding affinity to PAR1b.
(a) Schematic diagram of GST-CagA constructs used. CagA-4CMW was derived from H. pylori NCTC11637 strain. (b–e) Saturation binding curves obtained by quantitative GST binding assay between PAR1b (39–364) and GST-CagA-ΔCM (b), GST-CagA-1CMW1 (c), GST-CagA-2CMW (d), or GST-CagA-4CMW (e). Values shown are dissociation constants (KD) ± SE, n = 3. Bands at the bottom of each graph shows a representative CBB stained gel or an immunoblot of unbound PAR1b (39–364). Full-length gels and blots are presented in Supplementary Fig. S2. (f) Graph and equation depicting the relationship between the number of CM motifs per molecule of CagA and their association constants (KA) with PAR1b (39–364).
Figure 4
Figure 4. Binding affinities of regional CagA CM variations to PAR1b.
(a) Schematic diagram of GST-CagA-1CMW2 carrying various regional CM motifs at the CMW2 position. (b) GST pull-down between various GST-CagA-1CMX constructs with various CM motifs and PAR1b (39–364). (c,d) Saturation binding curves obtained by the quantitative GST binding assay between PAR1b (39–364) and GST-CagA-1CMW2 (c) or GST-CagA-1CME (d). Values are dissociation constants (KD) ± SE, n = 3. Full-length gels and blots are presented in Supplementary Fig. S3.
Figure 5
Figure 5. CM-dependent augmentation of stress fiber formation by CagA.
(a) Immunoblots of AGS total cell lysates 24 h after transfection with the various pCDH-EF1-CagA-HA expression vectors as indicated. CagA-HA was detected by using anti-HA (3F10) as primary antibody. Control indicates cells transfected with the empty pCDH-EF1 vector. Full-length blot is presented in Supplementary Fig. S4. (b) Representative fluorescent images of AGS cells after transfection. F-actin was visualized by Alexa Fluor 488 phalloidin. CagA-HA was detected using anti-HA (C29F4) followed by Alexa Fluor 546 anti-rabbit antibodies. Nuclei were stained with DAPI. Arrowheads mark CagA-HA expressing cells positive for stress fiber. (c) Quantification of CagA-HA expressing AGS cells displaying stress fiber. 50 CagA-positive cells per construct were analysed for stress fiber formation per experiment. For control cells, 50% of cells in each image were chosen randomly and assessed for stress fiber formation. Error bars represent mean ± range, n = 3. *P < 0.05, **P < 0.01, repeated measures one-way ANOVA, post-hoc Tukey’s test.
Figure 6
Figure 6. CM-dependent disruption of polarized MDCK monolayers.
(a) Immunoblots of MDCK total cell lysates 3 days after transduction with the lentiviral constructs as indicated. CagA-HA was detected by using anti-HA (6E2) as primary antibody. The copGFP-transducing lentivirus was used as a negative control. Full-length blot is presented in Supplementary Fig. S5. (b) Relative TER of polarized MDCK monolayers normalized to Day 1 post transduction. Error bars represent mean ± range, n = 3.

Similar articles

Cited by

References

    1. Peek R. M. & Blaser M. J. Helicobacter pylori and gastrointestinal tract adenocarcinomas. Nat. Rev. Cancer 2, 28–37 (2002). - PubMed
    1. Hatakeyama M. Helicobacter pylori CagA and gastric cancer: A paradigm for hit-and-run carcinogenesis. Cell Host Microbe 15, 306–316 (2014). - PubMed
    1. Nomura A. et al.. Helicobacter pylori infection and gastric carcinoma among Japanese Americans in Hawaii. N. Engl. J. Med. 325, 1132–1136 (1991). - PubMed
    1. Parsonnet J. et al.. Helicobacter pylori infection and the risk of gastric carcinoma. N. Engl. J. Med. 325, 1127–1131 (1991). - PubMed
    1. Ferlay J. et al.. Cancer incidence and mortality worldwide: Sources, methods and major patterns in GLOBOCAN 2012. Int. J. Cancer 136, E359–E386 (2015). - PubMed

Publication types

MeSH terms

LinkOut - more resources