. 2016 Jul 4:10:2137-54.
doi: 10.2147/DDDT.S108118. eCollection 2016.

Pharmacophore modeling and in silico toxicity assessment of potential anticancer agents from African medicinal plants

Affiliations

Pharmacophore modeling and in silico toxicity assessment of potential anticancer agents from African medicinal plants

Fidele Ntie-Kang et al. Drug Des Devel Ther. .

Abstract

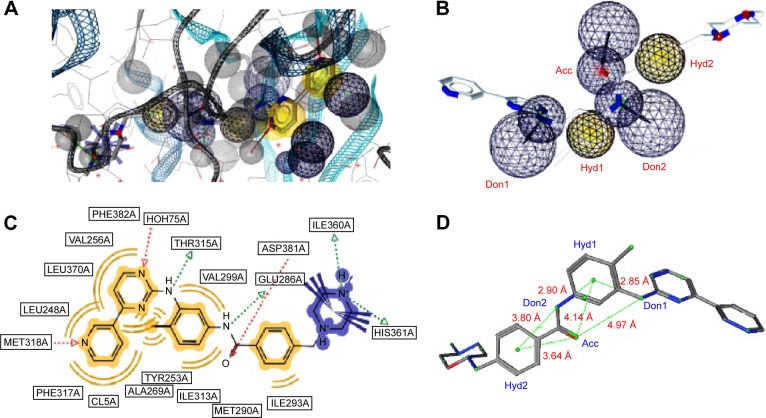
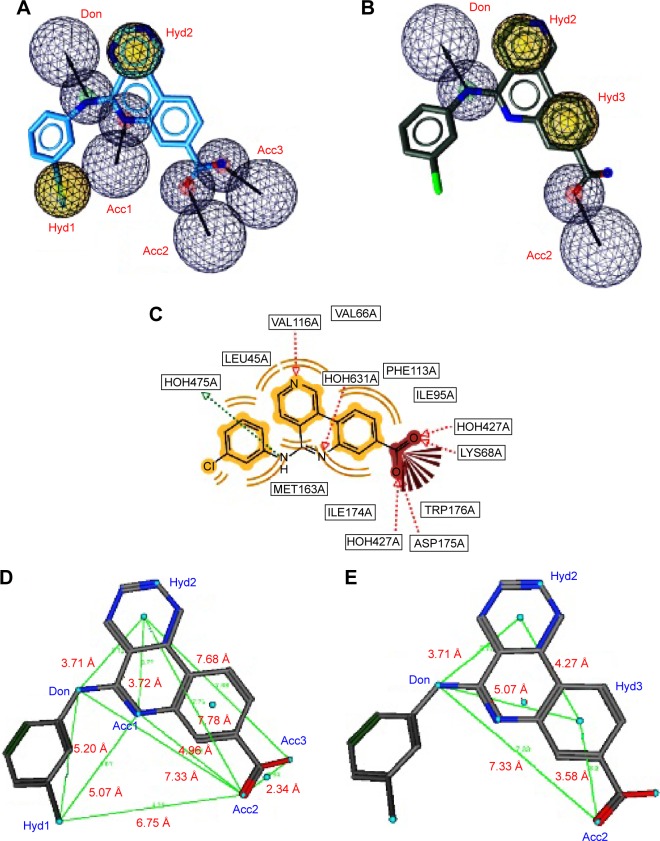
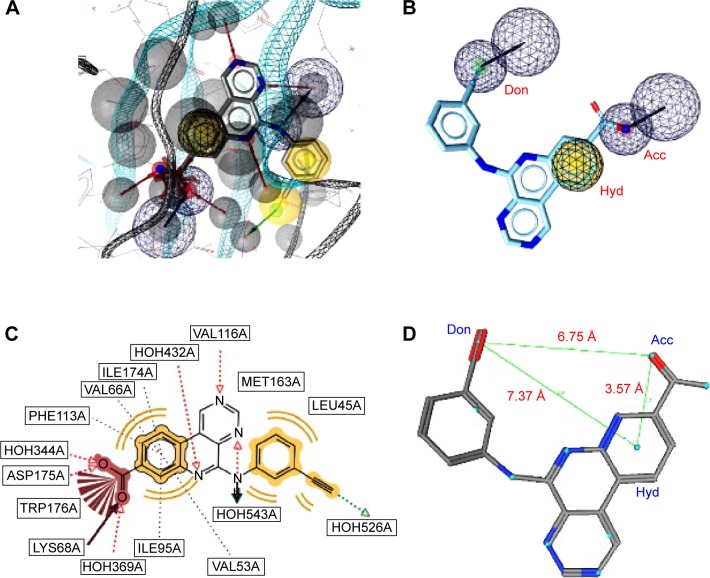
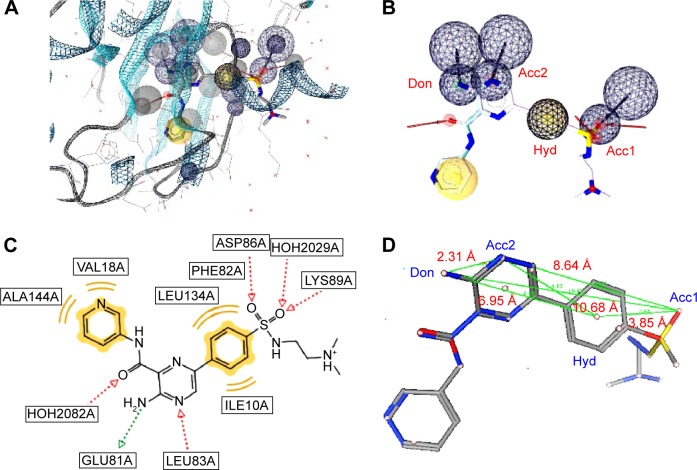
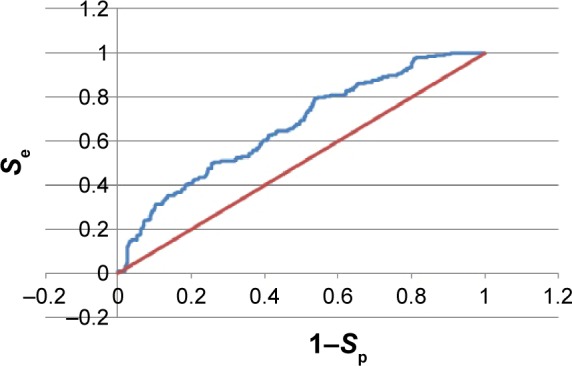
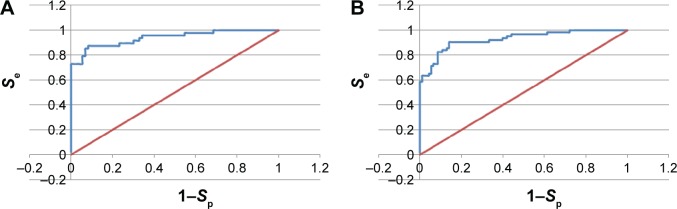
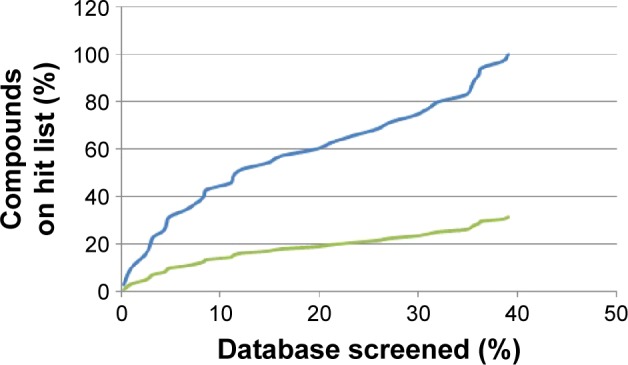
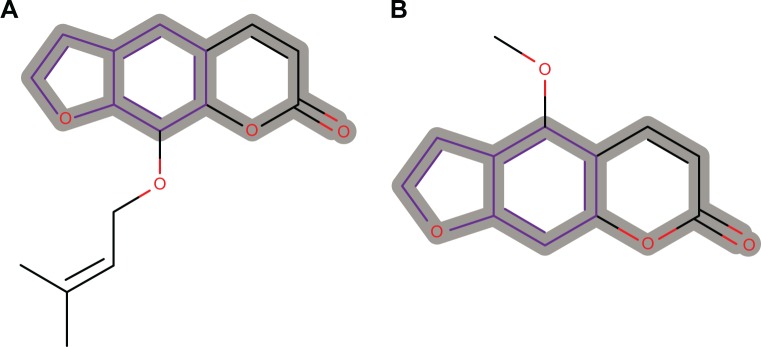
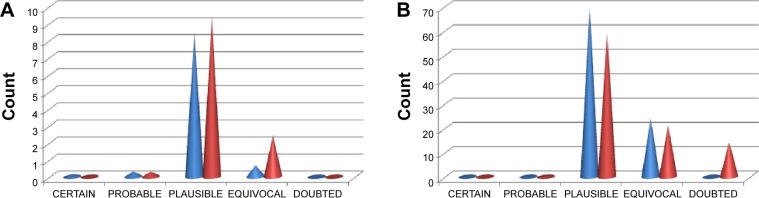
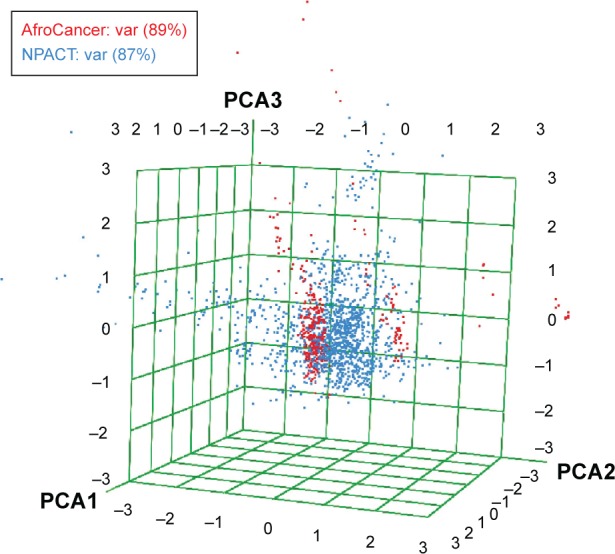
Molecular modeling has been employed in the search for lead compounds of chemotherapy to fight cancer. In this study, pharmacophore models have been generated and validated for use in virtual screening protocols for eight known anticancer drug targets, including tyrosine kinase, protein kinase B β, cyclin-dependent kinase, protein farnesyltransferase, human protein kinase, glycogen synthase kinase, and indoleamine 2,3-dioxygenase 1. Pharmacophore models were validated through receiver operating characteristic and Güner-Henry scoring methods, indicating that several of the models generated could be useful for the identification of potential anticancer agents from natural product databases. The validated pharmacophore models were used as three-dimensional search queries for virtual screening of the newly developed AfroCancer database (~400 compounds from African medicinal plants), along with the Naturally Occurring Plant-based Anticancer Compound-Activity-Target dataset (comprising ~1,500 published naturally occurring plant-based compounds from around the world). Additionally, an in silico assessment of toxicity of the two datasets was carried out by the use of 88 toxicity end points predicted by the Lhasa's expert knowledge-based system (Derek), showing that only an insignificant proportion of the promising anticancer agents would be likely showing high toxicity profiles. A diversity study of the two datasets, carried out using the analysis of principal components from the most important physicochemical properties often used to access drug-likeness of compound datasets, showed that the two datasets do not occupy the same chemical space.

Keywords: anticancer; medicinal plants; natural products; pharmacophore; toxicity; virtual screening.


Figures

Figure 1
Figure 1
A pharmacophore model used to screen for potential active compounds against the 1IEP target. Notes: (A) Projected within the target site (B) with highlighted pharmacophore features located on atomic centers of the native ligand, with HBDs and HBAs in blue and hydrophobic centers in yellow. (C) Interactions between native ligand and target site amino acid residues, with hydrophobic interactions shown in light brown, HBD interactions with the native ligand in green, and acceptor interactions in red. (D) Locations of centers of pharmacophore features on the native ligand showing distances between the centers, with distance measurements shown in red. This model led to the identification of only nine out of the 45 generated active conformers in the hit list composed of only 12 hits (hit rate =0.52). Abbreviations: HBDs, H-bond donors; HBAs, H-bond acceptors.
Figure 2
Figure 2
Two sets of combinations of high-performance pharmacophore models for the 3PE1 target. Notes: For (A and B), the highlighted pharmacophore features are located on the atomic centers of the native ligand, with HBDs and HBAs in blue and hydrophobic centers in yellow, for the two pharmacophore models (3PE2-I and 3PE1-II, with carbon atoms portrayed in cyan and gray, respectively). (C) Interactions between native ligand and target site amino acid residues, with hydrophobic interactions shown in light brown, HBD interactions with the native ligand in green, and acceptor interactions in red. For (D and E), representing 3PE1-I and 3PE1-II, respectively, the locations of centers of pharmacophore features on the native ligand show distances between the centers, with distance measurements shown in red. These are the best overall performing pharmacophore models in this study. Abbreviations: HBDs, H-bond donors; HBAs, H-bond acceptors.
Figure 3
Figure 3
A pharmacophore model used to screen for potential active compounds against the 3PE2 target. Notes: (A) Projected within the target site (B) with highlighted pharmacophore features located on atomic centers of the native ligand, with HBDs and HBAs in blue and hydrophobic centers in yellow. (C) Interactions between native ligand and target site amino acid residues, with hydrophobic interactions shown in light brown, HBD interactions with the native ligand in green, and acceptor interactions in red. (D) Locations of centers of pharmacophore features on the native ligand showing distances between the centers, with distance measurements shown in red. This model is less selective, “picking up” too many FPs. Abbreviations: HBDs, H-bond donors; HBAs, H-bond acceptors; FPs, false positives.
Figure 4
Figure 4
A pharmacophore model used to screen for potential active compounds against the 4ACM target. Notes: (A) Projected within the target site (B) with highlighted pharmacophore features located on atomic centers of the native ligand, with HBDs and HBAs in blue and hydrophobic centers in yellow. (C) Interactions between native ligand and target site amino acid residues, with hydrophobic interactions shown in light brown, HBD interactions with the native ligand in green, and acceptor interactions in red. (D) Locations of centers of pharmacophore features on the native ligand showing distances between the centers, with distance measurements shown in red. This model was able to capture up to 23 out of the 42 compounds (% yield of actives =55%) in the original database of actives, with a hit rate of 3.51% from the total database of actives and decoys. Meanwhile, the Se, Sp, and GH values for this model were all ≥0.55. Abbreviations: HBDs, H-bond donors; HBAs, H-bond acceptors; GH, Güner–Henry.
Figure 5
Figure 5
The ROC curve for the 3PE1-I pharmacophore model. Note: The ROC curve is shown in blue, while the random line is shown in red. Abbreviation: ROC, receiver operating characteristic.
Figure 6
Figure 6
ROC curves for the 4BBG pharmacophore models. Notes: (A) 4BBG-I. (B) 4BBG-III. The ROC curve is shown in blue, while the random line is shown in red. Abbreviation: ROC, receiver operating characteristic.
Figure 7
Figure 7
Enrichment curves obtained by screening the database compounds consisting of the AfroCancer database (blue) and NPACT database (green), using the 4ACM pharmacophore query features. Notes: Selection and rank ordering of the compounds in the database were performed using the pharmacophore fit scoring function implemented in LigandScout. The AfroCancer performed better than the NPACT. Abbreviation: NPACT, Naturally Occurring Plant-based Anticancer Compound-Activity-Target.
Figure 8
Figure 8
Psoralen substructure responsible for chromosome damage predicted as CERTAIN for two compounds from the AfroCancer dataset. Notes: (A) Imperatorin and (B) bergapten, isolated from the stem of Balsamocitrus paniculata harvested in Cameroon and related plant species., The toxicity end point was predicted by Derek to be CERTAIN. Thus, these compounds may rather be toxic, not necessarily exhibiting anticancer activities.
Figure 9
Figure 9
Bar charts showing the distribution of toxicity predictions per likelihood. Notes: (A) Chromosome damage in vitro and (B) totals. In both cases, AfroCancer is in blue, while NPACT is in red. The bulk of the generated tautomers were predicted as either PLAUSIBLE or EQUIVOCAL for all likelihoods of both datasets. Abbreviation: NPACT, Naturally Occurring Plant-based Anticancer Compound-Activity-Target.
Figure 10
Figure 10
A PCA plot showing the comparison of the chemical space defined by the NPs in the AfroCancer (red) datasets and the chemical space represented by NPs in the NPACT (cyan) datasets, with the first three principal components projected, respectively, in the x, y, and z directions of space. Notes: The larger number of outliers in the case of the NPACT dataset (away from the center and toward the left side of the cube) indicates a wider sampling of the chemical space when compared with the AfroCancer collection. Abbreviations: PCA, principal component analysis; NPs, natural products; Var, variance.
Figure 11
Figure 11
MCSS panel in (A) AfroCancer and (B) NPACT, featuring the most common substructures included in the databases. Abbreviations: MCSS, most common substructure selection; NPACT, Naturally Occurring Plant-based Anticancer Compound-Activity-Target.

References

    1. Gibbs JB. Mechanism-based target identification and drug discovery in cancer research. Science. 2000;287(5460):1969–1973. - PubMed
    1. WHO Media Centre [webpage on the Internet] Fast sheet Nº 297. 2013. [Accessed February 4, 2014]. Available from: http://www.who.int/mediacentre/factsheets/fs297/en/index.html.
    1. [webpage on the Internet] Globocan Fast Stats. 2008. [Accessed August 4, 2013]. Available from: http://www.iarc.fr/en/media-centre/iarcnews/2010/globocan2008.php.
    1. Newman DJ, Cragg GM, Snader KM. The influence of natural products upon drug discovery. Nat Prod Rep. 2000;17(3):215–234. - PubMed
    1. Hostettmann K, Terreaux C. Search for new lead compounds from higher plants. Chimia. 2000;54(11):652–657.

MeSH terms

Substances