Peripheral blood eosinophils: a surrogate marker for airway eosinophilia in stable COPD
- PMID: 27445469
- PMCID: PMC4936821
- DOI: 10.2147/COPD.S100338
Peripheral blood eosinophils: a surrogate marker for airway eosinophilia in stable COPD
Abstract
Introduction: Sputum eosinophilia occurs in approximately one-third of stable chronic obstructive pulmonary disease (COPD) patients and can predict exacerbation risk and response to corticosteroid treatments. Sputum induction, however, requires expertise, may not always be successful, and does not provide point-of-care results. Easily applicable diagnostic markers that can predict sputum eosinophilia in stable COPD patients have the potential to progress COPD management. This study investigated the correlation and predictive relationship between peripheral blood and sputum eosinophils. It also examined the repeatability of blood eosinophil counts.
Methods: Stable COPD patients (n=141) were classified as eosinophilic or noneosinophilic based on their sputum cell counts (≥3%), and a cross-sectional analysis was conducted comparing their demographics, clinical characteristics, and blood cell counts. Receiver operating characteristic curve analysis was used to assess the predictive ability of blood eosinophils for sputum eosinophilia. Intraclass correlation coefficient was used to examine the repeatability of blood eosinophil counts.
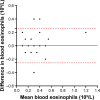
Results: Blood eosinophil counts were significantly higher in patients with sputum eosinophilia (n=45) compared to those without (0.3×10(9)/L vs 0.15×10(9)/L; P<0.0001). Blood eosinophils correlated with both the percentage (ρ=0.535; P<0.0001) and number of sputum eosinophils (ρ=0.473; P<0.0001). Absolute blood eosinophil count was predictive of sputum eosinophilia (area under the curve =0.76, 95% confidence interval [CI] =0.67-0.84; P<0.0001). At a threshold of ≥0.3×10(9)/L (specificity =76%, sensitivity =60%, and positive likelihood ratio =2.5), peripheral blood eosinophil counts enabled identification of the presence or absence of sputum eosinophilia in 71% of the cases. A threshold of ≥0.4×10(9)/L had similar classifying ability but better specificity (91.7%) and higher positive likelihood ratio (3.7). In contrast, ≥0.2×10(9)/L offered a better sensitivity (91.1%) for ruling out sputum eosinophilia. There was a good agreement between two measurements of blood eosinophil count over a median of 28 days (intraclass correlation coefficient =0.8; 95% CI =0.66-0.88; P<0.0001).
Conclusion: Peripheral blood eosinophil counts can help identify the presence or absence of sputum eosinophilia in stable COPD patients with a reasonable degree of accuracy.
Keywords: chronic obstructive pulmonary disease; diagnostic accuracy; sputum eosinophilia; stability of eosinophil counts.
Figures


References
-
- Brightling CE. Clinical applications of induced sputum. Chest. 2006;129(5):1344–1348. - PubMed
-
- Singh D, Kolsum U, Brightling CE, Locantore N, Agusti A, Tal-Singer R, for ECLIPSE investigators Eosinophilic inflammation in COPD: prevalence and clinical characteristics. Eur Respir J. 2014;44(6):1697–1700. - PubMed
-
- Bafadhel M, McKenna S, Terry S, et al. Acute exacerbations of chronic obstructive pulmonary disease: identification of biologic clusters and their biomarkers. Am J Respir Crit Care Med. 2011;184(6):662–671. - PubMed
Publication types
MeSH terms
LinkOut - more resources
Full Text Sources
Other Literature Sources
Medical

