. 2016 Jun 28:10:164.
doi: 10.3389/fncel.2016.00164. eCollection 2016.

Protection of Primary Dopaminergic Midbrain Neurons by GPR139 Agonists Supports Different Mechanisms of MPP(+) and Rotenone Toxicity

Affiliations

Protection of Primary Dopaminergic Midbrain Neurons by GPR139 Agonists Supports Different Mechanisms of MPP(+) and Rotenone Toxicity

Kirsten Bayer Andersen et al. Front Cell Neurosci. .

Abstract

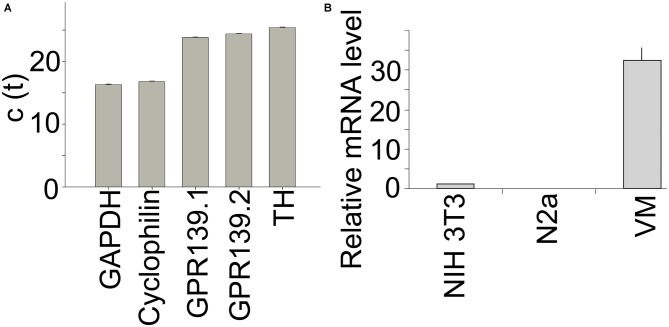
The G-protein coupled receptor 139 (GPR139) is expressed specifically in the brain in areas of relevance for motor control. GPR139 function and signal transduction pathways are elusive, and results in the literature are even contradictory. Here, we examined the potential neuroprotective effect of GPR139 agonism in primary culture models of dopaminergic (DA) neuronal degeneration. We find that in vitro GPR139 agonists protected primary mesencephalic DA neurons against 1-methyl-4-phenylpyridinium (MPP(+))-mediated degeneration. Protection was concentration-dependent and could be blocked by a GPR139 antagonist. However, the protection of DA neurons was not found against rotenone or 6-hydroxydopamine (6-OHDA) mediated degeneration. Our results support differential mechanisms of toxicity for those substances commonly used in Parkinson's disease (PD) models and potential for GPR139 agonists in neuroprotection.

Keywords: G protein-coupled receptor; Parkinson’s disease model; apoptosis; cell-based assay; drug screening; neurodegeneration; neuroprotection; neurotoxin.


Figures

Figure 1
Figure 1
Synthesis of (2-naphthalen-1-yl-acetylamino)-acetic acid ethyl ester. 1-Naphthaleneacetic acid was dissolved in dichloromethane. Glycine ethyl ester hydrochloride and triethyamine were added and the solution cooled to 0°C under an argon atmosphere. N-(3-Dimethylaminopropyl)-N′-ethylcarbodiimide hydrochloride was added and the reaction was stirred for 2 h at 0°C and then at room temperature for 16 h.
Figure 2
Figure 2
Synthesis of (2-naphthalen-1-yl-acetylamino)-acetic acid. (2-Naphthalen-1-yl-acetylamino)-acetic acid ethyl ester was dissolved in ethanol. Sodium hydroxide was added and the reaction was stirred for 16 h at room temperature.
Figure 3
Figure 3
Synthesis of Compound 2. (A) ((1-Naphthylacetyl)Amino)acetic acid was dissolved in dichloromethane and N, N-diisopropylethylamine at room temperature and cooled to 0°C. To the solution was added (3-dimethylamino)pyrrolidine and N, N’-dicyclohexylcarbodiimide. (B) 1H NMR spectrum of compound 2, with specifications provided in “Materials and Methods” Section.
Figure 4
Figure 4
Synthesis of compound 3. (A) [(1-Naphthylacetyl)amino]acetic acid, N-(2-Methoxyethyl)methylamine and triethylamine were dissolved in dichloromethane and cooled to 0°C. N-(3-Dimethylaminopropyl)-N′-ethyl-carbodiimide hydrochloride was added and the reaction was stirred at 0°C and then at room temperature. (B) 1H NMR spectrum of compound 3, with specifications provided in “Materials and Methods” Section.
Figure 5
Figure 5
Additional characterization of GPR139 compounds using kinetic fluorescence measurements and concentration-response determination in calcium mobilization assays. (A–D) Examples for the kinetic of relative fluorescence units (RFU) for compound 1 and 4 and related controls, involving a two-step addition protocol. (A) Cellular fluorescence response to addition of buffer (approximately at time 0:00 min) and a second addition of buffer at 3:20 min. (B) Cellular fluorescence response to addition of the Ca2+ ionophore and reference compound for complete release of Ca2+ from intracellular stores, ionomycin. (C) Cellular response to addition of 10 μM compound 1 at time 0:00. (D) Cellular fluorescence in response to antagonist compound 4 (at 0:00, 50 μM) and addition of agonist compound 1 at EC85 concentration. (E–H) Normalized response (stimulation by agonist) for compound 1 (E) compound 2 (F), and compound 3 (G) in G-protein coupled receptor 139 (GPR139) Ca2+ mobilization assay. (H) Concentration-response (inhibition by antagonist) for compound 4.
Figure 6
Figure 6
Tyrosine-hydroxylase positive neurons in primary mesencephalic cultures. Pixels with an intensity above a set threshold that the image analysis software detects as TH-positive are shown in green; nuclei of TH-positive cells detected by the software are marked in light blue. Space bar: 50 μM.
Figure 7
Figure 7
Gpr139 is expressed in primary midbrain cultures. Results from quantitative polymerase chain reaction (PCR) showing c(t) values for expression of (A) the housekeeping gene Glyceraldehyde 3-phosphate dehydrogenase (GAPDH); Cyclophilin A; Gpr139 detected by two different primer pairs; and TH. (B) Expression of Gpr139 in the mouse fibroblast cell line NIH 3T3 and the mouse neuroblastoma cell line N2a and primary midbrain cultures (VM), normalized to Cyclophilin A. Shown are the mean values of the experiment run in triplicates. Error bars represent standard deviations of the mean.
Figure 8
Figure 8
Three different GPR139 surrogate agonists protect primary dopaminergic (DA) midbrain neurons against 1-methyl-4-phenyl-pyridinium ionMPP+ toxicity. Neuronal midbrain cultures were pretreated with 1 μM of either one of the agonists compound 1 (formula image), compound 2 (formula image), or compound 3 (formula image), or vehicle (formula image
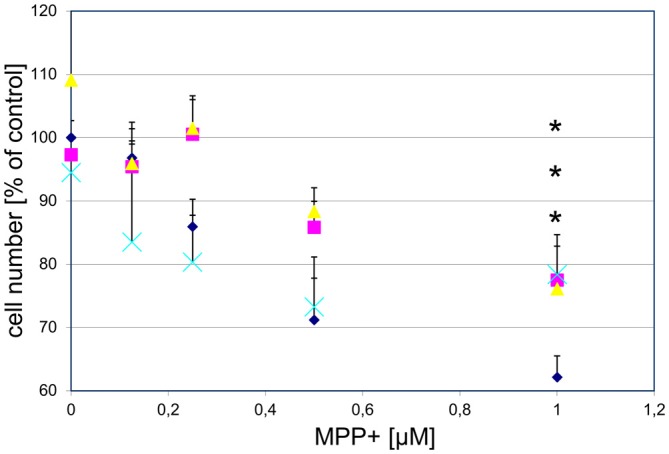
) for 1 h, followed by treatment with the indicated concentrations of MPP+ for 24 h. TH-positive neurons were counted and normalized to numbers under control conditions. At 1 μM MPP+, protection by all three different agonists was significant (*p ≤ 0.05). Each data point is calculated from 12 (0 μM and 1 μM MPP+ concentrations); 4 (0.125 μM); 7 (0.25 μM); or 8 (0.5 μM) independent measurements.
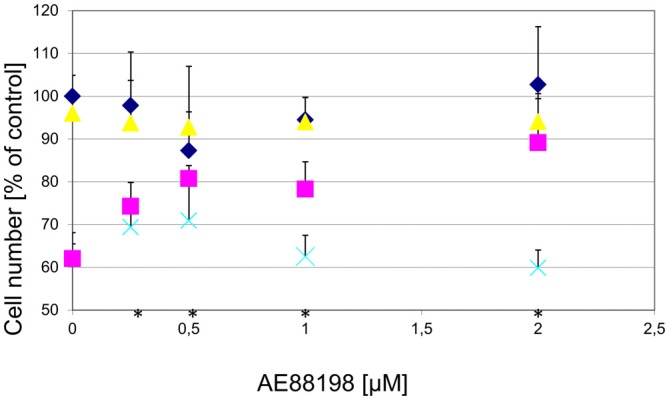
Figure 9
Figure 9
Protection of DA midbrain neurons against MPP+ toxicity by a GPR139 agonist is dose dependent and can be blocked by a GPR139 antagonist. Primary midbrain cultures were pretreated with the indicated amount of GPR139 agonist compound 3 and with either vehicle (formula image), or 1 μM MPP+ (formula image); or MPP+ with 10 μM of the antagonist compound 4 (formula image), or with the antagonist compound 4 alone (formula image). The number of TH-positive neurons was determined 24 h later and normalized to control conditions. Statistical significance compared to vehicle treated cells is indicated (*p < 0.05).
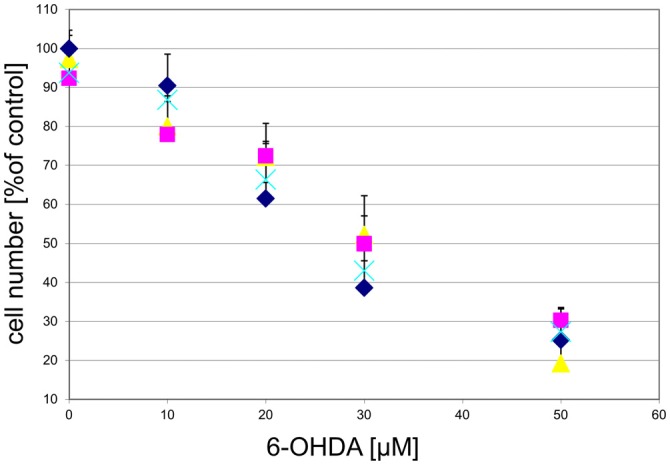
Figure 10
Figure 10
GPR139 agonists do not protect cultured DA midbrain neurons against 6-OHDA toxicity. Neuronal midbrain cultures were pretreated with 1 μM of either one of the agonists compound 1 (formula image), compound 2 (formula image), or compound 3 (formula image), or vehicle (formula image) for 1 h, followed by treatment with the indicated concentrations of 6-hydroxydopamine (6-OHDA) for 24 h. TH-positive neurons were counted and normalized to control numbers.
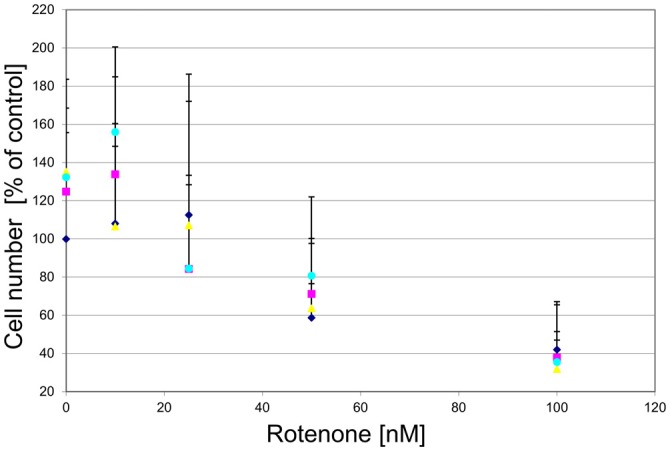
Figure 11
Figure 11
GPR139 agonists do not protect cultured DA midbrain neurons against rotenone toxicity. Mesencephalic cultures were treated with 1 μM of either one of the GPR139 agonists compound 1 (formula image), compound 2 (formula image), or compound 3 (formula image), or vehicle (formula image) for 1 h before exposing them to 0–100 nM of rotenone. Results are average of ± SEM (n = 4 independent experiments). TH-positive neurons were counted and normalized to control numbers (100%). At a given rotenone concentration, none of the values among the treatment groups were significantly different from one another.

References

    1. Aquino C. C., Fox S. H. (2015). Clinical spectrum of levodopa-induced complications. Mov. Disord. 30, 80–89. 10.1002/mds.26125 - DOI - PubMed
    1. Bastide M. F., Meissner W. G., Picconi B., Fasano S., Fernagut P. O., Feyder M., et al. . (2015). Pathophysiology of L-dopa-induced motor and non-motor complications in Parkinson’s disease. Prog. Neurobiol. 132, 96–168. 10.1016/j.pneurobio.2015.07.002 - DOI - PubMed
    1. Betarbet R., Sherer T. B., MacKenzie G., Garcia-Osuna M., Panov A. V., Greenamyre J. T. (2000). Chronic systemic pesticide exposure reproduces features of Parkinson’s disease. Nat. Neurosci. 3, 1301–1306. 10.1038/81834 - DOI - PubMed
    1. Blesa J., Przedborski S. (2014). Parkinson’s disease: animal models and dopaminergic cell vulnerability. Front. Neuroanat. 8:155. 10.3389/fnana.2014.00155 - DOI - PMC - PubMed
    1. Bywood P. T., Johnson S. M. (2003). Mitochondrial complex inhibitors preferentially damage substantia nigra dopamine neurons in rat brain slices. Exp. Neurol. 179, 47–59. 10.1006/exnr.2002.8044 - DOI - PubMed