SIRT5 Deficiency Enhances Susceptibility to Kainate-Induced Seizures and Exacerbates Hippocampal Neurodegeneration not through Mitochondrial Antioxidant Enzyme SOD2
- PMID: 27445698
- PMCID: PMC4922023
- DOI: 10.3389/fncel.2016.00171
SIRT5 Deficiency Enhances Susceptibility to Kainate-Induced Seizures and Exacerbates Hippocampal Neurodegeneration not through Mitochondrial Antioxidant Enzyme SOD2
Abstract
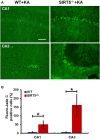
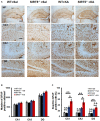
Epilepsy is a common and serious neurological disorder characterized by occurrence of recurrent spontaneous seizures, and emerging evidences support the association of mitochondrial dysfunction with epilepsy. Sirtuin 5 (SIRT5), localized in mitochondrial matrix, has been considered as an important functional modulator of mitochondria that contributes to ageing and neurological diseases. Our data shows that SIRT5 deficiency strikingly increased mortality rate and severity of response to epileptic seizures, dramatically exacerbated hippocampal neuronal loss and degeneration in mice exposed to Kainate (KA), and triggered more severe reactive astrogliosis. We found that the expression of mitochondrial SIRT5 of injured hippocampus was relatively up-regulated, indicating its potential contribution to the comparably increased survival of these cells and its possible neuroprotective role. Unexpectedly, SIRT5 seems not to apparently alter the decline of antioxidant enzymes superoxide dismutase 2 (SOD2) and glutathione peroxidase (GPx) in hippocampus caused by KA exposure in our paradigm, which indicates the protective role of SIRT5 on seizures and cellular degeneration might through different regulatory mechanism that would be explored in the future. In the present study, we provided strong evidences for the first time to demonstrate the association between SIRT5 and epilepsy, which offers a new understanding of the roles of SIRT5 in mitochondrial functional regulation. The neuroprotection of SIRT5 in KA-induced epileptic seizure and neurodegeneration will improve our current knowledge of the nature of SIRT5 in central nervous system (CNS) and neurological diseases.
Keywords: SIRT5; SOD2; Sirtuin; kainate; mitochondria; oxidative stress; reactive astrogliosis; seizures.
Figures


Similar articles
-
Protective role of SIRT5 against motor deficit and dopaminergic degeneration in MPTP-induced mice model of Parkinson's disease.Behav Brain Res. 2015 Mar 15;281:215-21. doi: 10.1016/j.bbr.2014.12.035. Epub 2014 Dec 23. Behav Brain Res. 2015. PMID: 25541039
-
Mitochondrial oxidative stress and increased seizure susceptibility in Sod2(-/+) mice.Free Radic Biol Med. 2004 Mar 1;36(5):542-54. doi: 10.1016/j.freeradbiomed.2003.11.029. Free Radic Biol Med. 2004. PMID: 14980699
-
Comparison of kainate-induced seizures, cognitive impairment and hippocampal damage in male and female mice.Life Sci. 2019 Sep 1;232:116621. doi: 10.1016/j.lfs.2019.116621. Epub 2019 Jun 30. Life Sci. 2019. PMID: 31269415
-
Mitochondrial dysfunction and oxidative stress in seizure-induced neuronal cell death.Acta Neurol Taiwan. 2010 Mar;19(1):3-15. Acta Neurol Taiwan. 2010. PMID: 20711885 Review.
-
The role of mitochondrial sirtuins in health and disease.Free Radic Biol Med. 2016 Nov;100:164-174. doi: 10.1016/j.freeradbiomed.2016.04.197. Epub 2016 May 6. Free Radic Biol Med. 2016. PMID: 27164052 Review.
Cited by
-
Fluorogenic probes for detecting deacylase and demethylase activity towards post-translationally-modified lysine residues.Chem Sci. 2021 Jan 7;12(7):2498-2503. doi: 10.1039/d0sc06551j. Chem Sci. 2021. PMID: 34164016 Free PMC article.
-
SIRT5-Mediated Desuccinylation of RAB7A Protects Against Cadmium-Induced Alzheimer's Disease-Like Pathology by Restoring Autophagic Flux.Adv Sci (Weinh). 2024 Aug;11(30):e2402030. doi: 10.1002/advs.202402030. Epub 2024 Jun 5. Adv Sci (Weinh). 2024. PMID: 38837686 Free PMC article.
-
Metabolic aspects of neuronal degeneration: From a NAD+ point of view.Neurosci Res. 2019 Feb;139:9-20. doi: 10.1016/j.neures.2018.07.001. Epub 2018 Jul 10. Neurosci Res. 2019. PMID: 30006197 Free PMC article. Review.
-
Activation and inhibition of sirtuins: From bench to bedside.Med Res Rev. 2025 Mar;45(2):484-560. doi: 10.1002/med.22076. Epub 2024 Aug 31. Med Res Rev. 2025. PMID: 39215785 Free PMC article. Review.
-
Krüppel-Like Factor 6 Silencing Prevents Oxidative Stress and Neurological Dysfunction Following Intracerebral Hemorrhage via Sirtuin 5/Nrf2/HO-1 Axis.Front Aging Neurosci. 2021 Jun 3;13:646729. doi: 10.3389/fnagi.2021.646729. eCollection 2021. Front Aging Neurosci. 2021. PMID: 34149393 Free PMC article.
References
-
- Ben-Ari Y., Tremblay E., Riche D., Ghilini G., Naquet R. (1981). Electrographic, clinical and pathological alterations following systemic administration of kainic acid, bicuculline or pentetrazole: metabolic mapping using the deoxyglucose method with special reference to the pathology of epilepsy. Neuroscience 6, 1361–1391. 10.1016/0306-4522(81)90193-7 - DOI - PubMed
-
- Bendotti C., Guglielmetti F., Tortarolo M., Samanin R., Hirst W. D. (2000). Differential expression of S100beta and glial fibrillary acidic protein in the hippocampus after kainic acid-induced lesions and mossy fiber sprouting in adult rat. Exp. Neurol. 161, 317–329. 10.1006/exnr.1999.7262 - DOI - PubMed
LinkOut - more resources
Full Text Sources
Other Literature Sources
Molecular Biology Databases

