. 2016 Jun 30:7:80.
doi: 10.3389/fendo.2016.00080. eCollection 2016.

Exercise Increases and Browns Muscle Lipid in High-Fat Diet-Fed Mice

Affiliations

Exercise Increases and Browns Muscle Lipid in High-Fat Diet-Fed Mice

Tiffany L Morton et al. Front Endocrinol (Lausanne). .

Abstract

Muscle lipid increases with high-fat feeding and diabetes. In trained athletes, increased muscle lipid is not associated with insulin resistance, a phenomenon known as the athlete's paradox. To understand if exercise altered the phenotype of muscle lipid, female C57BL/6 mice fed CTL or high-fat diet (HFD for 6 or 18 weeks) were further divided into sedentary or exercising groups (CTL-E or HFD-E) with voluntary access to running wheels for the last 6 weeks of experiments, running 6 h/night. Diet did not affect running time or distance. HFD mice weighed more than CTL after 18 weeks (p < 0.01). Quadriceps muscle TG was increased in running animals and in sedentary mice fed HFD for 18 weeks (p < 0.05). In exercised animals, markers of fat, Plin1, aP2, FSP27, and Fasn, were increased significantly in HFD groups. Ucp1 and Pgc1a, markers for brown fat, increased with exercise in the setting of high fat feeding. Fndc5, which encodes irisin, and CytC were sensitive to exercise regardless of diet. Plin5 was increased with HFD and unaffected by exercise; the respiratory exchange ratio was 15% lower in the 18-week HFD group compared with CTL (p < 0.001) and 10% lower in 18 weeks HFD-E compared with CTL-E (p < 0.001). Increased Ucp1 and Pgc1a in exercised muscle of running mice suggests that a beige/brown fat phenotype develops, which differs from the fat phenotype that induces insulin resistance in high fat feeding. This suggests that increased muscle lipid may develop a "brown" phenotype in the setting of endurance exercise training, a shift that is further promoted by HFD.

Keywords: brown adipose tissue; exercise; intramyocellular lipid; running.


Figures

Figure 1
Figure 1
Body weight and running distance during the short-term and long-term HFD experiments. (A) Weight in grams. (B) Average running distance in kilometer per day. (C) Weight in grams in long-term HFD experiment. (D) Average running distance in kilometer per day in long-term HFD experiment. (E) Calorimetry was used to measure the respiratory exchange ratio (RER) in the long-term, 18-week HFD, experiment 3 weeks after initiation of exercise. During calorimetry testing, mice did not have access to running wheels. (F) Fat mass via MRI (grams). (G) Lean mass via MRI (grams). Results expressed as means ± SEM. Statistical significance designated on graphs as follows: ● = trend (p-value <0.10); *p-value <0.05; **p-value <0.01; ***p-value <0.001; ****p-value <0.0001. aSignificant for diet effect by two-way ANOVA. bSignificant for exercise effect by two-way ANOVA.
Figure 2
Figure 2
Running exercise effect on triglyceride and fat formation markers in skeletal muscle. (A) Triglyceride content of quadriceps muscle normalized to mg of protein. (B) Skeletal muscle mRNA expression of FASN, aP2, FSP27, and FASN relative to GAPDH. (C,D) Triglyceride content and gene expression for 18wk experiment. Results expressed as means ± SEM relative to CTL. Statistical significance designated on graphs as follows: ● = trend (p-value <0.10); *p-value <0.05; **p-value <0.01; ***p-value <0.001; ****p-value <0.0001. aSignificant for diet effect by two-way ANOVA. bSignificant for exercise effect by two-way ANOVA.
Figure 3
Figure 3
Effects of diet and exercise on lipid droplet-associated markers. Skeletal muscle mRNA expression of ATGL, Plin3, Plin5, and ARFRP1 relative to GAPDH in the 18-week HFD mice. Results expressed as means ± SEM relative to CTL. Statistical significance designated on graphs as follows: ● = trend (p-value <0.10); *p-value <0.05; **p-value <0.01; ***p-value <0.001; ****p-value <0.0001. aSignificant for diet effect by two-way ANOVA. bSignificant for exercise effect by two-way ANOVA.
Figure 4
Figure 4
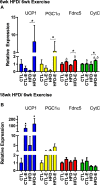
Running exercise effect on markers of brown adipose tissue in skeletal muscle. (A) Short-term HFD experiment skeletal muscle mRNA expression of UCP1, PGC1a, Fndc5, and CytC relative to GAPDH. (B) Results from long-term HFD experiment. Results expressed as means ± SEM relative to CTL. Statistical significance designated on graphs as follows: ● = trend (p-value <0.10); *p-value <0.05; **p-value <0.01; ***p-value <0.001; ****p-value <0.0001. aSignificant for diet effect by two-way ANOVA. bSignificant for exercise effect by two-way ANOVA.
Figure 5
Figure 5
Exercise increases UCP1 protein expression in skeletal muscle in the setting of high fat feeding. (A) Western blots of skeletal muscle UCP1 and aP2 of HFD-controls and runners in the short-term HFD experiment. (B) UCP1. (C) aP2. Statistical significance designated on graphs as follows: ● = trend (p-value <0.10); *p-value <0.05; **p-value <0.01; ***p-value <0.001; ****p-value <0.0001. aSignificant for diet effect by two-way ANOVA. bSignificant for exercise effect by two-way ANOVA.

Similar articles

Cited by

References

    1. Pan DA, Lillioja S, Milner MR, Kriketos AD, Baur LA, Bogardus C, et al. Skeletal muscle membrane lipid composition is related to adiposity and insulin action. J Clin Invest (1995) 96(6):2802–8.10.1172/JCI118350 - DOI - PMC - PubMed
    1. Jacob S, Machann J, Rett K, Brechtel K, Volk A, Renn W, et al. Association of increased intramyocellular lipid content with insulin resistance in lean nondiabetic offspring of type 2 diabetic subjects. Diabetes (1999) 48(5):1113–9.10.2337/diabetes.48.5.1113 - DOI - PubMed
    1. Goodpaster BH, Theriault R, Watkins SC, Kelley DE. Intramuscular lipid content is increased in obesity and decreased by weight loss. Metabolism (2000) 49(4):467–72.10.1016/S0026-0495(00)80010-4 - DOI - PubMed
    1. Bachmann OP, Dahl DB, Brechtel K, Machann J, Haap M, Maier T, et al. Effects of intravenous and dietary lipid challenge on intramyocellular lipid content and the relation with insulin sensitivity in humans. Diabetes (2001) 50(11):2579–84.10.2337/diabetes.50.11.2579 - DOI - PubMed
    1. Goodpaster BH, He J, Watkins S, Kelley DE. Skeletal muscle lipid content and insulin resistance: evidence for a paradox in endurance-trained athletes. J Clin Endocrinol Metab (2001) 86(12):5755–61.10.1210/jcem.86.12.8075 - DOI - PubMed