. 2016 Jun 22:7:968.
doi: 10.3389/fmicb.2016.00968. eCollection 2016.

Flow Cytometric and 16S Sequencing Methodologies for Monitoring the Physiological Status of the Microbiome in Powdered Infant Formula Production

Affiliations

Flow Cytometric and 16S Sequencing Methodologies for Monitoring the Physiological Status of the Microbiome in Powdered Infant Formula Production

Amir H P Anvarian et al. Front Microbiol. .

Abstract

The aim of this study was to develop appropriate protocols for flow cytometric (FCM) and 16S rDNA sequencing investigation of the microbiome in a powdered infant formula (PIF) production facility. Twenty swabs were collected from each of the three care zones of a PIF production facility and used for preparing composite samples. For FCM studies, the swabs were washed in 200 mL phosphate buffer saline (PBS). The cells were harvested by three-step centrifugation followed by a single stage filtration. Cells were dispersed in fresh PBS and analyzed with a flow cytometer for membrane integrity, metabolic activity, respiratory activity and Gram characteristics of the microbiome using various fluorophores. The samples were also plated on agar plates to determine the number of culturable cells. For 16S rDNA sequencing studies, the cells were harvested by centrifugation only. Genomic DNA was extracted using a chloroform-based method and used for 16S rDNA sequencing studies. Compared to the dry low and high care zones, the wet medium care zone contained a greater number of viable, culturable, and metabolically active cells. Viable but non-culturable cells were also detected in dry-care zones. In total, 243 genera were detected in the facility of which 42 were found in all three care zones. The greatest diversity in the microbiome was observed in low care. The genera present in low, medium and high care were mostly associated with soil, water, and humans, respectively. The most prevalent genera in low, medium and high care were Pseudomonas, Acinetobacter, and Streptococcus, respectively. The integration of FCM and metagenomic data provided further information on the density of different species in the facility.

Keywords: 16S sequencing; environmental sampling; flow cytometry; microbial physiology; microbial stress response; powdered infant formula (PIF); systems microbiology; viable but non-culturable (VBNC).


Figures
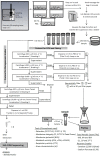
Figure 1
Figure 1
Schematic representation of the steps involved in sampling and sample preparation for flow cytometric and 16S rDNA sequencing studies.
Figure 2
Figure 2
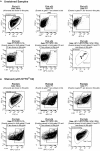
Gating strategy used in this study. Cells were acquired (A) before and (B) after staining with SYTO 62 dye. Based on Boolean logic, the events recorded within P1 (20,000 events) were passed through a series of gates (P2-P5) as shown in plots a(2)-a(5) (for unstained cells) and b(2)-b(5) (in the case of stained cells) to determine the number of noise particles (particles in gate P6 of plot a[6]; i.e., 79 noise particles) as well as cells of interest (particles in gate P6 of plot b[6] minus those shown in gate P6 of plot a[6], i.e., 17212–79 = 17133 cells).
Figure 3
Figure 3
Total viable count (log10 cells/cm2) based on the flow cytometry (FCM) and plate counting (CFU) techniques. For FCM, a cell was considered as viable if it could not be stained with either of PI or SYTOX Green Dead Stain, while for CFU, it formed a colony on nutrient agar plate at 37°C, 48 h post-inoculation. The FCM values are the same as those calculated in row N of Table 2. All the values are the mean ± SD of two technical replicates. Capital letters are used for comparing the FCM or CFU data between each zone, while lower-case letters compare the FCM and CFU values within each zone. Columns marked with similar capital or lower-case letters are not statistically significantly different based on unpaired two-tailed Student's t-test; p > 0.05) (Data from sampling in October 2015).
Figure 4
Figure 4
Recovery of stressed cells using catalase and sodium pyruvate. Samples were spread plated in duplicate on nutrient agar (NA), M9 Salt agar or Brain Heart Infusion agar (BHI) solid growth media (with or without catalase or SP) and incubated at either of 21, 30, or 37°C. For each temperature/sample combination (e.g., low care sample at 37°C) shown, the data are the mean ± SD (technical duplicate plating of a single sample) of the plate count obtained from all the plates that were subjected to the indicated parameter, regardless of the effects of others (n = 18). For instance, the plate count for the low care sample at 37°C (3.17 ± 0.17) is the mean ± SD of the plate counts for all the eighteen plates that were incubated at 37°C, regardless of the growth medium or supplementation. See Supplementary Table 4 for further information on the three-way interaction between temperature, media and supplemnetation variables for each sample (Data from sampling in May 2015). (**: p < 0.01; ****: p < 0.0001).
Figure 5
Figure 5
Schematic representation of the number of genera identified in each care zone. The size of each circle and the overlap areas are propotionate to the number of genera idnetified in that zone. The values outside the parantheses show the number of genera idenfied within the zone/area. The values within the parentheses show the total cells/cm2 and the percentage contribution of those genera to the overall microbiome of the PIF production unit. The total cell counts exclude the unpecified genera and/or species (2682, 540, and 819 cells/cm2 of unspecified bacteria in low, medium and high care zones, respectively). This Venn diagram was generated using the BioVenn software by Hulsen et al. (2008).
Figure 6
Figure 6
The number of cells for each species of (A) Acinetobacter, (B) Streptococcus and (C) Pseudomonas was determined by multiplying the percentage distribution of each species in each care zone (as determined by 16S rDNA sequencing) by the total cell count for the corresponding care zone (as determined by FCM) (Data from sampling in May 2015).

References

    1. Amann R. I., Binder B. J., Olson R. J., Chisholm S. W., Devereux R., Stahl D. A. (1990). Combination of 16S rRNA-targeted oligonucleotide probes with flow cytometry for analyzing mixed microbial populations. Appl. Environ. Microbiol. 56, 1919–1925. - PMC - PubMed
    1. Bang W., Drake M. A., Jaykus L. A. (2007). Recovery and detection of Vibrio vulnificus during cold storage. Food Microbiol. 24, 664–670. 10.1016/j.fm.2006.12.002 - DOI - PubMed
    1. Buzatu D. A., Moskal T. J., Williams A. J., Cooper W. M., Mattes W. B., Wilkes J. G. (2014). An integrated flow cytometry-based system for real-time, high sensitivity bacterial detection and identification. PLoS ONE 9:e94254. 10.1371/journal.pone.0094254 - DOI - PMC - PubMed
    1. Caporaso J. G., Kuczynski J., Stombaugh J., Bittinger K., Bushman F. D., Costello E. K., et al. . (2010). QIIME allows analysis of high-throughput community sequencing data. Nat. Methods 7, 335–336. 10.1038/nmeth.f.303 - DOI - PMC - PubMed
    1. Coenye T., Vandamme P. (2003). Intragenomic heterogeneity between multiple 16S ribosomal RNA operons in sequenced bacterial genomes. FEMS Microbiol. Lett. 228, 45–49. 10.1016/S0378-1097(03)00717-1 - DOI - PubMed

LinkOut - more resources