. 2016 Jun 24:7:983.
doi: 10.3389/fmicb.2016.00983. eCollection 2016.

Biogeographic Variation in Host Range Phenotypes and Taxonomic Composition of Marine Cyanophage Isolates

Affiliations

Biogeographic Variation in Host Range Phenotypes and Taxonomic Composition of Marine Cyanophage Isolates

China A Hanson et al. Front Microbiol. .

Abstract

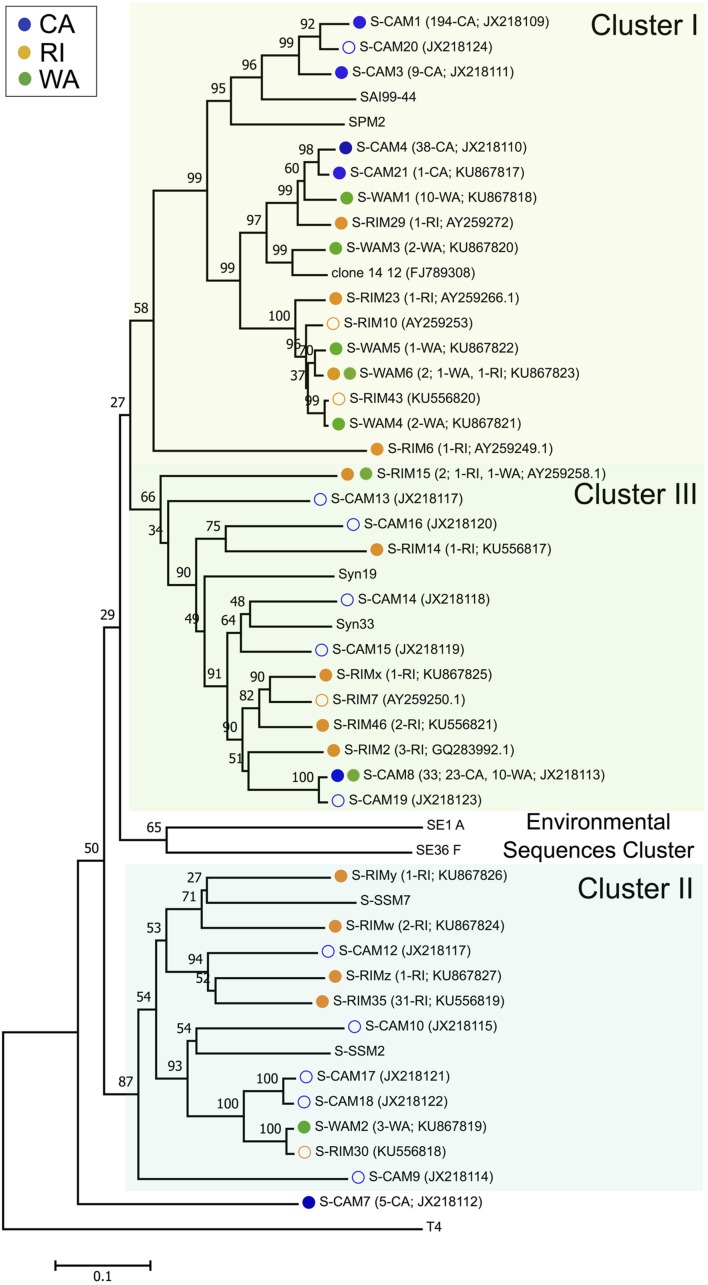
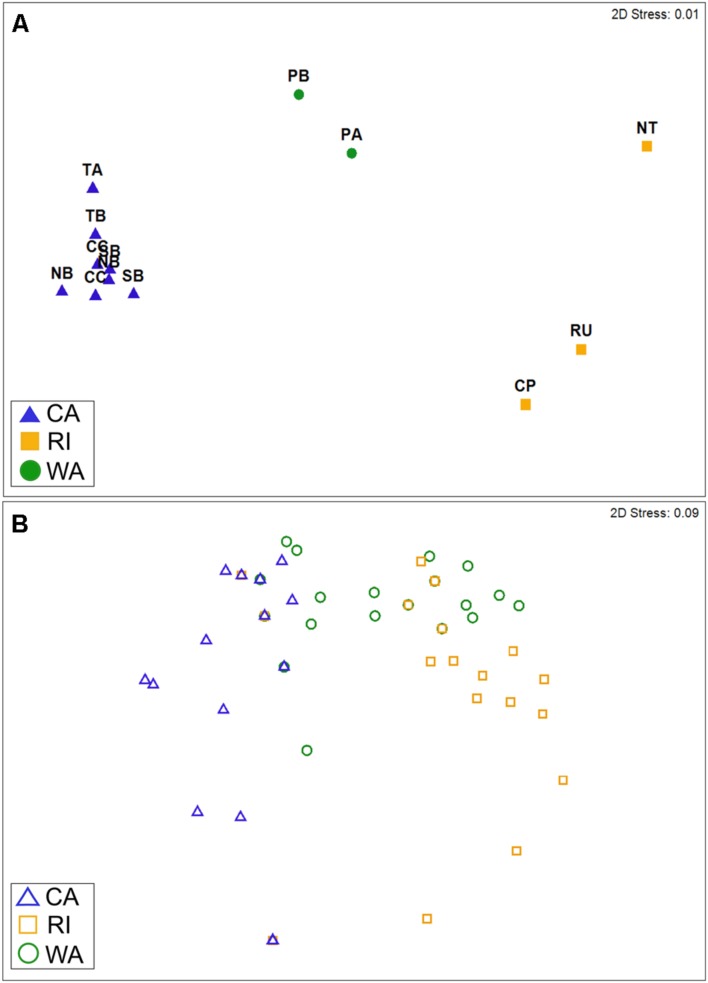
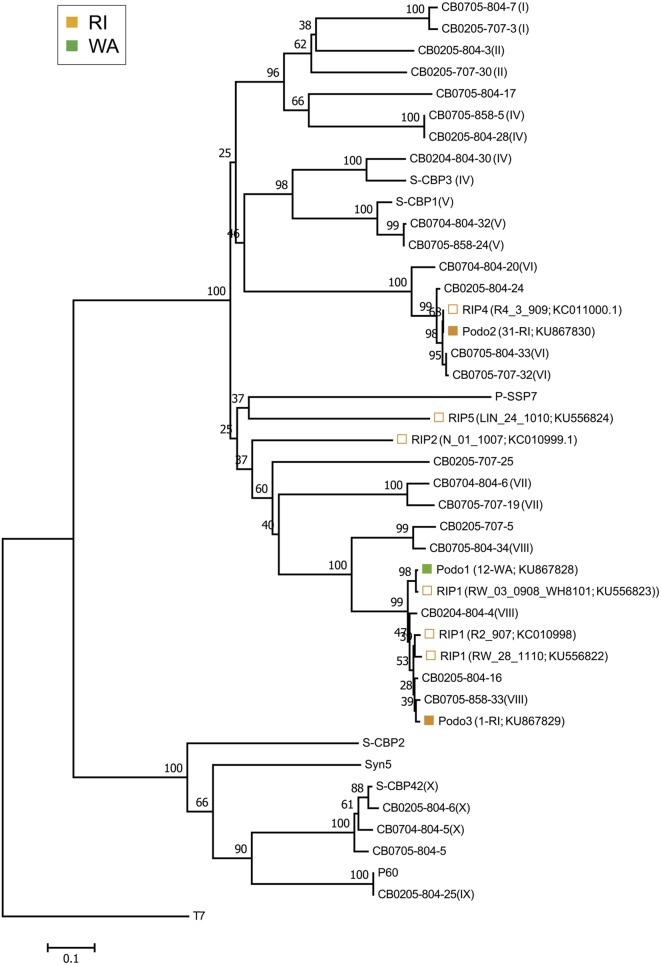
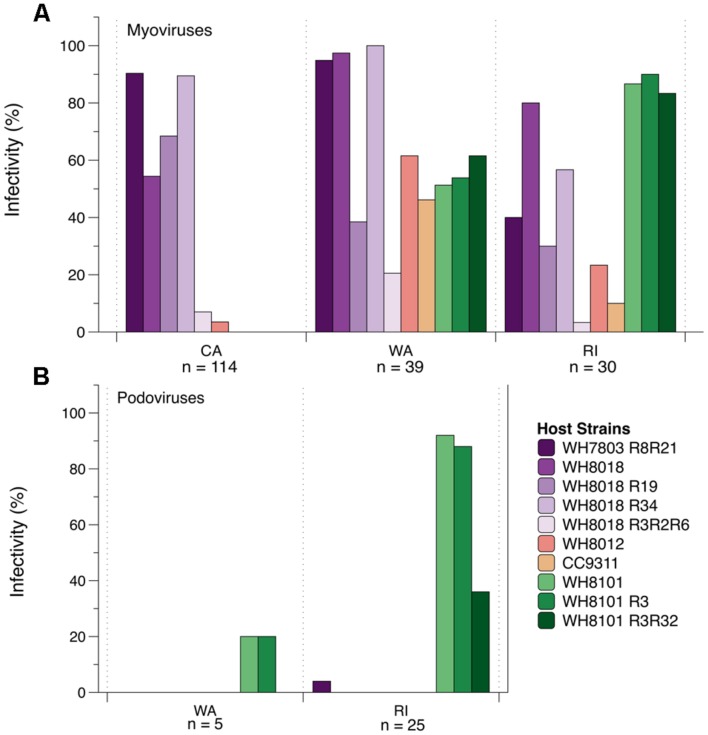
Despite the important role of phages in marine systems, little is understood about how their diversity is distributed in space. Biogeographic patterns of marine phages may be difficult to detect due to their vast genetic diversity, which may not be accurately represented by conserved marker genes. To investigate the spatial biogeographic structure of marine phages, we isolated over 400 cyanophages on Synechococcus host strain WH7803 at three coastal locations in the United States (Rhode Island, Washington, and southern California). Approximately 90% of the cyanophage isolates were myoviruses, while the other 10% were podoviruses. The diversity of isolates was further characterized in two ways: (i) taxonomically, using conserved marker genes and (ii) phenotypically, by testing isolates for their ability to infect a suite of hosts, or their "host range." Because host range is a highly variable trait even among closely related isolates, we hypothesized that host range phenotypes of cyanophage isolates would vary more strongly among locations than would taxonomic composition. Instead, we found evidence for strong biogeographic variation both in taxonomic composition and host range phenotypes, with little taxonomic overlap among the three coastal regions. For both taxonomic composition and host range phenotypes, cyanophage communities from California and Rhode Island were the most dissimilar, while Washington communities exhibited similarity to each of the other two locations. These results suggest that selection imposed by spatial variation in host dynamics influence the biogeographic distribution of cyanophages.

Keywords: Synechococcus; T4-like phage; biogeography; cyanophage; host range; marine; myovirus; podovirus.


Figures

FIGURE 1
FIGURE 1
Neighbor-joining nucleotide tree depicting phylogenetic relationships of isolated cyanomyovirus OTUs based on a 99% sequence similarity cutoff of the g20 gene. OTUs containing cyanomyovirus isolates collected in this study are denoted by solid symbols, while open symbols indicate OTUs previously observed at the CA or RI sites. Different colored circles indicate the location of origin (blue, CA; green, WA; and gold, RI) and OTUs consisting of isolates from multiple locations are indicated with two circles. All other taxa are reference sequences. The total number of isolates contained in each OTU is given in parentheses, followed by the location or the number of isolates from each location contained in that OTU, and the GenBank accession number. Major phylogenetic clusters are labeled according to Sullivan et al. (2008).
FIGURE 2
FIGURE 2
Non-metric multi-dimensional scaling plots depicting similarity in cyanomyovirus isolates by geographic location based on (A) taxonomic composition (Bray–Curtis similarity of OTU composition) or (B) host range phenotypes. (A) Points represent the OTU composition of isolated cyanomyoviruses in each site. For CA, multiple points for each site represent different sampling dates. (B) Points represent the host range of individual isolates (n = 213) and are shown as open symbols to clarify overlaps (many isolates had identical host range profiles and therefore are completely overlapping in the plot). In both panels, points that are farther apart are more dissimilar from each other in terms of their OTU composition (A) or host range phenotype (B).
FIGURE 3
FIGURE 3
Neighbor-joining nucleotide tree depicting phylogenetic relationships of isolated cyanopodovirus OTUs based on a 98% sequence similarity cutoff of the DNA polymerase gene. OTUs-containing cyanopodovirus isolates collected in this study are denoted by solid symbols. Open symbols indicate OTUs previously observed at the RI sites; these are followed by isolate number and GenBank accession number in parentheses. All other taxa represent reference sequences, some of which indicate their phylogenetic subcluster as defined by Huang et al. (2010) as Roman numerals in parentheses. For the podovirus OTUs found in this study, the total number of isolates followed by the source location and GenBank accession number are shown in parentheses. Note that at 98% nucleotide similarity, the Podo1 and the Podo2 OTUs are identical to RIP1_V08_3016_908 and RIP4, respectively, but were included separately for emphasis.
FIGURE 4
FIGURE 4
The percent ability of isolated cyanomyoviruses (A) and cyanopodoviruses (B) from each geographic location to infect 10 different Synechococcus host strains.

References

    1. Acinas S. G., Marcelino L. A., Klepac-Ceraj V., Polz M. F. (2004). Divergence and redundancy of 16S rRNA sequences in genomes with multiple rrn operons. J. Bacteriol. 186 2629–2635. 10.1128/Jb.186.9.2629-2635.2004 - DOI - PMC - PubMed
    1. Anderson M. J., Walsh D. C. I. (2013). PERMANOVA, ANOSIM, and the Mantel test in the face of heterogeneous dispersions: what null hypothesis are you testing? Ecol. Monogr. 83 557–574. 10.1890/12-2010.1 - DOI
    1. Angly F., Youle M., Nosrat B., Srinagesh S., Rodriguez-Brito B., Mcnairnie P., et al. (2009). Genomic analysis of multiple Roseophage SIO1 strains. Environ. Microbiol. 11 2863–2873. 10.1111/j.1462-2920.2009.02021.x - DOI - PubMed
    1. Angly F. E., Felts B., Breitbart M., Salamon P., Edwards R. A., Carlson C., et al. (2006). The marine viromes of four oceanic regions. PLoS Biol. 4 2121–2131. 10.1371/journal.pbio.0040368 - DOI - PMC - PubMed
    1. Avrani S., Schwartz D. A., Lindell D. (2012). Virus-host swinging party in the oceans: incorporating biological complexity into paradigms of antagonistic coexistence. Mob. Genet. Elements 2 88–95. 10.4161/mge.20031 - DOI - PMC - PubMed

LinkOut - more resources