. 2016 Jun 23:7:905.
doi: 10.3389/fpls.2016.00905. eCollection 2016.

Gibberellin-Stimulation of Rhizome Elongation and Differential GA-Responsive Proteomic Changes in Two Grass Species

Affiliations

Gibberellin-Stimulation of Rhizome Elongation and Differential GA-Responsive Proteomic Changes in Two Grass Species

Xiqing Ma et al. Front Plant Sci. .

Abstract

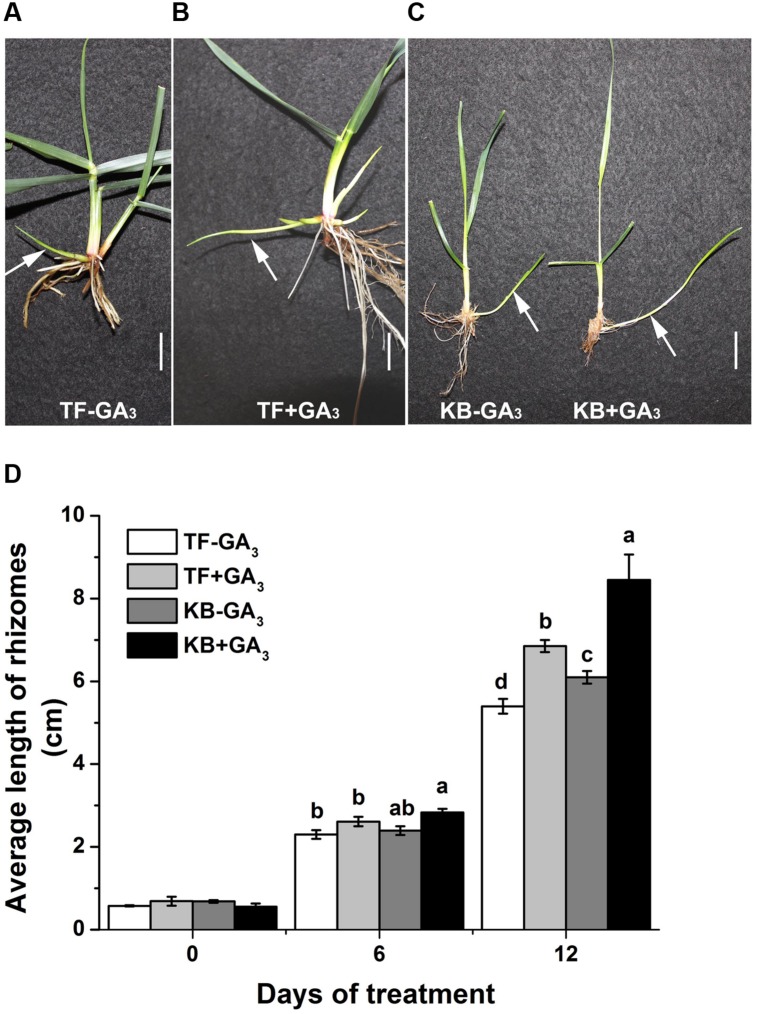
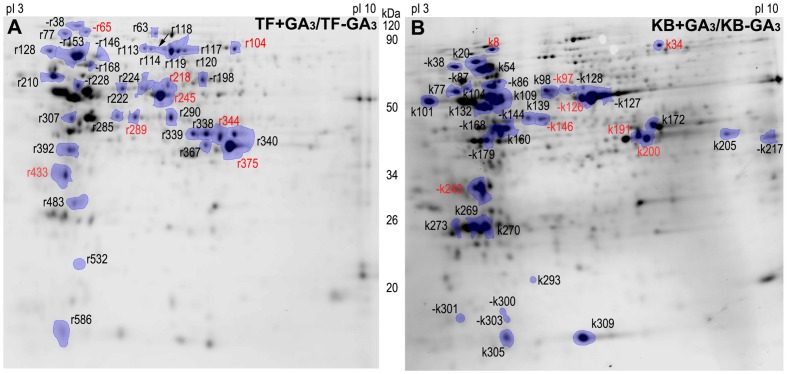
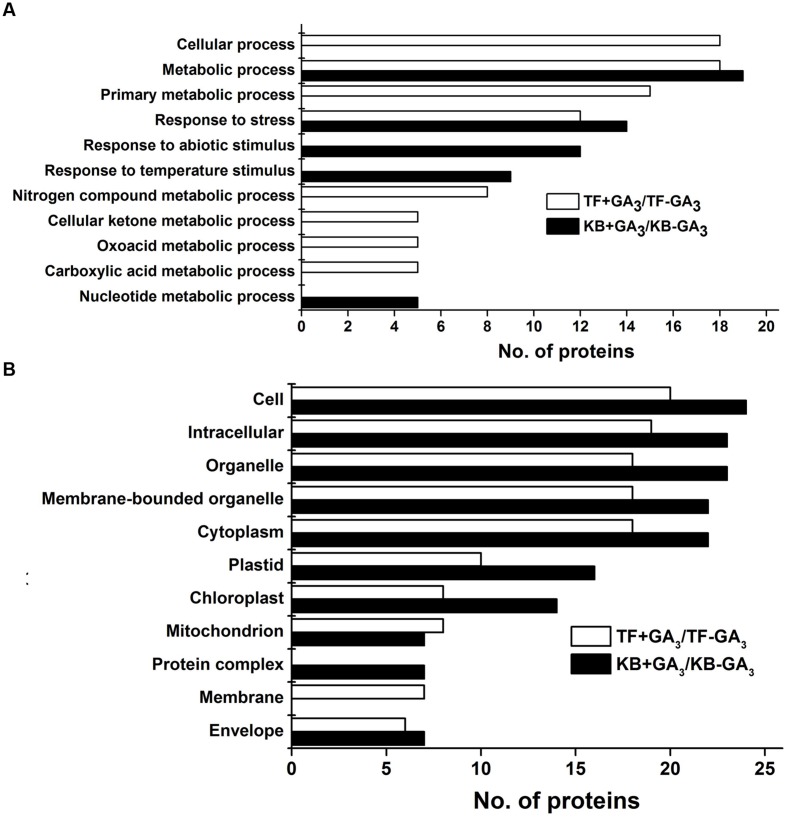
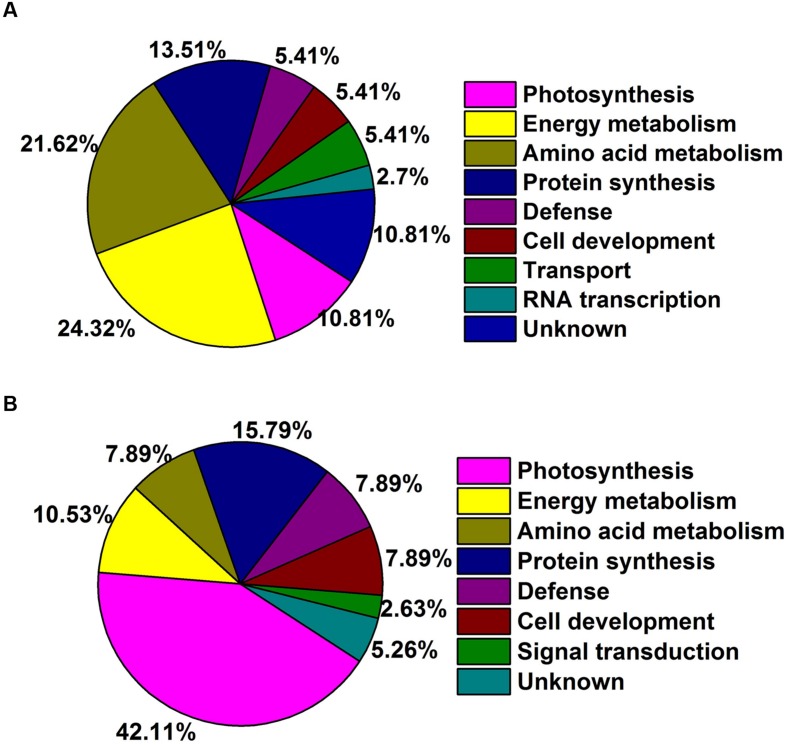
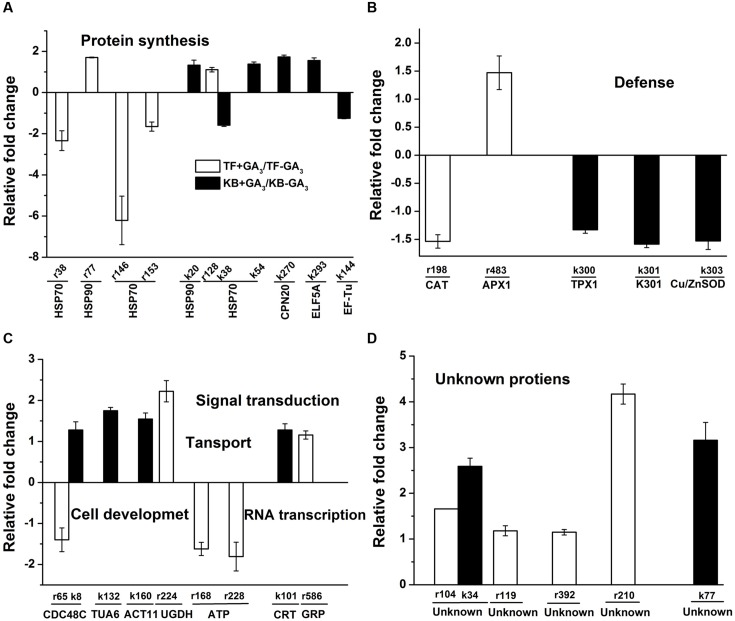
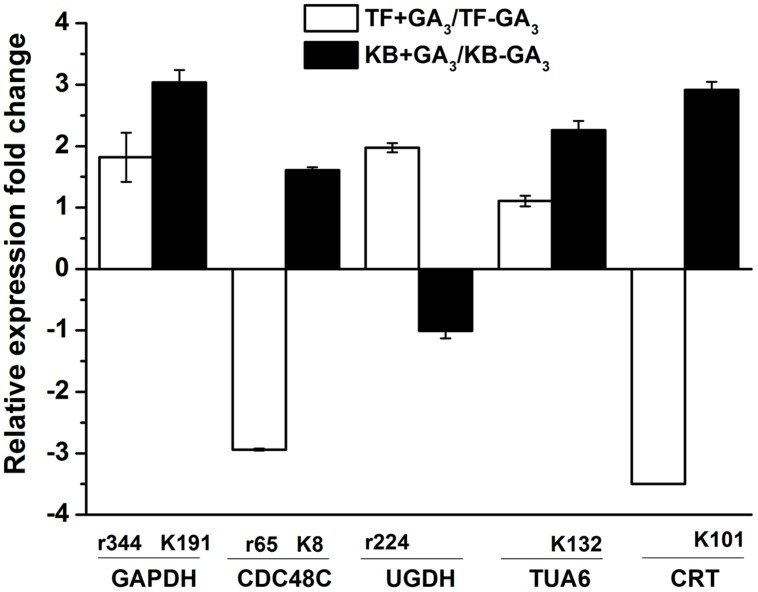
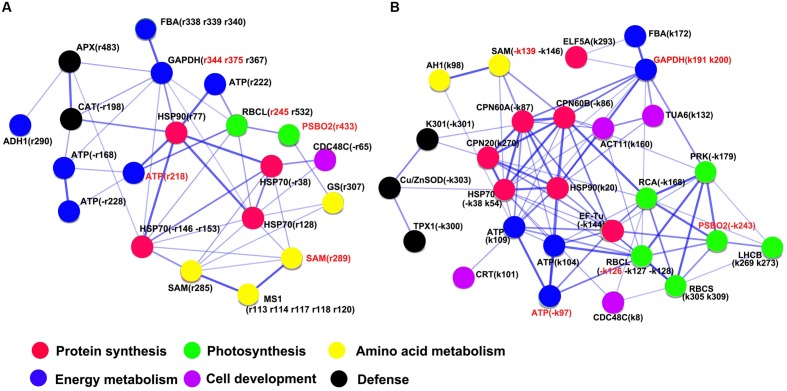
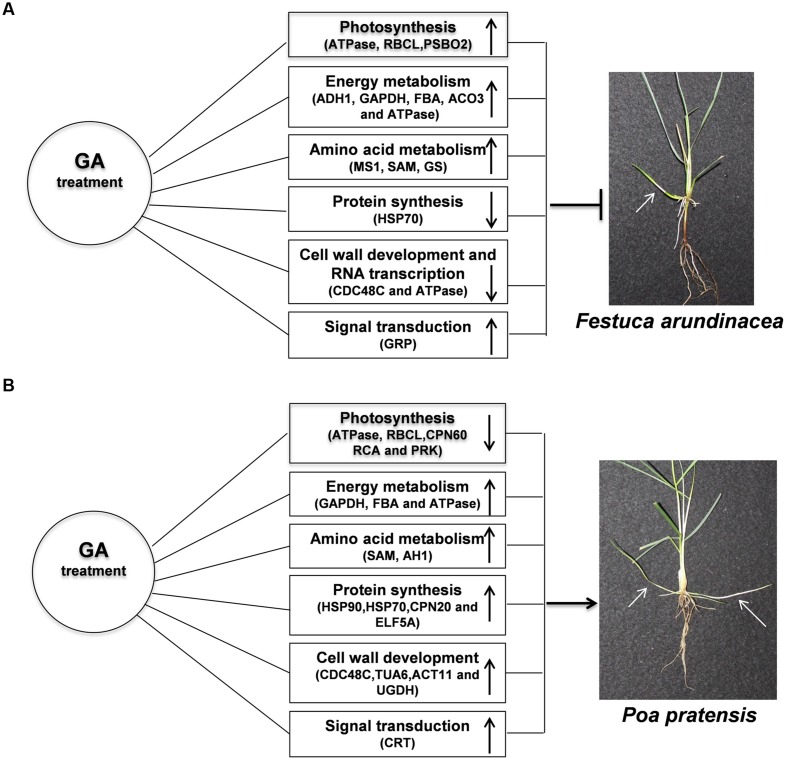
Rapid and extensive rhizome development is a desirable trait for perennial grass growth and adaptation to environmental stresses. The objective of this study was to determine proteomic changes and associated metabolic pathways of gibberellin (GA) -regulation of rhizome elongation in two perennial grass species differing in rhizome development. Plants of a short-rhizome bunch-type tall fescue (TF; Festuca arundinacea; 'BR') and an extensive rhizomatous Kentucky bluegrass (KB; Poa pratensis; 'Baron') were treated with 10 μM GA3 in hydroponic culture in growth chambers. The average rhizome length in KB was significantly longer than that in TF regardless of GA3 treatment, and increased significantly with GA3 treatment, to a greater extent than that in TF. Comparative proteomic analysis using two-dimensional electrophoresis and mass spectrometry was performed to further investigate proteins and associated metabolic pathways imparting increased rhizome elongation by GA. A total of 37 and 38 differentially expressed proteins in response to GA3 treatment were identified in TF and KB plants, respectively, which were mainly involved in photosynthesis, energy and amino acid metabolism, protein synthesis, defense and cell development processes. Accelerated rhizome elongation in KB by GA could be mainly associated with the increased abundance of proteins involved in energy metabolism (glyceraldehyde-3-phosphate dehydrogenase, fructose-bisphosphate aldolase, and ATP synthase), amino acid metabolism (S-adenosylmethionine and adenosylhomocysteinase), protein synthesis (HSP90, elongation factor Tu and eukaryotic translation initiation factor 5A), cell-wall development (cell dividion cycle protein, alpha tubulin-2A and actin), and signal transduction (calreticulin). These proteins could be used as candidate proteins for further analysis of molecular mechanisms controlling rhizome growth.

Keywords: Kentucky bluegrass; gibberellic acid; hydroponics; plant proteomics; tall fescue.


Figures

FIGURE 1
FIGURE 1
Rhizomatous Phenotypes of the tall fescue (TF) and Kentucky bluegrass (KB) (A), and average length of rhizomes in greenhouse conditions (B). The values represent the mean ± SE of 30 rhizomes. Columns marked with different letters indicated significant differences among treatments based on the LSD value (p ≤ 0.05). Bar represents 2 cm.
FIGURE 2
FIGURE 2
Effects of GA3 on the rhizome growth in perennial grass. (A,B) Rhizomatous phenotypes of TF with GA3 treatment in hydroponics at 12 days in growth chamber, white arrow indicated rhizomes. Bar represents 2 cm. (C) Rhizomatous phenotypes of KB with GA3 treatment in hydroponics at 12 days in growth chamber, white arrow indicated rhizomes. Bar represents 2 cm. (D) Average length of rhizomes in hydroponics. The values represent the mean ± SE of 30 rhizomes. Columns marked with different letters indicated significant differences among treatments at a given day based on the LSD value (p ≤ 0.05).
FIGURE 3
FIGURE 3
Two-dimensional SDS-PAGE gels of rhizome with GA3 treatment in TF (A) and KB (B). Differentially expressed proteins (DEPs) were marked between treatments, each treatment with at least four repeats gels (p ≤ 0.05). “–” indicates protein down-regulated with GA3 treatment compared with the untreated control. Red color represents common regulation proteins between TF and KB.
FIGURE 4
FIGURE 4
Cluster analysis of DEPs in rhizomes with GA3 treatment in TF and KB. Biological process (A) and cellular component (B) were analyzed against the Arabidopsis database (http://bioinfo.cau.edu.cn/agriGO/analysis.php; threshold: -log10 ≥ 4).
FIGURE 5
FIGURE 5
Functional categories DEPs of rhizomes response to GA3 treatment in TF (A) and KB (B) based on Bevan et al. (1998) categorization. Percentages based on total identified proteins, including both up and down-regulated proteins.
FIGURE 6
FIGURE 6
Up-regulation and down-regulation of protein spots in response to GA3 treatment represented as fold change compared to the untreated control. Charts are organized by the functional category of protein spots, and include Photosynthesis (A), Energy metabolism (B), Amino acid metabolism (C). Spot numbers correspond to the spot numbers in Supplementary Table S2 and Figure 3 that are the protein spots with significantly altered accumulation according Fischer’s LSD (p ≤ 0.05). The values represent mean ± SE (n = 4 replicates per treatment).
FIGURE 7
FIGURE 7
Up-regulation and down-regulation of protein spots in response to GA3 treatment represented as fold change compared to the control treatment. Charts are organized by the functional category of protein spots, and include protein synthesis (A), defense (B), regulatory related proteins (C), and unknown (D) functions. Spot numbers correspond to the spot numbers in Supplementary Table S2 and Figure 3 that are the protein spots with significantly altered accumulation according Fischer’s LSD (p ≤ 0.05). The values represent mean ± SE (n = 4 replicates per treatment).
FIGURE 8
FIGURE 8
Gene expression levels of the DEPs. Charts are organized by relative expression fold change of corresponding protein spots in response to GA3 treatment represented as fold change compared to the control treatment. The values represent mean ± SE (n = 4 replicates per treatment).
FIGURE 9
FIGURE 9
Network of putative protein–protein interactions with GA3 treatment in TF (A) and KB (B) compared to the control using the STRING 10.0 pathway analyzer. The circles represent overrepresented proteins. The blue lines represent the putative interaction between proteins. The density of edges represents confidence score of putative functional association. Spot numbers correspond to the spot numbers in Supplementary Table S2 and Figure 3 that are the protein spots with significantly altered accumulation (p < 0.05).
FIGURE 10
FIGURE 10
Model for GA-responsive rhizomes elongation of TF (A) and KB (B). White arrows indicated rhizomes.

References

    1. Bevan M., Bancroft I., Bent E., Love K., Goodman H., Dean C., et al. (1998). Analysis of 1.9 Mb of contiguous sequence from chromosome 4 of Arabidopsis thaliana. Nature 391 485–488. 10.1038/35140 - DOI - PubMed
    1. Bradford M. M. (1976). A rapid and sensitive method for the quantitation of microgram quantities of protein utilizing the principle of protein-dye binding. Anal. Biochem. 72 248–254. 10.1016/0003-2697(76)90527-3 - DOI - PubMed
    1. Cheng L., Li S., Yin J., Li L., Chen X. (2013). Genome-wide analysis of differentially expressed genes relevant to rhizome formation in lotus root (Nelumbo nucifera Gaertn). PLoS ONE 8:e67116 10.1371/journal.pone.0067116 - DOI - PMC - PubMed
    1. Ding C., You J., Wang S., Liu Z., Li G., Wang Q., et al. (2012). A proteomic approach to analyze nitrogen-and cytokinin-responsive proteins in rice roots. Mol. Biol. Rep. 39 1617–1626. 10.1007/s11033-011-0901-4 - DOI - PubMed
    1. Fang X. P., Ma H. S., Lu D. Z., Yu H., Lai W., Ruan S. (2011). Comparative proteomics analysis of proteins expressed in the I-1 and I-2 internodes of strawberry stolons. Proteome Sci. 9 26 10.1186/1477-5956-9-26 - DOI - PMC - PubMed