. 2016:2016:2478324.
doi: 10.1155/2016/2478324. Epub 2016 Jul 3.

Perfusion Angiography in Acute Ischemic Stroke

Affiliations

Perfusion Angiography in Acute Ischemic Stroke

Fabien Scalzo et al. Comput Math Methods Med. 2016.

Abstract

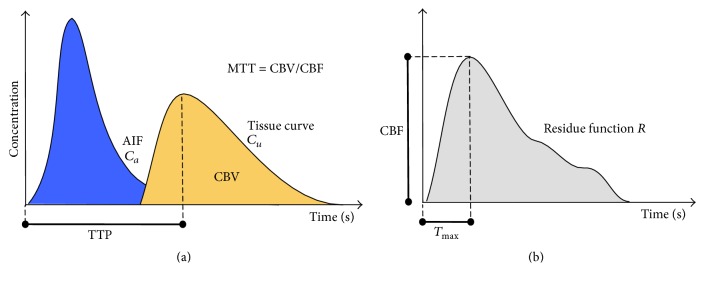
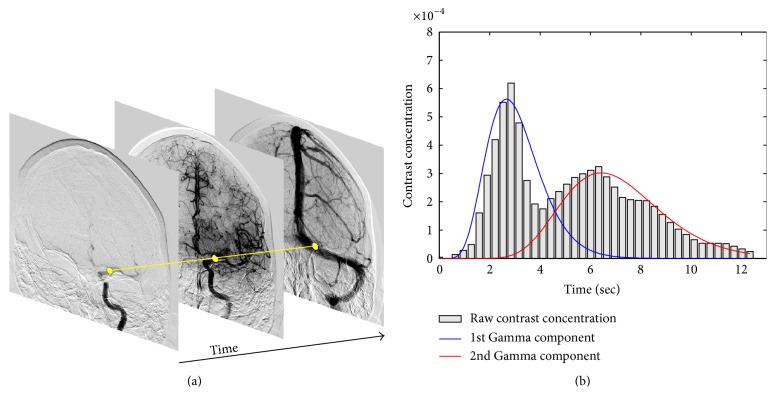
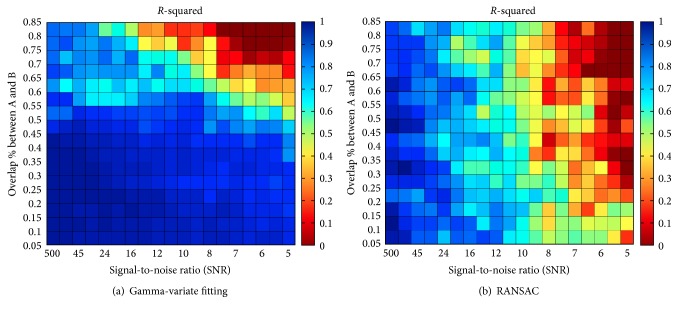
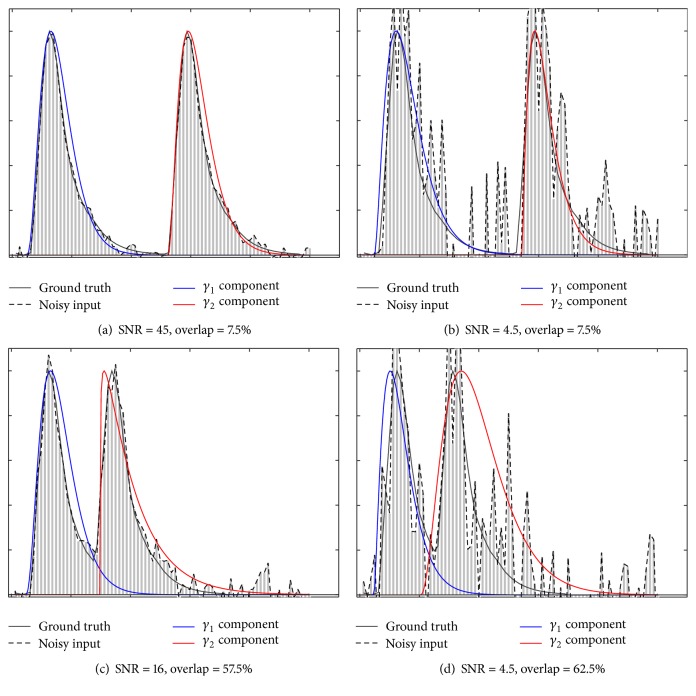
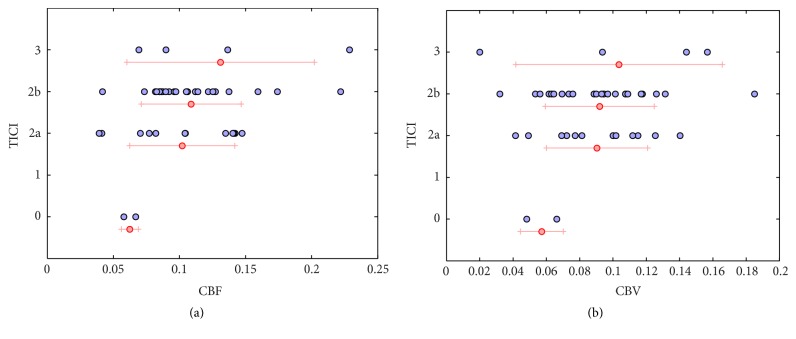
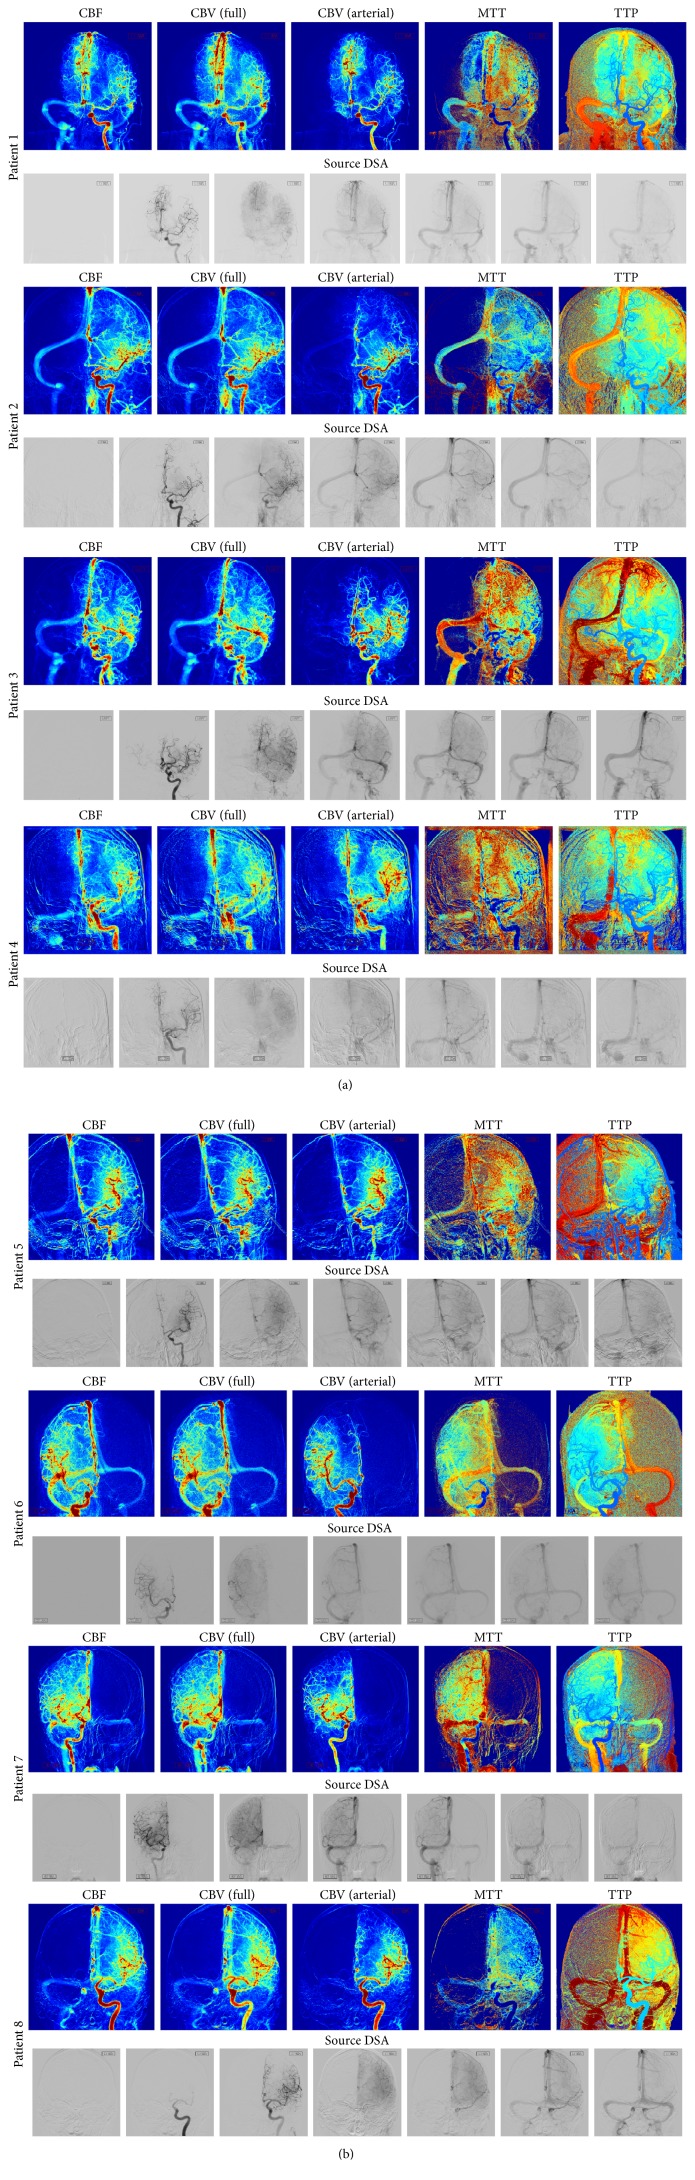
Visualization and quantification of blood flow are essential for the diagnosis and treatment evaluation of cerebrovascular diseases. For rapid imaging of the cerebrovasculature, digital subtraction angiography (DSA) remains the gold standard as it offers high spatial resolution. This paper lays out a methodological framework, named perfusion angiography, for the quantitative analysis and visualization of blood flow parameters from DSA images. The parameters, including cerebral blood flow (CBF) and cerebral blood volume (CBV), mean transit time (MTT), time-to-peak (TTP), and T max, are computed using a bolus tracking method based on the deconvolution of the time-density curve on a pixel-by-pixel basis. The method is tested on 66 acute ischemic stroke patients treated with thrombectomy and/or tissue plasminogen activator (tPA) and also evaluated on an estimation task with known ground truth. This novel imaging tool provides unique insights into flow mechanisms that cannot be observed directly in DSA sequences and might be used to evaluate the impact of endovascular interventions more precisely.


Figures

Figure 1
Figure 1
Illustration of a tissue concentration-time curve C u (yellow) with respect to an arterial input function (AIF) C a (blue). The deconvolution of the tissue curve C u with C a removes the dependence on the AIF and produces the residue function R (b). CBF is extracted at the maximum value reached at T max, while MTT is calculated as CBV/CBF, where CBV is determined as the area under the tissue curve (yellow). Because of the presence of arterial delays in stroke patients, the residue function is not always maximal at t = 0 but might be maximal after a delay (T max).
Figure 2
Figure 2
The bar graph of the contrast concentration-time curve (b) is shown for a specific location in a DSA sequence (shown in yellow on (a)). Two contrast passages can be observed in the concentration-time curve due to the overlap of the vessels. By applying the proposed method based on the EM algorithm, we are able to retrieve the individual components (represented by blue and red curves) using a Gamma mixture representation.
Figure 3
Figure 3
Illustration of the R-squared correlation coefficient between the estimated Gamma components and the ground truth for various levels of Gaussian white noise in terms of signal-to-noise ratio (SNR) and percentage of overlap between the two original components. The results are reported for the Gamma-variate method (a) and the RANSAC algorithm (b).
Figure 4
Figure 4
Illustration of the Gamma fitting process to recover two components for 4 different combinations of noise and overlap. Components γ 1 and  γ 2 are shown in blue and red and were estimated using the EM-based Gamma-variate fitting (Section 2.5) based on the noisy input depicted by the dashed line.
Figure 5
Figure 5
Scatter plots representing the perfusion angiography CBV and CBF versus TICI score. Average and standard deviation for specific TICI values are depicted by red lines.
Figure 6
Figure 6
(a) Parametric maps computed for 4 patients. For each patient, the perfusion parameters are illustrated, including CBF, CBV (full) (computed over the entire arteriovenous cycle), CBV (arterial) (computed over the arterial phase), MTT, and TTP. The source DSA is shown on the bottom row of each patient. (b) Parametric maps computed for 4 patients. For each patient, the perfusion parameters are illustrated, including CBF, CBV (full) (computed over the entire arteriovenous cycle), CBV (arterial) (computed over the arterial phase), MTT, and TTP. The source DSA is shown on the bottom row of each patient.

References

    1. Moniz A. Diagnostic des Tumeurs Cérébrales et Épreuve de L'encéphalographie Artérielle. Masson et Cie; 1931.
    1. Frost M. M., Fisher H. D., Nudelman S., Roehrig H. A digital video acquisition system for extraction of subvisual information in diagnostic medical imaging. Proceedings of SPIE. 1977;127:208–215.
    1. Ovitt T. W., Capp M. P., Fisher H. D., et al. The development of a digital video subtraction system for intravenous angiography. Proceedings of the Noninvasive Cardiovascular Measurements; pp. 61–66.
    1. Ovitt T. W., Christenson P. C., Fisher H. D., III, et al. Intravenous angiography using digital video subtraction: X-ray imaging system. American Journal of Roentgenology. 1980;135(6):1141–1144. doi: 10.2214/ajr.135.6.1141. - DOI - PubMed
    1. Tomsick T. TIMI, TIBI, TICI: I came, I saw, I got confused. American Journal of Neuroradiology. 2007;28(2):382–384. - PMC - PubMed

MeSH terms

Substances