Review
. 2016 Jun;16(65):135-44.
doi: 10.15557/JoU.2016.0015. Epub 2016 Jun 29.

Physiological basis in the assessment of myocardial mechanics using speckle-tracking echocardiography 2D. Part I

Affiliations
Review

Physiological basis in the assessment of myocardial mechanics using speckle-tracking echocardiography 2D. Part I

Wojciech Mądry et al. J Ultrason. 2016 Jun.

Abstract

In this paper, the authors attempt to concisely present the anatomical and pathophysiological bases as well as the principles for echocardiographic evaluation of mechanical aspects of cardiac function based on speckle tracking method. This technique uses a phenomenon involving the formation of characteristic image units, referred to as speckles or acoustic markers, which are stable during cardiac cycle, on a two-dimensional echocardiographic picture. Changes in the position of these speckles throughout the cardiac cycle, which are monitored and analyzed semi-automatically by a computer system, reflect deformation of both, cardiac ventricle as a whole as well as its individual anatomical segments. The values of strain and the strain rate, as well as the range and velocity of the movement of these markers, which are in close relationship with multiple hemodynamic parameters, can be visualized as various types of charts - linear, two- and three-dimensional - as well as numerical values, enabling deeper insight into the mechanical and hemodynamic aspects of cardiac function in health and disease. The use of information obtained based on speckle tracking echocardiography allows to understand previously unclear mechanisms of physiological and pathophysiological processes. The first part of the study discusses the formation of a two-dimensional ultrasound image and the speckles, as well as the technical aspects of tracking their movement. The second part presents in more detail the methodology of speckle-tracking echocardiography, the characteristic abnormalities of cardiac mechanics presenting in different clinical entities, and the limitations related to given clinical and technical issues.

W niniejszej pracy autorzy podejmują próbę zwięzłego przedstawienia anatomicznych i patofizjologicznych podstaw oraz zasad echokardiograficznej oceny mechanicznych aspektów pracy serca w oparciu o metodę śledzenia markerów akustycznych. Metoda ta wykorzystuje zjawisko powstawania w dwuwymiarowym obrazie echokardiograficznym charakterystycznych, niezmieniających się w czasie jednostek obrazowych, określanych mianem plamek lub markerów akustycznych. Zmiany położenia plamek, obserwowane i analizowane półautomatycznie w trakcie całego cyklu serca przez system komputerowy, odzwierciedlają odkształcenie zarówno całej komory, jak i jej poszczególnych segmentów anatomicznych. Wartości odkształcenia, tempa odkształcenia oraz zakresu i prędkości ruchu markerów, pozostające w ścisłym związku z różnorodnymi parametrami hemodynamicznymi, mogą być prezentowane graficznie jako różnego rodzaju wykresy (liniowe, dwu- i trójwymiarowe) oraz wartości liczbowe, co umożliwia pogłębiony wgląd w mechaniczne i hemodynamiczne aspekty funkcji serca w stanach zdrowia i choroby. Wykorzystanie informacji płynących ze śledzenia markerów akustycznych umożliwia zrozumienie dotychczas niejasnych procesów fizjologicznych i patofizjologicznych. W pierwszej części pracy omówiono powstawanie ultrasonograficznego obrazu dwuwymiarowego i markerów akustycznych oraz techniczne aspekty analizy ich ruchu. W drugiej części przedstawiono bardziej szczegółowo metodykę badania za pomocą techniki śledzenia markerów akustycznych, omówiono charakterystyczne zaburzenia mechaniki mięśnia serca w różnych stanach klinicznych, a także wskazano ograniczenia metody spowodowane kwestiami technicznymi oraz problemami występującymi specyficznie w niektórych chorobach.

Keywords: myocardial strain; myocardial strain rate; speckle tracking echocardiography; ventricular function.


Figures

Fig. 1
Fig. 1
Apical four-chamber view, late systolic phase. The image is used to determine the longitudinal strain. The internal – endocardial border of the left ventricle was outlined manually by an investigator, then the system generated the external line delineating the epicardial border and the RV endocardial septal surface as well as the midline, delineating the middle myocardial layer. This was followed by a manual adjustment of the external border to the actual epicardial border and the septum. Furthermore, the system automatically ‘smoothed’ the ROI image borders during strain analysis. The region of interest was automatically divided into six equal segments corresponding to anatomical segments, each represented by a different color. Line charts for segmental strain generated as a result of analysis are in colors corresponding to the individual segments in the 2D image. The longitudinal strain component is analyzed along directions tangential to the above described lines defining the ROI (arrows). The points move closer to each other during systole and move away from each other during diastole. The degree of this deformation is expressed as strain. The shortening of the individual segments is coded red (negative strain), while their extension is coded blue (positive strain). The intense red color distributed uniformly along the entire analyzed region indicates advanced, final phase of the process of shortening of the investigated segments. Uniform color intensity in all segments indicated normal synergistic systolic LV function in a given patient
Fig. 2
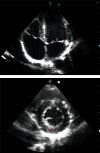
Fig. 2
Two-dimensional four-chamber view (A) and a cross section of the left ventricle at the level of the papillary muscles (B), reflecting LV muscle fiber arrangement. Circumferentially oriented muscle fibers (perpendicular to the ultrasonic beam), located in the middle layer, reflect the ultrasonic waves more intensely than the oblique fibers, located in the external LV wall layers, which is expressed in the formation of intense, linear echo in the middle layer (red stars) and weaker echogenicity of the subendocardial and subepicardial layers (green arrow heads)
Fig. 3
Fig. 3
Parasternal transverse view of the left ventricle at the level of the papillary muscles. The image is used to determine the circumferential strain. The strain is analyzed in the tangential direction to the lines delineating the borders of the ROI (arrows) laid on the image in a similar manner as in Fig. 2. Similarly, the ROI was automatically divided into six equal color-coed segments corresponding to anatomical segments. The image was captured at late diastole, at a time point when speckles move away from each other, therefore the whole analyzed region is coded in a uniform blue color, indicating a homogeneous contraction throughout all analyzed segments
Fig. 4
Fig. 4
Parasternal transverse view of the left ventricle at the level of the papillary muscles; determination of the radial strain. Although the ROI is the same as for the circumferential strain, the strain is now analyzed perpendicular to lines delineating LV borders (arrows). In the case of systolic radial strain – as a result of ventricular wall thickening – speckles move away from each other and move closer during diastole, unlike the other strain components, which are brought closer to each other during systole. In order to maintain imaging uniformity, red color always codes for the expected direction of systolic strain, i.e. the color will indicate positive systolic radial strain values. The presented image was captured in the initial systolic phase, hence the uniform pale-pink color of the strain map
Fig. 5
Fig. 5
Rotational movement of the heart base in a clockwise direction as well as apical rotation in the opposite direction are observed during contraction from the side of the LV apex. STE allows for quantitative and qualitative tracking of the parameters of this movement. Parasternal transverse view shows the left ventricle at the level of mitral valve. The ROI was delineated according to the same principles. The red color indicates clockwise rotational movement, whereas the blue indicates the opposite direction (arrows). The two intersecting lines represent axes delineating the horizontal and vertical direction at the onset of the cardiac cycle; their rotation illustrates the rotation of the whole left ventricle around the long axis. The image was captured in the late systolic phase, hence the red color and axis deviation to the right (clockwise)
Fig. 6
Fig. 6
An analysis of the rotational movement of the individual segments allows to present its parameters in time in the form of line graphs (each segment in different color) or in the form of a two-dimensional ribbon graph. The figure shows an example of such graphs, illustrating basal left ventricular rotation. The analysis relates to the same ROI as in the previous figure. Clockwise rotation has negative values and is red-coded, counterclockwise rotation has positive values and is blue-coded. Line graph colors correspond to the individual segments in the two-dimensional image. The white dotted line represents a diagram for the average value for all analyzed segments. Early systolic short-lasting basal counterclockwise rotation, which is blue-coded in the ribbon diagram, and represented as positive curve deflection on line graphs, can be observed in the initial, early systolic phase of the cardiac cycle. This is followed by the main part of basal LV rotation – an intense red color and negative deflection of segmental curves. Restoration of baseline values takes place in the initial diastolic phase, prior to ventricular filling
Fig. 7
Fig. 7
Parasternal transverse view of the left ventricle at the apical level; late systolic phase. During systole, the apex rotates counterclockwise, hence the blue color of ROI map and the deviation of main direction axes to the left
Fig. 8
Fig. 8
The direction and the range of this movement is expressed in degrees and can be read from line and ribbon graphs. The presented figure only shows an averaged graph, describing global apical rotation

Similar articles

Cited by

References

    1. Fogel MA. Ventricular Function and Blood Flow in Congenital Heart Disease. Blackwell Publishing Ltd; 2005. Ventricular Function – the Basics of the Discipline.
    1. Beręsewicz A, Mączewski M. Biofizyka serca. In: Beręsewicz A, editor. Patofizjologia niewydolności serca. Warszawa: CMKP; 2010.
    1. Buckberg GD, Hoffman JI, Coghlan HC, Nanda NC. Ventricular structure – function relations in health and disease. Part I: The normal heart. Eur J Cardiothorac Surg. 2015;47:587–601. - PubMed
    1. Lunkenheimer PP, Redmann K, Kling N, Jiang X, Rothaus K, Cryer CW, et al. Three-dimensional architecture of the left ventricular myocardium. Anat Rec A Discov Mol Cell Evol Biol. 2006;288:565–578. - PubMed
    1. Sengupta PP, Korinek J, Belohlavek M, Narula J, Vannan MA, Jahangir A, et al. Left ventricular structure and function: basic science for cardiac imaging. J Am Coll Cardiol. 2006;48:1988–2001. - PubMed

LinkOut - more resources