

Polarization properties of single layers in the posterior eyes of mice and rats investigated using high resolution polarization sensitive optical coherence tomography
- PMID: 27446670
- PMCID: PMC4929656
- DOI: 10.1364/BOE.7.001479
Polarization properties of single layers in the posterior eyes of mice and rats investigated using high resolution polarization sensitive optical coherence tomography
Abstract
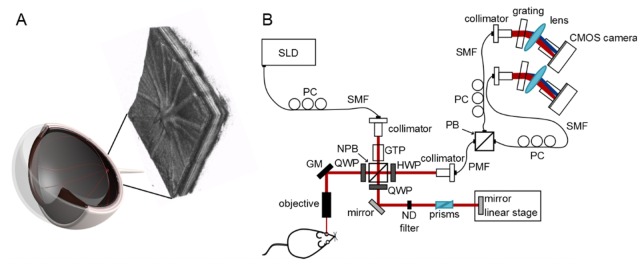
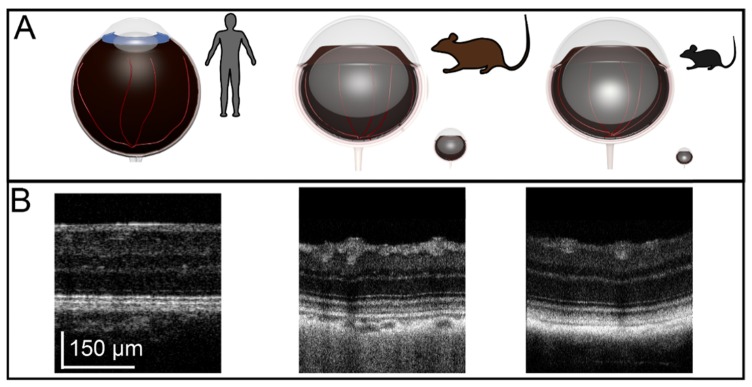
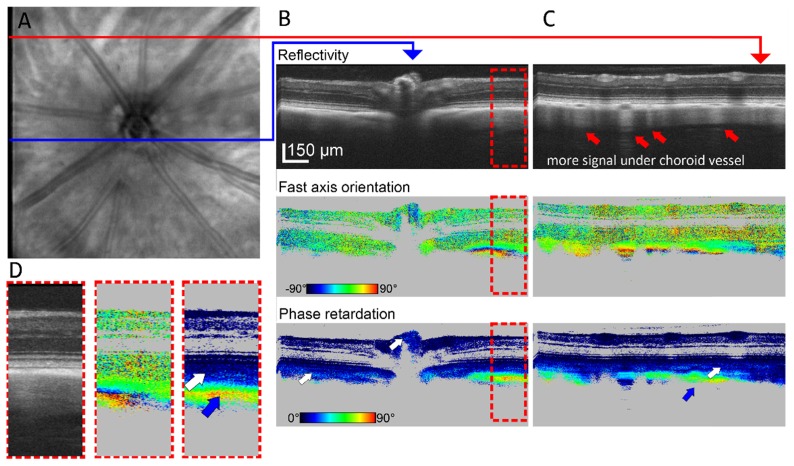
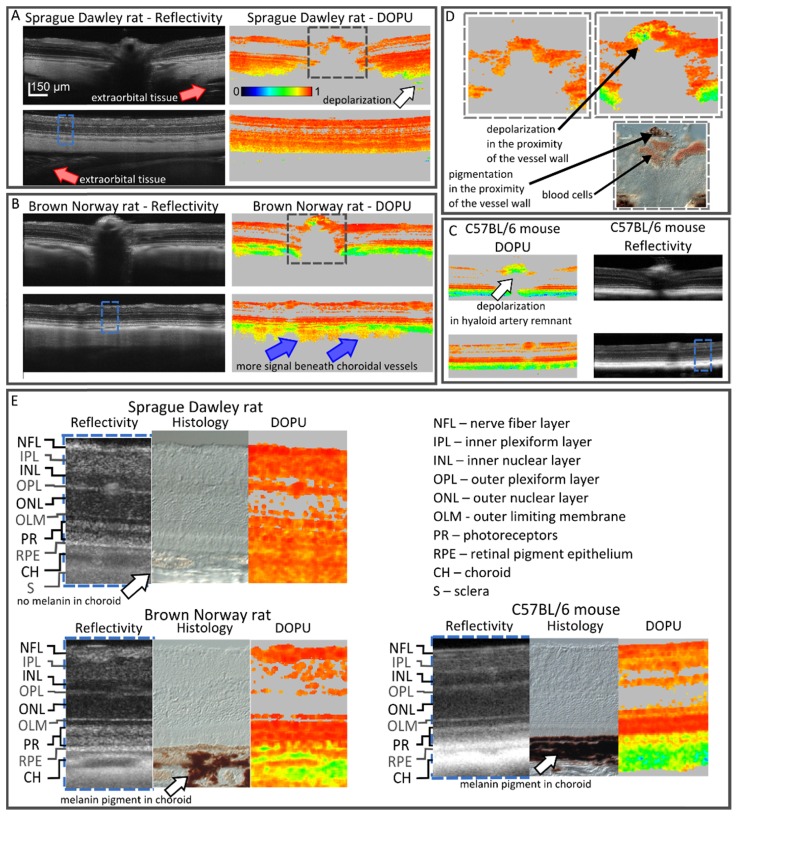
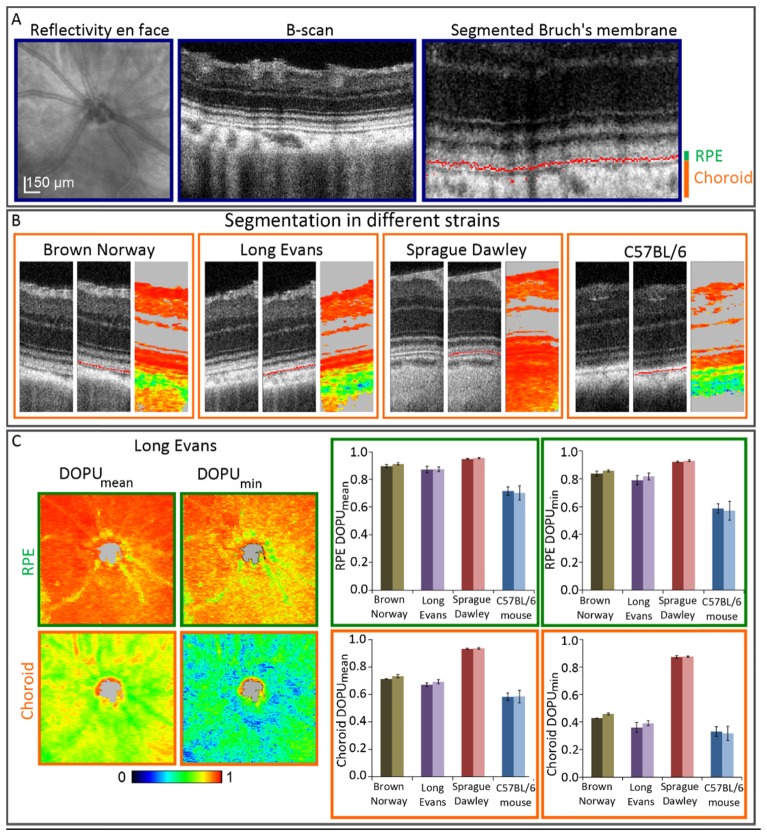
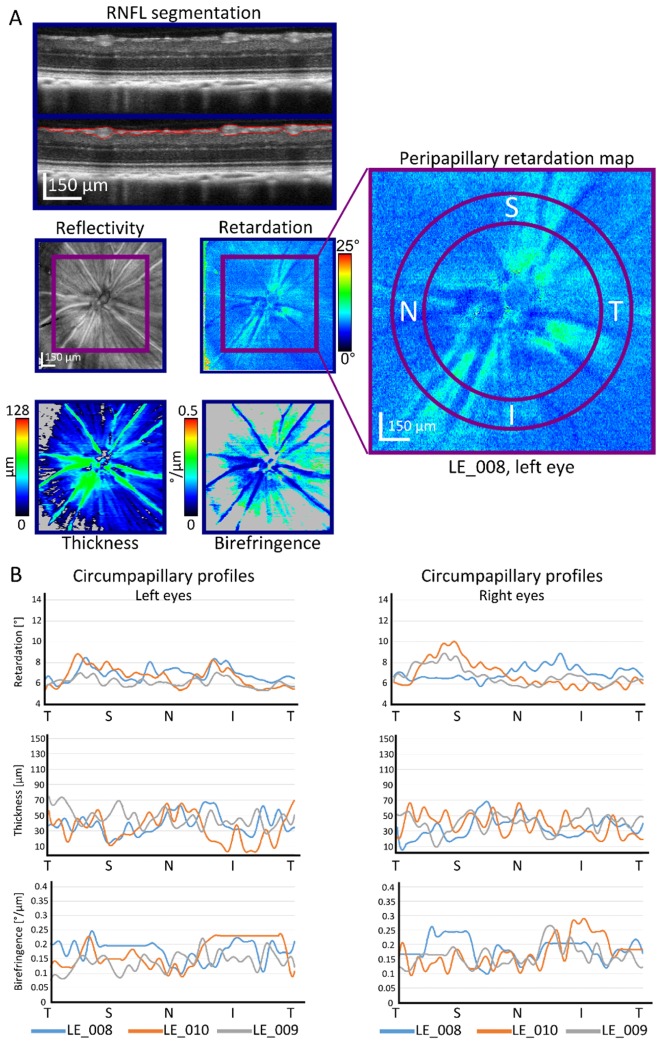
We present a high resolution polarization sensitive optical coherence tomography (PS-OCT) system for ocular imaging in rodents. The system operates at 840 nm and uses a broadband superluminescent diode providing an axial resolution of 5.1 µm in air. PS-OCT data was acquired at 83 kHz A-scan rate by two identical custom-made spectrometers for orthogonal polarization states. Pigmented (Brown Norway, Long Evans) and non-pigmented (Sprague Dawley) rats as well as pigmented mice (C57BL/6) were imaged. Melanin pigment related depolarization was analyzed in the retinal pigment epithelium (RPE) and choroid of these animals using the degree of polarization uniformity (DOPU). For all rat strains, significant differences between RPE and choroidal depolarization were observed. In contrast, DOPU characteristics of RPE and choroid were similar for C57BL/6 mice. Moreover, the depolarization within the same tissue type varied significantly between different rodent strains. Retinal nerve fiber layer thickness, phase retardation, and birefringence were mapped and quantitatively measured in Long Evans rats in vivo for the first time. In a circumpapillary annulus, retinal nerve fiber layer birefringence amounted to 0.16°/µm ± 0.02°/µm and 0.17°/µm ± 0.01°/µm for the left and right eyes, respectively.
Keywords: (110.0110) Imaging systems; (110.4500) Optical coherence tomography; (130.5440) Polarization-selective devices; (260.1440) Birefringence.
Figures
Similar articles
-
Posterior rat eye during acute intraocular pressure elevation studied using polarization sensitive optical coherence tomography.Biomed Opt Express. 2016 Dec 16;8(1):298-314. doi: 10.1364/BOE.8.000298. eCollection 2017 Jan 1. Biomed Opt Express. 2016. PMID: 28101419 Free PMC article.
-
Melanin Pigmentation in Rat Eyes: In Vivo Imaging by Polarization-Sensitive Optical Coherence Tomography and Comparison to Histology.Invest Ophthalmol Vis Sci. 2015 Nov;56(12):7462-72. doi: 10.1167/iovs.15-17742. Invest Ophthalmol Vis Sci. 2015. PMID: 26595606
-
Polarization sensitive optical coherence tomography of melanin provides intrinsic contrast based on depolarization.Biomed Opt Express. 2012 Jul 1;3(7):1670-83. doi: 10.1364/BOE.3.001670. Epub 2012 Jun 21. Biomed Opt Express. 2012. PMID: 22808437 Free PMC article.
-
[Pathophysiology of macular diseases--morphology and function].Nippon Ganka Gakkai Zasshi. 2011 Mar;115(3):238-74; discussion 275. Nippon Ganka Gakkai Zasshi. 2011. PMID: 21476310 Review. Japanese.
-
[A new approach for studying the retinal and choroidal circulation].Nippon Ganka Gakkai Zasshi. 2004 Dec;108(12):836-61; discussion 862. Nippon Ganka Gakkai Zasshi. 2004. PMID: 15656089 Review. Japanese.
Cited by
-
OCT Imaging in Murine Models of Alzheimer's Disease in a Systematic Review: Findings, Methodology and Future Perspectives.Biomedicines. 2024 Feb 27;12(3):528. doi: 10.3390/biomedicines12030528. Biomedicines. 2024. PMID: 38540142 Free PMC article. Review.
-
Posterior rat eye during acute intraocular pressure elevation studied using polarization sensitive optical coherence tomography.Biomed Opt Express. 2016 Dec 16;8(1):298-314. doi: 10.1364/BOE.8.000298. eCollection 2017 Jan 1. Biomed Opt Express. 2016. PMID: 28101419 Free PMC article.
-
Imaging retinal melanin: a review of current technologies.J Biol Eng. 2018 Dec 4;12:29. doi: 10.1186/s13036-018-0124-5. eCollection 2018. J Biol Eng. 2018. PMID: 30534199 Free PMC article. Review.
-
Multi-Functional OCT Enables Longitudinal Study of Retinal Changes in a VLDLR Knockout Mouse Model.PLoS One. 2016 Oct 6;11(10):e0164419. doi: 10.1371/journal.pone.0164419. eCollection 2016. PLoS One. 2016. PMID: 27711217 Free PMC article.
-
Estimation of Jones matrix, birefringence and entropy using Cloude-Pottier decomposition in polarization-sensitive optical coherence tomography.Biomed Opt Express. 2016 Aug 19;7(9):3551-3573. doi: 10.1364/BOE.7.003551. eCollection 2016 Sep 1. Biomed Opt Express. 2016. PMID: 27699120 Free PMC article.
References
-
- Drexler W., Fujimoto J. G., Optical Coherence Tomography: Technology and Applications (Springer Science & Business Media, 2008).
LinkOut - more resources
Full Text Sources
Other Literature Sources