Characterizing intestinal inflammation and fibrosis in Crohn's disease by photoacoustic imaging: feasibility study
- PMID: 27446710
- PMCID: PMC4948634
- DOI: 10.1364/BOE.7.002837
Characterizing intestinal inflammation and fibrosis in Crohn's disease by photoacoustic imaging: feasibility study
Abstract
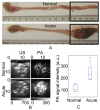
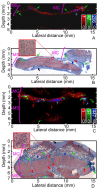
The pathology of Crohn's disease (CD) is characterized by obstructing intestinal strictures because of inflammation (with high levels of hemoglobin), fibrosis (high levels of collagen), or a combination of both. The accurate characterization of the strictures is critical for the management of CD. This study examines the feasibility of characterizing intestinal strictures by Photoacoustic imaging (PAI) without extrapolation from superficial biopsies. Ex vivo normal rat colon tissue, inflammatory and fibrotic intestinal strictures in rat trinitrobenzene sulfonic acid (TNBS) model were first differentiated by a PA-US parallel imaging system. Surgically removed human intestinal stricture specimens were afterwards imaged by a multiwavelength acoustic resolution PA microscope (ARPAM). The experiment results suggest that PAI is a potential tool for the diagnosis of the diseased conditions in intestinal strictures.
Keywords: (170.3880) Medical and biological imaging; (170.5120) Photoacoustic imaging; (170.7170) Ultrasound.
Figures


Similar articles
-
Identifying intestinal fibrosis and inflammation by spectroscopic photoacoustic imaging: an animal study in vivo.Biomed Opt Express. 2018 Mar 8;9(4):1590-1600. doi: 10.1364/BOE.9.001590. eCollection 2018 Apr 1. Biomed Opt Express. 2018. PMID: 29675304 Free PMC article.
-
Characterizing intestinal strictures of Crohn's disease in vivo by endoscopic photoacoustic imaging.Biomed Opt Express. 2019 Apr 24;10(5):2542-2555. doi: 10.1364/BOE.10.002542. eCollection 2019 May 1. Biomed Opt Express. 2019. PMID: 31143502 Free PMC article.
-
Assessment of Crohn's disease-associated small bowel strictures and fibrosis on cross-sectional imaging: a systematic review.Gut. 2019 Jun;68(6):1115-1126. doi: 10.1136/gutjnl-2018-318081. Epub 2019 Apr 3. Gut. 2019. PMID: 30944110 Free PMC article.
-
Inhibition of plasminogen activator inhibitor-1 attenuates against intestinal fibrosis in mice.Intest Res. 2020 Apr;18(2):219-228. doi: 10.5217/ir.2019.00037. Epub 2020 Feb 17. Intest Res. 2020. PMID: 32050315 Free PMC article.
-
Intestinal fibrosis in Crohn's disease: medical treatment or surgery?Curr Drug Targets. 2010 Feb;11(2):242-8. doi: 10.2174/138945010790309984. Curr Drug Targets. 2010. PMID: 19916949 Review.
Cited by
-
Recent advances toward clinical applications of photoacoustic microscopy: a review.Sci China Life Sci. 2020 Dec;63(12):1798-1812. doi: 10.1007/s11427-019-1628-7. Epub 2020 May 11. Sci China Life Sci. 2020. PMID: 32399767 Review.
-
Photoacoustic Imaging in Tissue Engineering and Regenerative Medicine.Tissue Eng Part B Rev. 2020 Feb;26(1):79-102. doi: 10.1089/ten.TEB.2019.0296. Epub 2020 Jan 14. Tissue Eng Part B Rev. 2020. PMID: 31854242 Free PMC article. Review.
-
Latest advancements in imaging techniques in OA.Ther Adv Musculoskelet Dis. 2022 Dec 26;14:1759720X221146621. doi: 10.1177/1759720X221146621. eCollection 2022. Ther Adv Musculoskelet Dis. 2022. PMID: 36601087 Free PMC article. Review.
-
Identifying intestinal fibrosis and inflammation by spectroscopic photoacoustic imaging: an animal study in vivo.Biomed Opt Express. 2018 Mar 8;9(4):1590-1600. doi: 10.1364/BOE.9.001590. eCollection 2018 Apr 1. Biomed Opt Express. 2018. PMID: 29675304 Free PMC article.
-
Optoacoustic Imaging in Inflammation.Biomedicines. 2021 Apr 28;9(5):483. doi: 10.3390/biomedicines9050483. Biomedicines. 2021. PMID: 33924983 Free PMC article. Review.
References
-
- Lichtenstein G. R., Olson A., Travers S., Diamond R. H., Chen D. M., Pritchard M. L., Feagan B. G., Cohen R. D., Salzberg B. A., Hanauer S. B., Sandborn W. J., “Factors associated with the development of intestinal strictures or obstructions in patients with Crohn’s disease,” Am. J. Gastroenterol. 101(5), 1030–1038 (2006).10.1111/j.1572-0241.2006.00463.x - DOI - PubMed
Grants and funding
LinkOut - more resources
Full Text Sources
Other Literature Sources
