. 2002 Aug 1;107(4):339-53.
doi: 10.6028/jres.107.027. Print 2002 Jul-Aug.

Quantitating Fluorescence Intensity From Fluorophores: Practical Use of MESF Values

Affiliations

Quantitating Fluorescence Intensity From Fluorophores: Practical Use of MESF Values

Lili Wang et al. J Res Natl Inst Stand Technol. .

Abstract

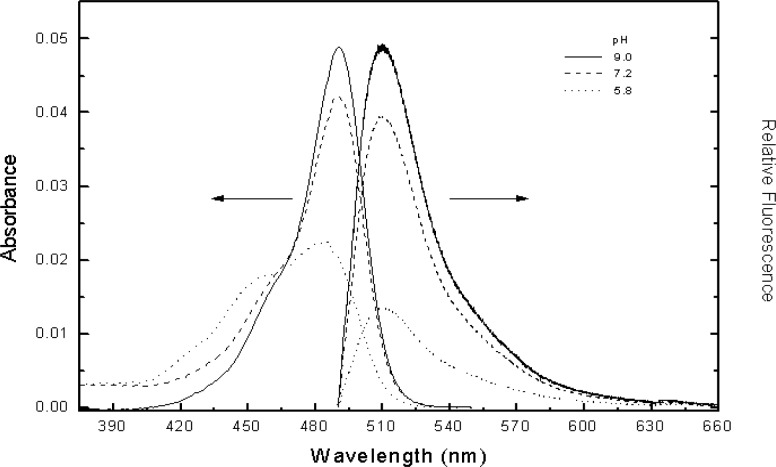
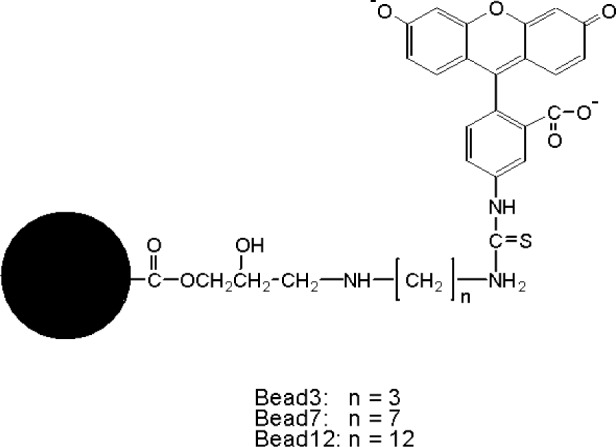
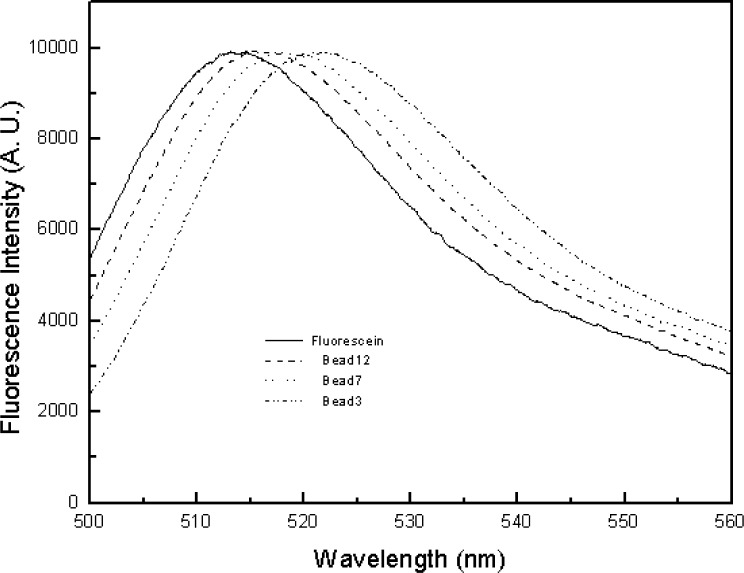
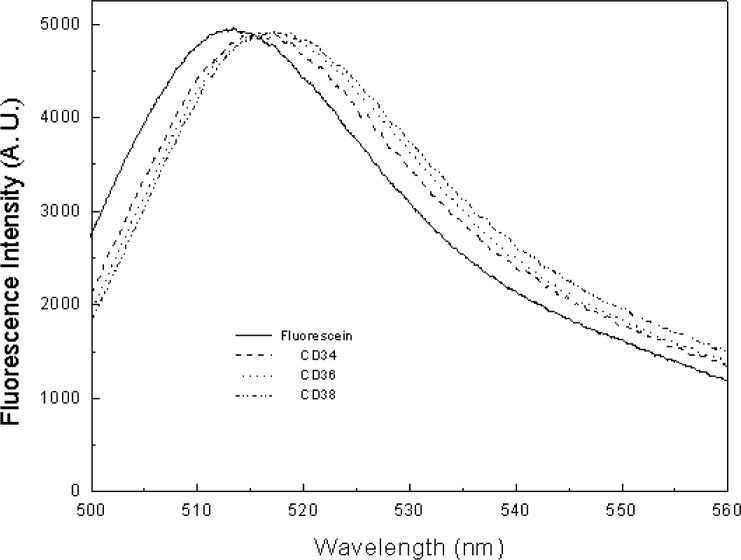
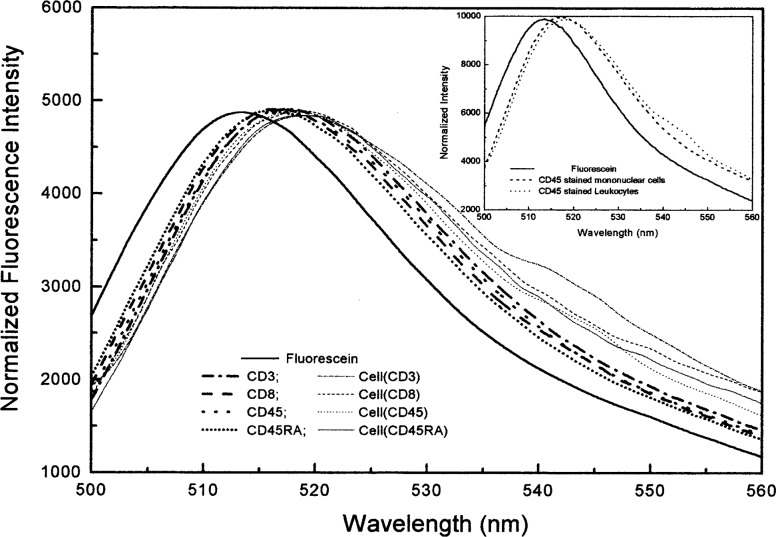
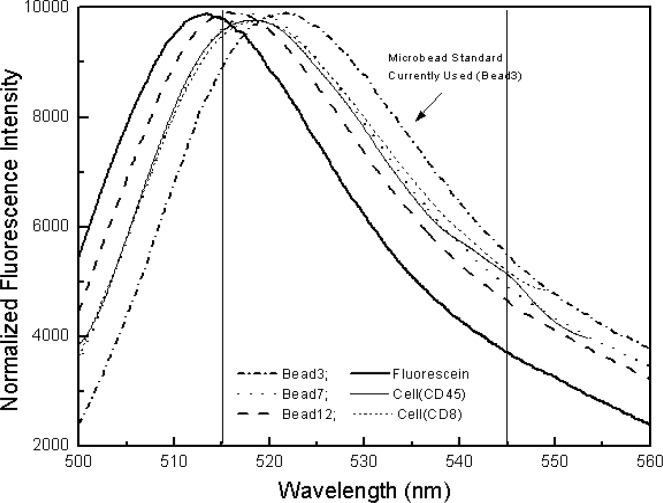
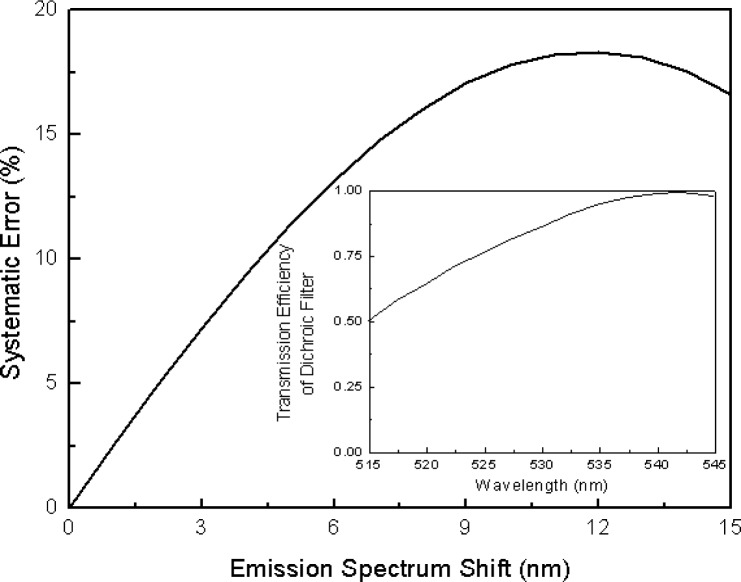
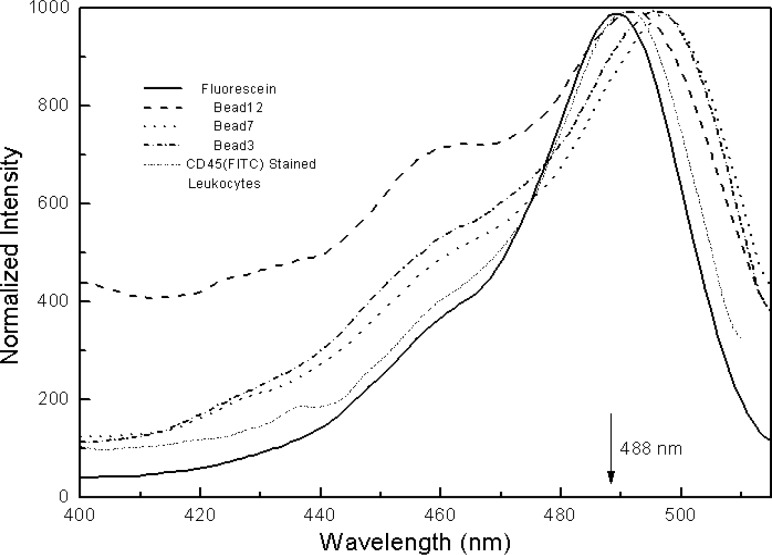
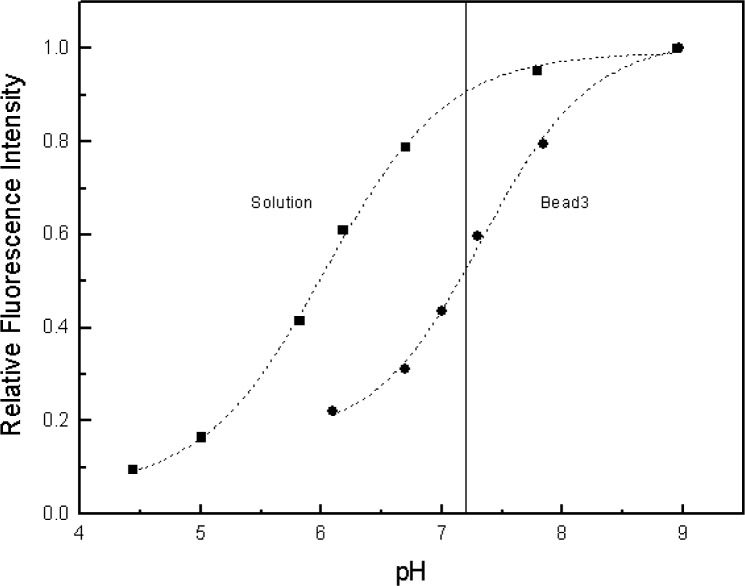
The present work uses fluorescein as the model fluorophore and points out critical steps in the use of MESF (Molecules of Equivalent Soluble Fluorophores) values for quantitative flow cytometric measurements. It has been found that emission spectrum matching between a reference solution and an analyte and normalization by the corresponding extinction coefficient are required for quantifying fluorescence signals using flow cytometers. Because of the use of fluorescein, the pH value of the medium is also critical for accurate MESF assignments. Given that the emission spectrum shapes of microbead suspensions and stained biological cells are not significantly different, the percentage of error due to spectrum mismatch is estimated. We have also found that the emission spectrum of a microbead with a seven-methylene linker between the fluorescein and the bead surface (bead7) provides the best match with the spectra from biological cells. Therefore, bead7 is potentially a better calibration standard for flow cytometers than the existing one that is commercially available and used in the present study.

Keywords: MESF value; emission spectrum matching; extinction coefficient; fluorescein; lymphocyte; microbead; pH; quantitative flow cytometry.


Figures

Fig. 1
Fig. 1
The schematic diagram of the research flow cytometer. An air-cooled Ar ion laser operated at 488 nm is used as the excitation source. The design of the flow system has been described in detail by Shapiro [10].
Fig. 2
Fig. 2
Absorption (left) and emission (right) spectra of fluorescein taken at different pH buffer solutions. The absorbance and fluorescence were measured using a HP-8453 spectrophotometer and the calibrated spectrofluorimeter described in Ref. [6] with an Ar ion laser at 488 nm as the excitation source, respectively.
Fig. 3
Fig. 3
The chemical structures of the fluorescein microbeads with different linker lengths. The abbreviations are also given for three different beads, used throughout the study.
Fig. 4
Fig. 4
The emission spectra of fluorescein microbeads with different linker lengths in PBS, at pH 7.2, with respect to that of fluorescein in borate buffer solution at pH 9.1. The spectra are normalized to give approximately the same intensities at the maximum. Note that bead3 is the current microbead standard for quantifying fluorescence signal from biological cells stained with fluorescein-labeled monoclonal antibodies. Such a bead standard was produced originally by Flow Cytometry Standards Corporation, San Juan, Puerto Rico, and now by Bangs Laboratories, Inc., Fishers, IN.
Fig. 5
Fig. 5
The normalized emission spectra of three fluorescein-labeled monoclonal antibodies from three different manufacturers in PBS, pH 7.2, relative to that of fluorescein in borate buffer solution at pH 9.1. The three antibodies are CD34 (BD Bioscience, San Jose, CA), CD36 (AMAC INC., Westbrook, Maine), and CD38 (Caltag, Burlingame, CA).
Fig. 6
Fig. 6
The normalized emission spectra of fluorescein-labeled monoclonal antibodies (thick plots) and leukocytes stained with these antibodies (thin plots) in PBS, pH 7.2, relative to fluorescein in borate buffer, pH 9.1: CD3; CD8; CD45; CD45RA. The inset shows the normalized spectra of CD45 stained leukocytes and mononuclear cells compared to that of fluorescein in solution.
Fig. 7
Fig. 7
The normalized emission spectra of the microbeads with different linker lengths and leukocytes stained with either CD45 or CD8 monoclonal antibody, with respect to that of fluorescein in solution: Fluorescein; Bead3; Bead7; Bead12; cell(CD45); cell(CD8). The two vertical lines define the emission collection window by the bandpass filter used in flow cytometers.
Fig. 8
Fig. 8
The method of assigning a MESF value to lymphocytes stained with fluorescein-labeled CD45 monoclonal antibodies. (A) Histogram of four populations of the fluorescein-labeled microbeads (sharp peaks) and one blank bead (broad peak) obtained by the FACScan flow cytometer. FL1 FITC refers to the fluorescein fluorescence channel. (B) Histogram of CD45 stained lymphocytes. (C) A calibration curve of MESF value vs fluorescence intensity in terms of the fluorescence channel number obtained through the linear fitting of the mean channel numbers for the five-microbead populations (solid circles). Having a known mean channel number for the stained lymphocytes (open circle), the corresponding MESF value is determined.
Fig. 9
Fig. 9
Graph of the systematic error as a function of the emission spectrum shift relative to that of mononuclear cells using the simple research cytometer as the model instrument. The inset shows the change in the transmission efficiency of the dichroic filter used in the model cytometer in the wavelength range from 515 nm to 545 nm.
Fig. 10
Fig. 10
The normalized excitation spectra of the microbeads with different linker lengths and leukocytes stained with fluorescein-labeled CD45 monoclonal antibodies in PBS, pH 7.2, with respect to that of fluorescein in borate buffer, pH 9.1. The background from the corresponding blank beads or unstained leukocytes has been subtracted. The emission was collected at 530 nm with the excitation bandwidth of 2 nm and the emission bandwidth of 5 nm. The excitation and emission polarizers were set at 0° and 54.7°, respectively.
Fig. 11
Fig. 11
The fluorescence intensity relative to the intensity at pH ≈ 9.0 as a function of the pH of the medium for fluorescein (solid square) and bead3 labeled with fluorescein (solid circle). Dashed lines are the sigmoidal fitting curves for the two sets of data.

References

    1. Vogt RF, Cross GD, Phillips DL, Henderson LO, Hannon WH. Interlaboratory Study of Cellular Fluorescence Intensity Measurements With Fluorescein-Labeled Microbead Standards. Cytometry. 1991;12:525–536. - PubMed
    1. Schwartz A, Fernandez-Repollet E, Vogt RF, Gratama JW. Standardizing Flow Cytometry: Construction of a Standardized Fluorescence Calibration Plot Using Matching Spectral Calibrators. Cytometry (Comm Clin Cytometry) 1996;26:22–31. - PubMed
    1. Giorgi JV, Liu Z, Hultin LE, Cumberland WG, Hennessey K, Detels R. Multicenter AIDS Cohort Study: Elevated Levels of CD38+CD8+ T Cells in HIV Infection Add to the Prognostic Value of Low CD4+ T Cell Levels: Results of 6 Years of Follow-up. J Acquir Immune Defic Syndr. 1993;6:904–912. - PubMed
    1. Hultin LE, Matud JL, Giorgi JV. Quantitation of CD38 Activation Antigen Expression on CD8+ T Cells in HIV-1 Infection Using CD4 Expression on CD4+ T Lymphocytes as a Biological Calibrator. Cytometry. 1998;33:123–132. - PubMed
    1. Iyer SB, Hultin LE, Zawadzki JA, Davis KA, Giorgi JV. Quantitation of CD38 Expression Using QuantiBRITE™ Beads. Cytometry. 1998;33:206–212. - PubMed

LinkOut - more resources