. 2016 Jun 21:4:58.
doi: 10.3389/fcell.2016.00058. eCollection 2016.

Gene Expression Profiling of Muscle Stem Cells Identifies Novel Regulators of Postnatal Myogenesis

Affiliations

Gene Expression Profiling of Muscle Stem Cells Identifies Novel Regulators of Postnatal Myogenesis

Sonia Alonso-Martin et al. Front Cell Dev Biol. .

Abstract

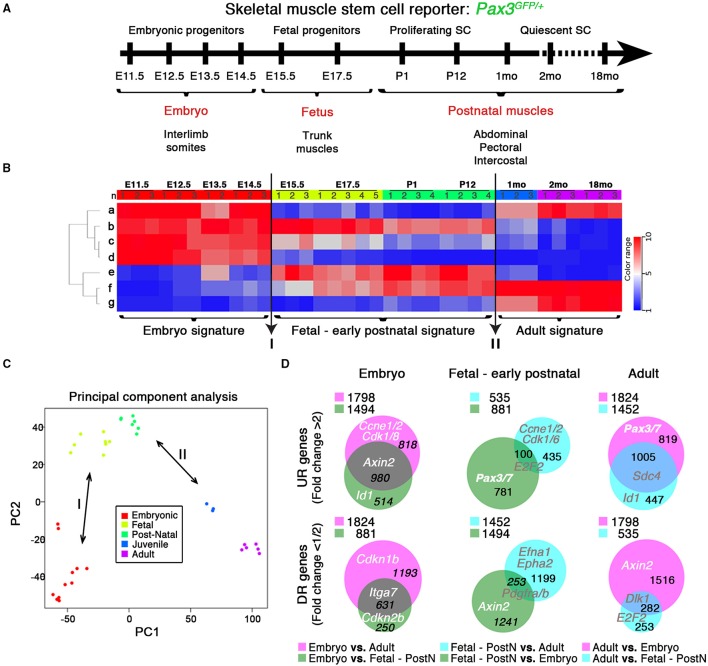
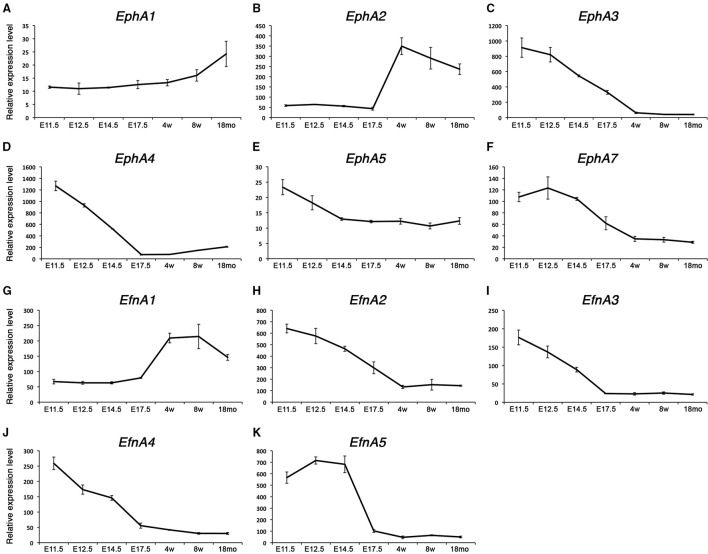
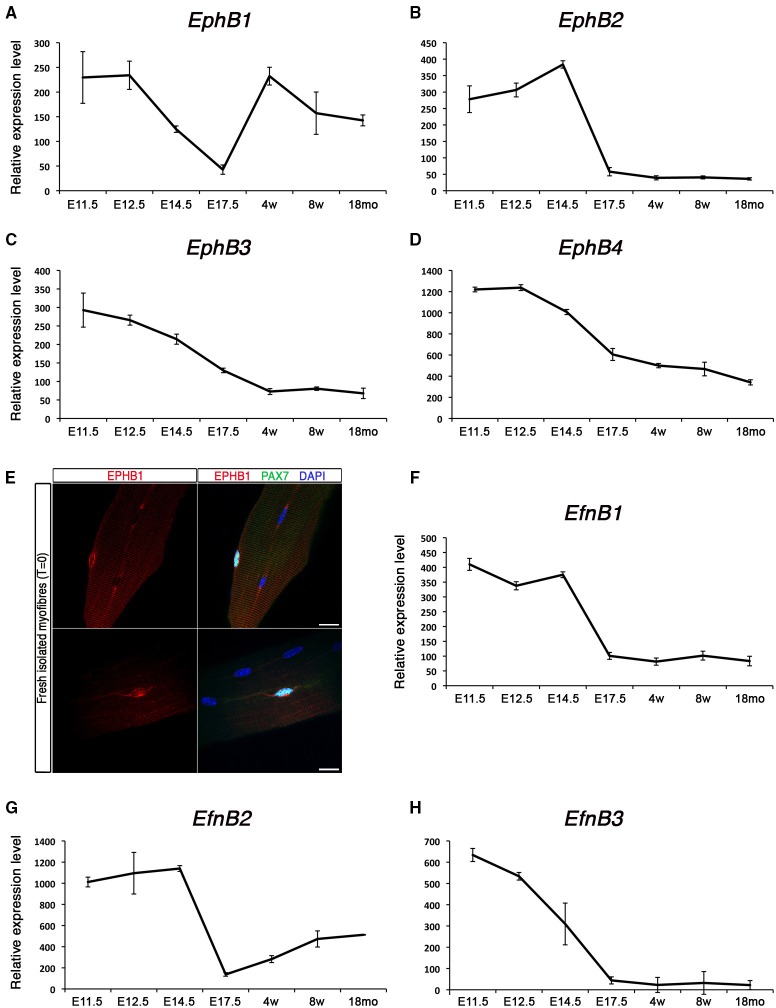
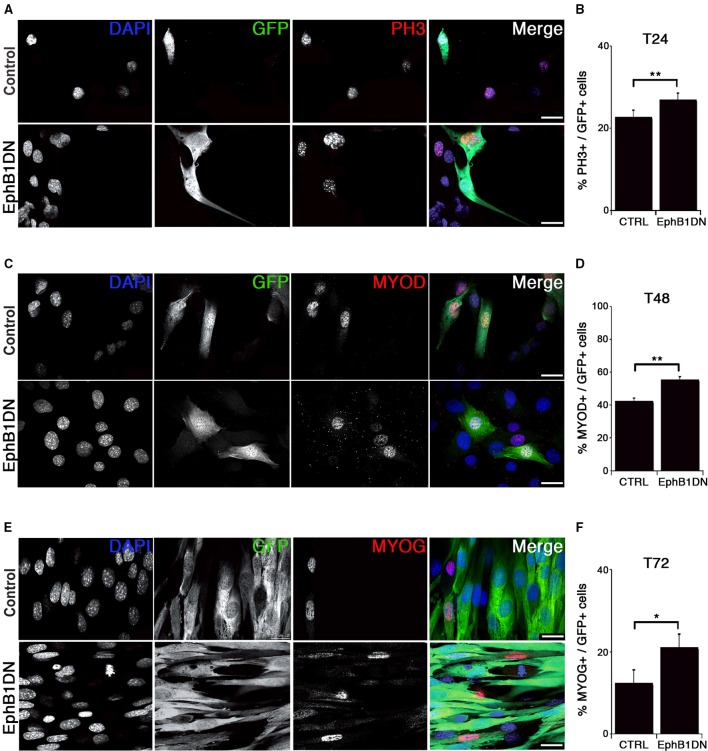
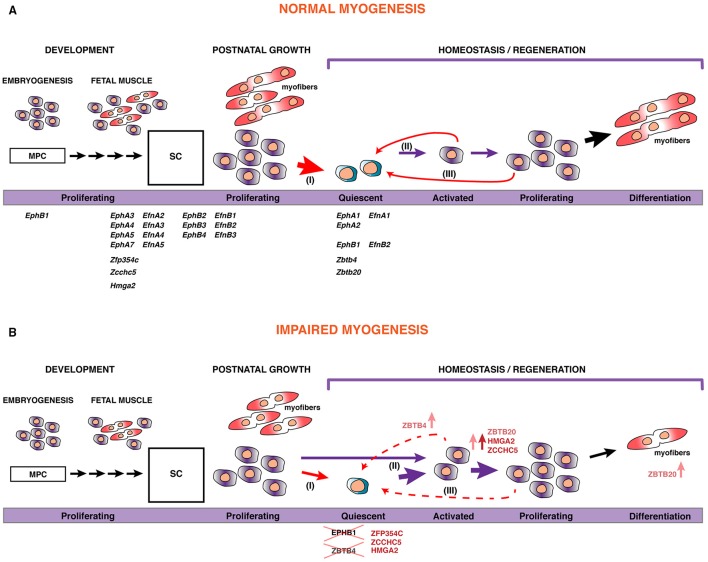
Skeletal muscle growth and regeneration require a population of muscle stem cells, the satellite cells, located in close contact to the myofiber. These cells are specified during fetal and early postnatal development in mice from a Pax3/7 population of embryonic progenitor cells. As little is known about the genetic control of their formation and maintenance, we performed a genome-wide chronological expression profile identifying the dynamic transcriptomic changes involved in establishment of muscle stem cells through life, and acquisition of muscle stem cell properties. We have identified multiple genes and pathways associated with satellite cell formation, including set of genes specifically induced (EphA1, EphA2, EfnA1, EphB1, Zbtb4, Zbtb20) or inhibited (EphA3, EphA4, EphA7, EfnA2, EfnA3, EfnA4, EfnA5, EphB2, EphB3, EphB4, EfnBs, Zfp354c, Zcchc5, Hmga2) in adult stem cells. Ephrin receptors and ephrins ligands have been implicated in cell migration and guidance in many tissues including skeletal muscle. Here we show that Ephrin receptors and ephrins ligands are also involved in regulating the adult myogenic program. Strikingly, impairment of EPHB1 function in satellite cells leads to increased differentiation at the expense of self-renewal in isolated myofiber cultures. In addition, we identified new transcription factors, including several zinc finger proteins. ZFP354C and ZCCHC5 decreased self-renewal capacity when overexpressed, whereas ZBTB4 increased it, and ZBTB20 induced myogenic progression. The architectural and transcriptional regulator HMGA2 was involved in satellite cell activation. Together, our study shows that transcriptome profiling coupled with myofiber culture analysis, provides an efficient system to identify and validate candidate genes implicated in establishment/maintenance of muscle stem cells. Furthermore, tour de force transcriptomic profiling provides a wealth of data to inform for future stem cell-based muscle therapies.

Keywords: ephrins; myogenesis; satellite cells; skeletal muscle; zinc fingers.


Figures

Figure 1
Figure 1
Transcriptome dynamics from embryonic muscle development to aged mice. (A) Schematic outline of the experimental procedure illustrating the stages at which Pax3GFP∕+ RNA samples were harvested: E, Embryonic days; P, Postnatal days; mo, age in months. SC, satellite cells. (B) Genes from the microarray were organized in seven clusters (“a” to “g”) according to developmental kinetics: with red indicating up-regulated (UR), and blue the down-regulated (DR) transcripts. Transition events (I and II; arrows) are indicated, highlighting the three specific signatures. n, replicate number per stage. (C) Principal Component Analysis (PCA) highlights these differences between the three signatures defined by the transitions events in (B). (D) Venn diagrams show the interaction of UR (upper panels) or DR (bottom panels) genes from the different comparisons as indicated, illustrating the specific molecular signature for each developmental period. PostN, fetal-to-early postnatal. p < 10−3 and change fold >2 (UR) or < 1/2 (DR). Gene examples and the number of genes shared between groups are indicated. Legends indicate the total UR or DR genes per comparison.
Figure 2
Figure 2
Expression profile of EphA receptors and ephrins in skeletal muscle. Total RNA from FACS-sorted Pax3-GFP+ cells was used to perform microarray experiments. (A–F) Gene expression profiles of type-A Eph receptors from the microarray data during embryonic and postnatal myogenesis. EphA1 and EphA2 were up-regulated during the perinatal transition, unlike the rest of the receptors which became down-regulated. (G–K) Gene expression dynamics of type-A ephrins during embryonic and postnatal myogenesis. EfnA1 was up-regulated during the perinatal transition, unlike the rest of the ligands which became down-regulated. EphA2 and EfnA1 decline with age. E, Embryonic days; w, age in weeks; mo, age in months.
Figure 3
Figure 3
Expression profile of EphB receptors and ephrins in skeletal muscle. Total RNA from FACS-sorted Pax3-GFP+ cells was used to perform microarray experiments. (A–D) Gene expression profiles of type-B Eph receptors during embryonic and postnatal myogenesis. EphB1 was up-regulated during the perinatal transition, unlike the rest of the receptors which became down-regulated. (E) Expression of EPHB1 receptor in quiescent satellite cells on fresh isolated EDL myofibers (T = 0) by co-immunostaining for EPHB1 (red) and PAX7 (green). Nuclei were labeled in blue with DAPI. Scale bars, 10 μm. (F–H) Gene expression dynamics of type-B ephrins during embryonic and postnatal myogenesis. All these ephrins were down-regulated during the perinatal transition. E, Embryonic days; w, age in weeks; mo, age in months.
Figure 4
Figure 4
Impairment of EPHB1 function increases proliferation and myogenic differentiation. (A–F) Overexpression of dominant negative EPHB1 (EphB1DN) using retroviruses in C2C12 cells during proliferation at T = 24 h (A,B), T = 48 h (C,D), and during differentiation at T = 72 h (E,F). For each time point, immunostaining and the corresponding quantifications are shown. Control corresponds to infection by a GFP-expressing empty vector. Nuclei are labeled with DAPI (blue). Cell percentages represent the proportion of transduced cells (GFP+) that co-express PH3 (B), MYOD (D), or MYOG (F). p-value *p < 0.05 and **p < 0.01. Minimum number of infected cells was 250, for each marker analyzed. Scale bars, 25 μm.
Figure 5
Figure 5
Impairment of EPHB1 function induces satellite cell differentiation. Satellite cells were transduced to overexpress a truncated EPHB1 (EphB1DN) after 24 h in culture and analyzed 48 h later (T72). Representative immunofluorescent images are displayed for GFP, DAPI, and PAX7 (A), MYOD (C), and MYOG (Myogenin) (E). Scale bars, 20 μm. Quantifications are illustrated for quiescence/self-renewal (B), activation (D), and differentiation (F). (G) Quantification of PAX7 and MYOD satellite cells 48 h after infection with EphB1DN. Control corresponds to infection by a CFP-expressing empty vector. p-values: **p < 0.01 and ***p < 0.001. For each marker analyzed, the minimum number of infected satellite cells was 200.
Figure 6
Figure 6
Zinc finger proteins control satellite cell behavior. (A–D) Expression profiles for zinc finger proteins, Zfp354c, Zcchc5, Zbtb4, and Zbtb20. Whereas Zfp354c and Zcchc5 are repressed in satellite cells (A,B), Zbtb4, and Zbtb20 are induced during satellite cell formation (C,D). E, Embryonic days; w, age in weeks; mo, age in months. (E–P) Quantifications for quiescence/self-renewal (PAX7), activation (MYOD), and differentiation (MYOG) are shown during overexpression of the different zinc fingers: Zfp354c (E–G), Zcchc5 (H–J), Zbtb4 (K–M), and Zbtb20 (N–P). All analyses were performed 48 h after infection. p-value *p < 0.05 and **p < 0.01. For each marker analyzed, the minimum number of infected satellite cells was 200.
Figure 7
Figure 7
HMGA2 reduces the pool of satellite cells. (A) Expression profile of Hmga2 during development. E, Embryonic days; w, age in weeks; mo, age in months. (B) Protein structure of the non-histone, DNA-binding chromatin HMGA2 factor containing three DNA-binding sites (AT hook motifs) and the basic terminal region, which can bind various proteins. (C) Representative image for the co-immunofluorescence of GFP (green) and PAX7 (red) with DAPI counterstain (blue). Quantification corresponds to the analysis of quiescence (D) and activation (E) of the satellite cells. Forty eight hours after infection, retroviral-mediated overexpression of HMGA2 caused a reduction in the population of PAX7+ cells (D) and an increase MYOD+ cell population (E). p-value **p < 0.01 and ***p < 0.001. For each marker analyzed, the minimum number of infected satellite cells was 500. Scale bar, 20 μm.
Figure 8
Figure 8
A model for skeletal muscle stem cell behavior during myogenesis. (A) During development, embryonic and fetal progenitors are highly proliferative, augmenting the pool of MPC that will differentiate and fuse to form myofibers. As development proceeds, some of these MPCs become satellite cells (SC), the postnatal muscle stem cells. During the perinatal transition, many of these SCs will contribute to the maturation of myofibers, with a pool of stem cells maintained within their natural niche, underneath the basal lamina surrounding the myofiber. Satellite cells become quiescent by 3 weeks after birth (I). However, in response to injury or disruption of the basal lamina, SCs become activated (II), start proliferating, and differentiate to fuse with each other or to existing myofibers for repair. Some of these will self-renew to replenish the pool of quiescent stem cells (III). The putative role and expression of the set of transcripts that we identified in this work is displayed. In addition, we show that manipulating their expression or function can lead to impaired myogenesis (B), either via reduction of the pool of stem cells by promoting proliferation or cell fate determination, or through inducing precocious myogenic differentiation.

References

    1. Abou-Khalil R., Le Grand F., Pallafacchina G., Valable S., Authier F.-J., Rudnicki M. A., et al. . (2009). Autocrine and paracrine angiopoietin 1/Tie-2 signaling promotes muscle satellite cell self-renewal. Cell Stem Cell 5, 298–309. 10.1016/j.stem.2009.06.001 - DOI - PMC - PubMed
    1. Amthor H., Christ B., Weil M., Patel K. (1998). The importance of timing differentiation during limb muscle development. Curr. Biol. 8, 642–652. 10.1016/S0960-9822(98)70251-9 - DOI - PubMed
    1. Arthur A., Zannettino A., Panagopoulos R., Koblar S. A., Sims N. A., Stylianou C., et al. . (2011). EphB/ephrin-B interactions mediate human MSC attachment, migration and osteochondral differentiation. Bone 48, 533–542. 10.1016/j.bone.2010.10.180 - DOI - PubMed
    1. Arvanitis D., Davy A. (2008). Eph/ephrin signaling: networks. Genes Dev. 22, 416–429. 10.1101/gad.1630408 - DOI - PMC - PubMed
    1. Ashar H. R., Chouinard R. A., Jr., Dokur M., Chada K. (2010). In vivo modulation of HMGA2 expression. Biochim. Biophys. Acta 1799, 55–61. 10.1016/j.bbagrm.2009.11.013 - DOI - PubMed