. 2016 Nov 1;23(11):1839-1849.
doi: 10.1038/cdd.2016.70. Epub 2016 Jul 22.

Autophagy regulates satellite cell ability to regenerate normal and dystrophic muscles

Affiliations

Autophagy regulates satellite cell ability to regenerate normal and dystrophic muscles

E Fiacco et al. Cell Death Differ. .

Abstract

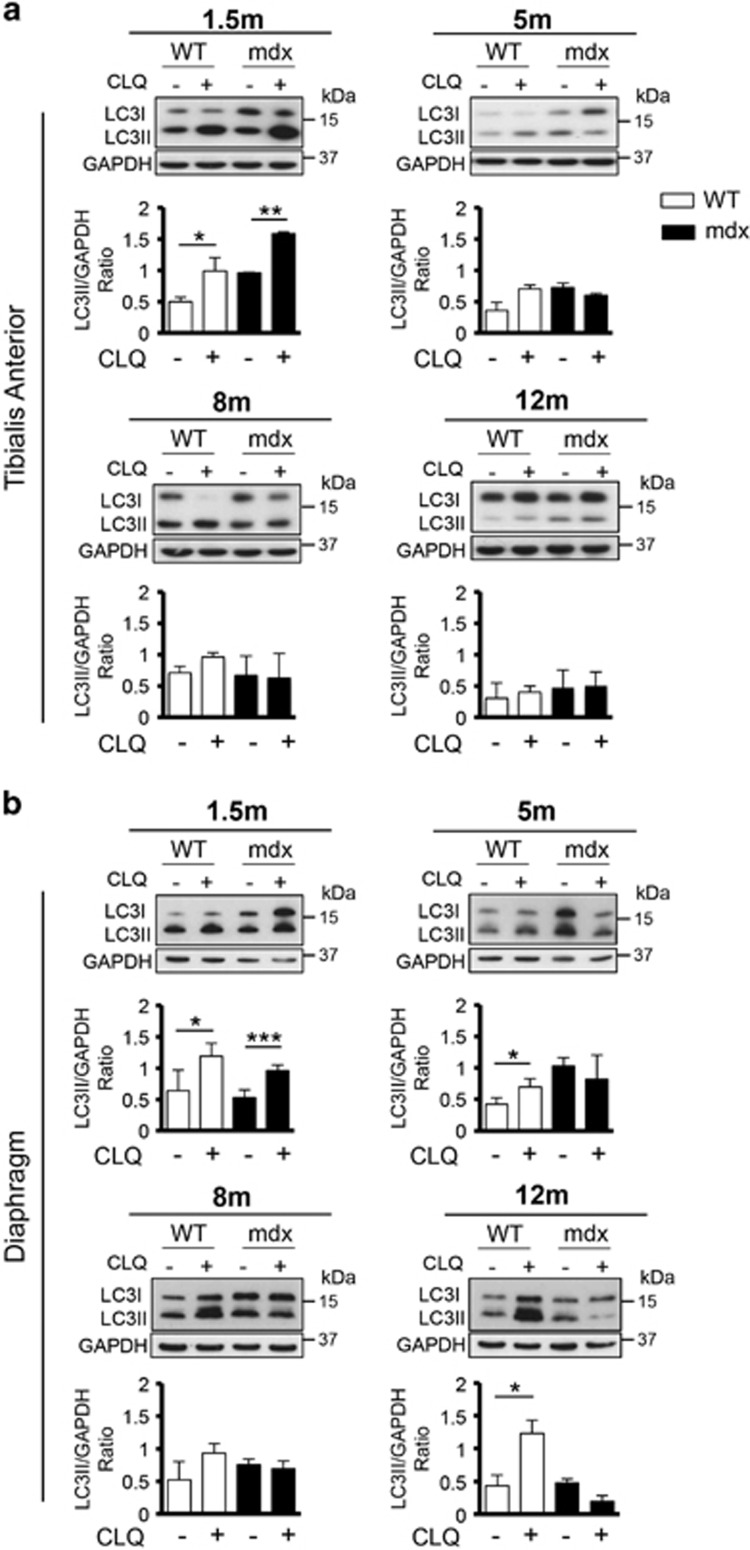
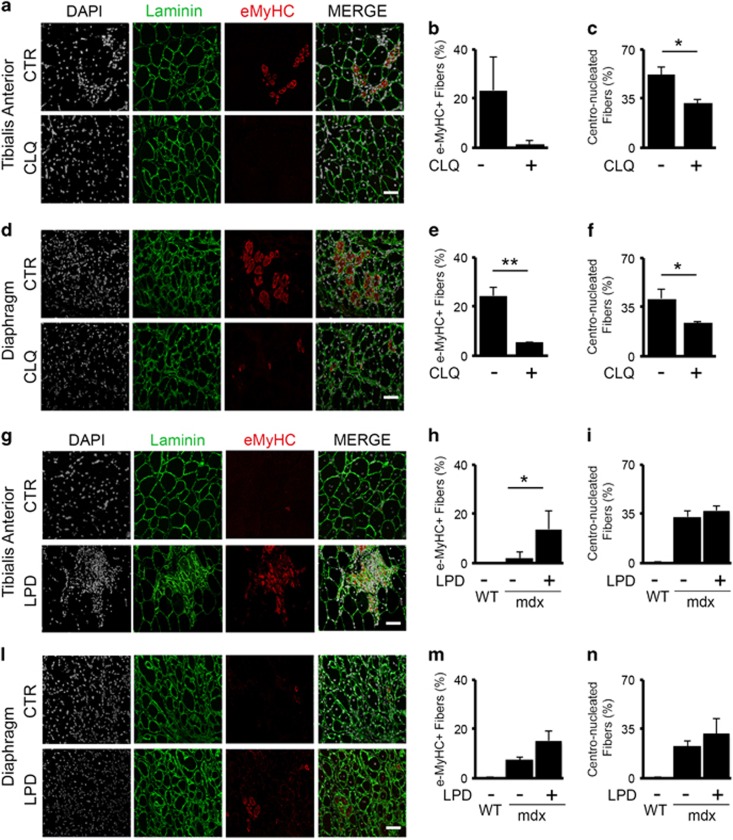
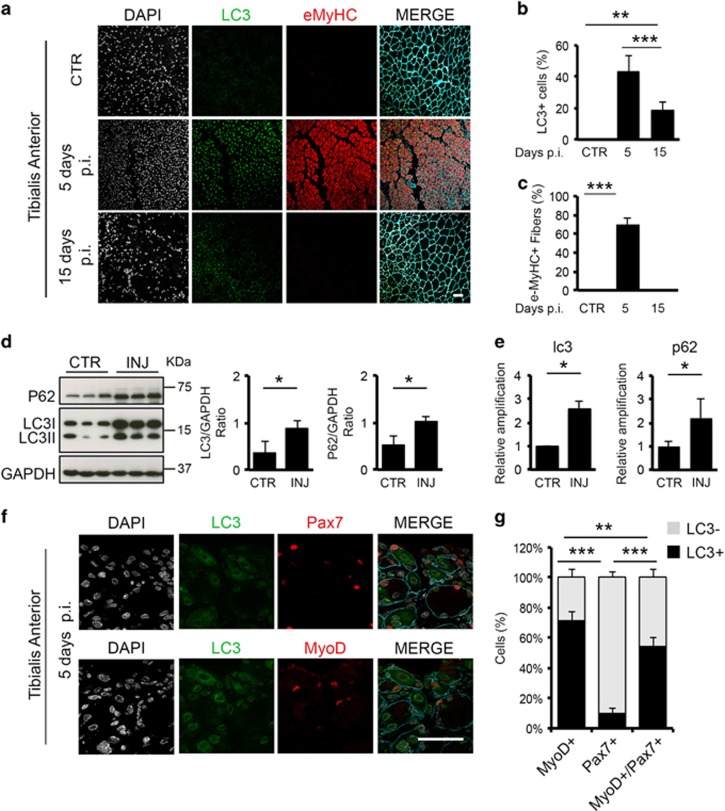
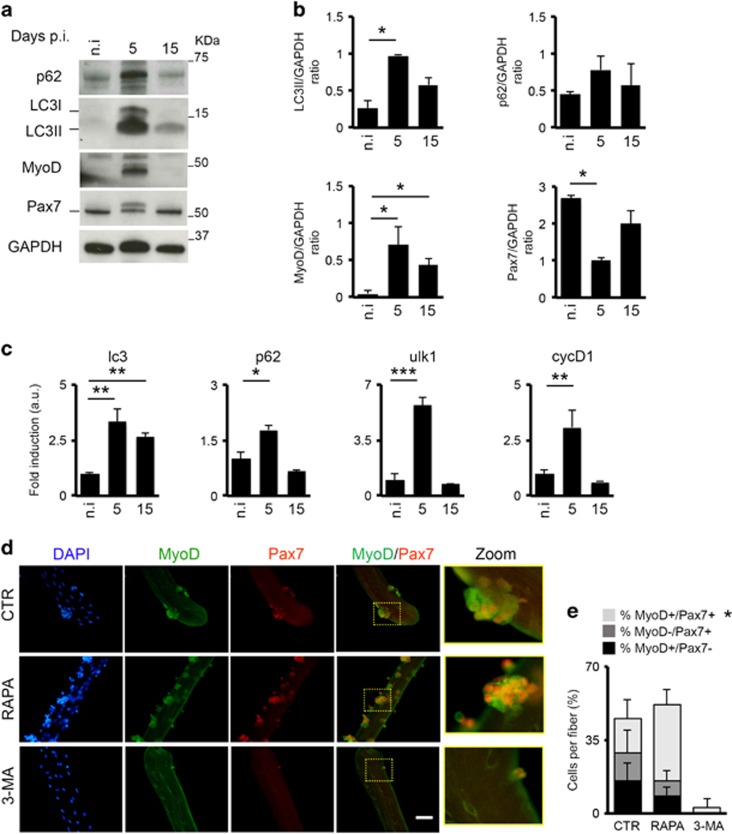
Autophagy is emerging as a key regulatory process during skeletal muscle development, regeneration and homeostasis, and deregulated autophagy has been implicated in muscular disorders and age-related muscle decline. We have monitored autophagy in muscles of mdx mice and human Duchenne muscular dystrophy (DMD) patients at different stages of disease. Our data show that autophagy is activated during the early, compensatory regenerative stages of DMD. A progressive reduction was observed during mdx disease progression, in coincidence with the functional exhaustion of satellite cell-mediated regeneration and accumulation of fibrosis. Moreover, pharmacological manipulation of autophagy can influence disease progression in mdx mice. Of note, studies performed in regenerating muscles of wild-type mice revealed an essential role of autophagy in the activation of satellite cells upon muscle injury. These results support the notion that regeneration-associated autophagy contributes to the early compensatory stage of DMD progression, and interventions that extend activation of autophagy might be beneficial in the treatment of DMD. Thus, autophagy could be a 'disease modifier' targeted by interventions aimed to promote regeneration and delay disease progression in DMD.


Figures

Figure 1
Figure 1
Premature block of autophagic flux in mdx mice compared with WT mice. To assess the autophagic flux in control and pathological conditions, WT and mdx mice at 1.5, 5, 8 and 12 months were treated with CLQ (50 mg/kg every 24 h for 4 days). Protein extracts from TA (a) and D (b) muscles were probed for LC3 and GAPDH. A representative western blot for every time point is shown. The plots represent LC3II/GAPDH ratio relative to WT (white bars) and mdx (black bars) mice; n=4 for each experimental group. Statistical significance assessed by t-test, *P≤0.05, **P≤0.01, ***P≤0.001
Figure 2
Figure 2
Altered autophagic response in human biopsies from DMD boys at different ages. Autophagy was monitored in human biopsies isolated from vastus medialis of 2- and 8-year-old dystrophic boys. (a, left) Representative images of Masson's trichrome staining on 10 μm slices of human biopsies from control (CTR), 2- and 8-year-old DMD patients. (right) Representative images of slices of human biopsies from control, 2- and 8-year-old DMD patients were probed for LC3 (green) and laminin (blue); nuclei were detected with DAPI (white). (b) Graph representing the fibrotic index (quantification of collagen deposition) of muscles measured as the percentage of blue fibrotic area on total muscle area (10 fields for each sample). (c) Plot representing the percentage of LC3-positive cells counted in slices of human biopsies from control, 2- and 8-year-old DMD patients based on the average of 12 fields for each experimental group. (d) Representative images of immunostaining for LC3 (green), MyoD (red) and laminin (blue) of 2- and 8-year-old DMD patients muscle biopsies; nuclei were detected with DAPI (white). (e) Schematic representation of the percentage of LC3-/MyoD+, LC3+/MyoD-, LC3+/MyoD+ cells counted in 2- and 8-year-old DMD patients muscle biopsies based on the average of 12 fields for each experimental group. (f) Representative images of immunostaining for LC3 (green), Pax7 (red) and Laminin (blue) of 2- and 8-year-old DMD patients muscle biopsies; nuclei were detected with DAPI (white). (g) Schematic representation of the percentage of LC3-/Pax7+, LC3+/Pax7- and LC3+/Pax7+ cells counted in 2- and 8-year-old DMD patients muscle biopsies based on the average of 12 fields for each experimental group. n.s., not significative. Scale bar, 50 μm. Statistical significance assessed by t-test, *P≤0.05, **P≤0.01, ***P≤0.001
Figure 3
Figure 3
Autophagic modulation impacts muscle regeneration in dystrophic mice. Representative images of TA (a) and D (d) isolated from 2-month-old mdx mice untreated (CTR) or treated with CLQ, administered at the dosage of 50 mg/kg by i.p. injections executed daily for 14 days, immunostained with laminin (green), eMyHC (red); nuclei were detected with DAPI (white) (n=5 for each experimental group). Plot representing the percentage of eMyHC-positive fibers in untreated and CLQ-treated mdx mice isolated from TA (b) and D (e) based on the average of eight fields for mice. Graph representing the percentage of centro-nucleated fibers counted in untreated and CLQ-treated mdx mice isolated from TA (c) and D (f) based on the average of eight fields for mice. Representative images of TA (g) and D (l) isolated from 5-month-old mdx mice fed with standard diet (CTR) or fed with LPD for 60 days, immunostained with laminin (green), eMyHC (red); nuclei were detected with DAPI (white) (n=3 for each experimental group). Plot representing the percentage of eMyHC-positive fibers in 5-month-old WT mice, in age-matched mdx mice fed with standard diet and LPD-fed isolated from TA (h) and D (m) based on the average of eight fields for mice. Graph representing the percentage of centro-nucleated fibers counted in WT, mdx standard-fed and LPD-fed mdx mice isolated from TA (i) and D (n) based on the average of eight fields for mice. Statistical significance assessed by t-test, *P≤0.05, **P≤0.01
Figure 4
Figure 4
The autophagic process contributes to muscle regeneration. Muscle damage was induced in the right leg of WT mice by injection of 20 μl of cardiotoxin (10 μM), while contro-lateral leg was left uninjured (CTR) (n=3 for each experimental group). (a) Representative images of control (CTR), 5 and 15 days p.i. of TA sections immunostained for eMyHC (red), LC3 (green) and laminin (blue); nuclei were detected with DAPI (white). (b) Graphs showing the percentage of LC3-positive cells in uninjured muscles (CTR) and after 5 and 15 days p.i. (c) Graphs showing the percentage of eMyHC-positive fibers in uninjured muscles (CTR) and after 5 and 15 days p.i. based on the average of eight fields for mice. (d) Protein extracts from whole muscles isolated from uninjured (CTR) and injured (INJ) TA 5 days p.i. were probed for p62, LC3 and GAPDH as loading control. Plots represent LC3II/GAPDH ratio and p62/GAPDH ratio based on the average for each experimental point (n=3). (e) qRT-PCR analysis of lc3 and p62 gene expression assessed in control (CTR) and after 5 days p.i. (INJ) TA muscles. (f) Representative images of serial cryosections from injured TA 5 days p.i. immunostained with LC3 (green), Pax7 (red/top panel), MyoD (red/bottom panel) and Laminin (blue); nuclei were detected with DAPI (white). (g) Schematic representation of the percentage of LC3 negative (grey bars) and LC3 positive (black bars) cells within MyoD-positive, Pax7-positive and MyoD/Pax7-double-positive cells, based on the average of eight fields for each mice. Scale bar, 50 μm. Statistical significance assessed by t-test, *P≤0.05, **P≤0.01, ***P≤0.001
Figure 5
Figure 5
The inhibition of autophagy reduces muscle repair. (a, top) Representative images of Hematoxilin/Eosin (H/E) staining on TA sections from injured WT mice treated or not with 3-MA (10 mg/kg daily i.p. injection for 5 days) analyzed 5 days p.i., n=3 for each experimental group. (bottom) Immunostaining for eMyHC (red) and Laminin (green) on TA sections from injured WT mice treated or not with 3-MA for 5 days analyzed at 5 days p.i. Nuclei were counterstained with DAPI (blue). (b) Plot representing the percentage of eMyHC based on the average of six fields for each sample. (c) qRT-PCR analysis of eMyHC gene expression analyzed in uninjured and injured WT mice treated or not with 3-MA and harvested 5 days p.i. (d) Quantification of average myofiber CSA 5 days after injury based on the average of six fields for each sample. (e, top) Representative images of H/E staining on TA sections from injured WT mice treated or not with 3-MA (10 mg/kg daily i.p. injection for 15 days) analyzed 15 days p.i. n=3 for each experimental group. (bottom) Immunostaining for eMyHC (red) and laminin (green) on TA sections from injured WT mice treated or not with 3-MA for 15 days analyzed 15 days p.i. (f) Plot representing the percentage of eMyHC based on the average of six fields for each sample. (g) qRT-PCR analysis of eMyHC gene expression analyzed in uninjured and injured WT mice treated or not with 3-MA and harvested 15 days p.i. (h) Quantification of average myofiber CSA 15 days after injury based on the average of six fields for each sample. Scale bar, 50 μm. Statistical significance assessed by t-test, *P≤0.05, **P≤0.01, ***P≤0.001
Figure 6
Figure 6
The autophagic process is induced in MuSCs during muscle regeneration. Ex vivo analysis of the autophagic process in FACS-sorted MuSCs from uninjured (n.i.) and injured mice. (a) MuSCs were isolated from three different mice for each time point as Ter119-/CD45-/CD31-/α7+/integrin+/Sca1- cells, collected and immediately analyzed after isolation by western blot analysis for p62, LC3, MyoD and Pax7 expression; GAPDH were used as loading control. (b) Plots representing the average of the quantization of LC3II/GAPDH, p62/GAPDH, MyoD/GAPDH and Pax7/GAPDH ratio in uninjured mice (n.i.) and after 5 and 15 days after injury based on three different experiments. (c) qRT-PCR analysis of lc3, p62, ulk1 and cyclinD1 expression in uninjured and after 5 and 15 days after injury in freshly isolated MuSCs. (d) Representative images of freshly isolated fibers untreated or treated with rapamycin (100 nM) and 3-MA (10 mM) for 96 h immunostained with MyoD (green) and Pax7 (red); nuclei were detected with DAPI (blue). The area within the drawn square is enlarged in the zoom panels. (e) Schematic representation of the percentage of MyoD+/Pax7-, MyoD-/Pax7+ and MyoD+/Pax7+ cells counted in fibers untreated (CTR) and treated with rapamycin (RAPA) and 3-MA based on n=3 mice per experimental group. Statistical significance assessed by t-test, *P≤0.05, **P≤0.01, ***P≤0.001

References

    1. Hoffman EP, Brown RH Jr., Kunkel LM. Dystrophin: the protein product of the Duchenne muscular dystrophy locus. Cell 1987; 51: 919–928. - PubMed
    1. Ervasti JM, Ohlendieck K, Kahl SD, Gaver MG, Campbell KP. Deficiency of a glycoprotein component of the dystrophin complex in dystrophic muscle. Nature 1990; 345: 315–319. - PubMed
    1. Allen DG, Whitehead NP, Froehner SC. Absence of dystrophin disrupts skeletal muscle signaling: roles of Ca2+, reactive oxygen species, and nitric oxide in the development of muscular dystrophy. Physiol Rev 2016; 96: 253–305. - PMC - PubMed
    1. Matsumura K, Campbell KP. Dystrophin-glycoprotein complex: its role in the molecular pathogenesis of muscular dystrophies. Muscle Nerve 1994; 17: 2–15. - PubMed
    1. Dumont NA, Wang YX, von Maltzahn J, Pasut A, Bentzinger CF, Brun CE et al. Dystrophin expression in muscle stem cells regulates their polarity and asymmetric division. Nat Med 2015; 21: 1455–1463. - PMC - PubMed

Publication types