. 2019 Jan 1;527(1):87-116.
doi: 10.1002/cne.24084. Epub 2016 Aug 23.

Rod-cone crossover connectome of mammalian bipolar cells

Affiliations

Rod-cone crossover connectome of mammalian bipolar cells

J Scott Lauritzen et al. J Comp Neurol. .

Abstract

The basis of cross-suppression between rod and cone channels has long been an enigma. Using rabbit retinal connectome RC1, we show that all cone bipolar cell (BC) classes inhibit rod BCs via amacrine cell (AC) motifs (C1-6); that all cone BC classes are themselves inhibited by AC motifs (R1-5, R25) driven by rod BCs. A sparse symmetric AC motif (CR) is presynaptic and postsynaptic to both rod and cone BCs. ON cone BCs of all classes drive inhibition of rod BCs via motif C1 wide-field GABAergic ACs (γACs) and motif C2 narrow field glycinergic ON ACs (GACs). Each rod BC receives ≈10 crossover AC synapses and each ON cone BC can target ≈10 or more rod BCs via separate AC processes. OFF cone BCs mediate monosynaptic inhibition of rod BCs via motif C3 driven by OFF γACs and GACs and disynaptic inhibition via motifs C4 and C5 driven by OFF wide-field γACs and narrow-field GACs, respectively. Motifs C4 and C5 form halos of 60-100 inhibitory synapses on proximal dendrites of AI γACs. Rod BCs inhibit surrounding arrays of cone BCs through AII GAC networks that access ON and OFF cone BC patches via motifs R1, R2, R4, R5 and a unique ON AC motif R3 that collects rod BC inputs and targets ON cone BCs. Crossover synapses for motifs C1, C4, C5, and R3 are 3-4× larger than typical feedback synapses, which may be a signature for synaptic winner-take-all switches. J. Comp. Neurol. 527:87-116, 2019. © 2016 The Authors The Journal of Comparative Neurology Published by Wiley Periodicals, Inc.

Keywords: RRID AB_2341093; RRID AB_2532053; RRID AB_2532055; RRID AB_2532057; RRID AB_2532059; RRID AB_2532060; RRID AB_2532061; RRID SCR-002937; RRID SCR-008606; RRID SCR_001622; RRID SCR_005986; RRID SCR_008394; amacrine cells; cone vision; connectomics; networks; retina; rod vision; synapses; transmission electron microscopy.


Conflict of interest statement

REM is a principal of Signature Immunologics, Inc., manufacturer of some antibodies used in this study.

Figures

Figure 1
Figure 1
Rod‐cone vision over the daily light curve. A: The light curve (black) for a temperate latitude fluctuates through overlapping photopic and scotopic ranges. Nocturnal floors set by lunar phase, latitude, and overcast dynamics can create mesopic ranges of a few to many hours. B: In nonmammalians, rod signals are collected by mixed rod‐cone bipolar cells (BCs) that directly drive ganglion cells (GCs), resulting in two‐stage excitatory amplification for rods (n2). C: In mammals, rod signals collected by rod BCs are aggregated by AII amacrine cells (ACs) and redistributed into the cone BC chain, resulting in three‐stage excitatory amplification (n3) targeting GCs. n, amplifying glutamatergic synapse. Light curves are generalized from open access insolation datasets (e.g., http://www.ncdc.noaa.gov).
Figure 2
Figure 2
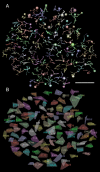
The rod bipolar cell array in RC1. A: VikingView renderings of 104 rod BC axonal fields in the volume. B: The convex hull for every rod BC axonal field and each cell's index number. Scale bar = 50 μm in A.
Figure 3
Figure 3
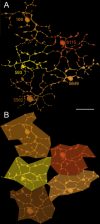
A fragment of a cone BC array in RC1 defining a coupled path. A: Five coupled CBb5 bipolar cells and their index numbers. B: Constrained star domains for CBb5 cells cover more territory than rod BC convex hulls. Scale bar = 20 μm in A.
Figure 4
Figure 4
A set of inhibitory processes forming a network minimum spanning tree for C motifs in RC1. Each process represents an element that forms an inhibitory synapse on one rod bipolar cell. Warm colors denote GABAergic cells including three GABAergic somas (598, 5294, 5454); greens are glycinergic cells (278, 5487, 5643). Scale bar = 50 μm.
Figure 5
Figure 5
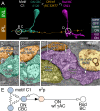
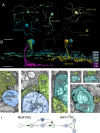
Motif C1. A: Direct inhibition between an ON cone BC (CBC 6120, cyan) and a rod BC cell (Rod BC 5923, magenta) mediated by a wide‐field (wf) GABAergic AC process (γAC 32477, orange). Symbols: > sign‐conserving glutamate synapse; >i sign‐inverting GABA or glycine synapse. Circles and letters mark locations of ultrastructure in following panels. Guides for anatomic (left) and functional layers (right). B: Ribbon synapse (r, arrow) from ON CBC 6120 to ON wf γAC 32477. C: Conventional synapse (arrow) from ON wf γAC 32477 to ON CBC 6120. D: Composite of synapses (arrows) onto Rod BC terminal 5923 from AI AC 39986, and motif C1 ACs 39982 and 32477 (box). E: Motif C1 diagram. A patch of coupled (resistor symbols) ON CBCs are presynaptic via sign‐conserving synapses (black arrows) and postsynaptic via sign‐inverting synapses (white arrows) to an ON wf γAC, which is in turn presynaptic (but not postsynaptic) to rod BCs. The net glutamatergic gain of the C1 chain from cones → ON CBCs → ON wf γAC is n2, assuming each roughly similar stage has a gain n. Inhibitory gain is p. The total gain is n2p. See Marc et al. (2013). Scale bars = 20 μm in A; 500 nm in B–D.
Figure 6
Figure 6
Motif C2. A: Direct inhibition between an ON CBC (278, cyan) and rod BCs (342, 334, magenta) mediated by a narrow‐field (nf) glycinergic amacrine cell (GAC, green). B: Ribbon synapse (r, arrow) from ON CBC 277 to ON nf GAC 278. Inset shows a clear postsynaptic gap in a serial section. C: Conventional synapses from multiple motif C cells onto rod BC 342. D: Motif C2 diagram. Conventions as in Fig. 1. Scale bars = 20 μm in A; 200 nm in B,C.
Figure 7
Figure 7
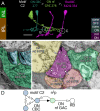
Motif C3. A: Disynaptic inhibition between an OFF cone CBC (steel) and a rod BC (10960, magenta) mediated by a narrow‐field (nf) glycinergic amacrine cell (GAC, green) and a bistratified (bs) γAC (orange) that only receives inhibitory input. The bs γAC is also presynaptic to ON CBCs (cyan). B: OFF CBC 5596 driving nf GAC 60558. C: Conventional synapse from nf GAC 60558 to bs γAC 5281. D: ON bs γAC targeting ON CBC 483. Inset, enlarged synapse. E: ON bs γAC targeting rod BC 10960. F: GABA channel signal (orange) superimposed on the soma of ON bs γAC surrounded by gray Müller cells. Arrows indicate dendro/axosomatic synapses. G: A composite of three sections to visualize four dendro/axosomatic synapses (11651, 11683, 43130, 43114) onto AC 5281. Polygons denote spliced sections. H: Enlargement of synapse from AC 11683. I: Motif C3 diagram. Conventions as in Fig. 1. The gain for disynaptic chains is n2p2. Scale bars = 20 μm in A; 500 nm in B,C, inset in D, H; 1000 nm in D,E; 5 μm in F,G.
Figure 8
Figure 8
Motif C4. A: Top, AI AC 4943 in orange, the target of motif C4. Bottom, reflected image in gray with all AC postsynaptic densities (PSDs) in red. The polygon circumscribes the cell's OFF sublayer dendrites. Two of the input/target rod BCs (517, 518 magenta) of the AI AC define the ON sublayer dendritic zone. Rectangular inset shows clustered PSDs. B: Path from OFF CBC 172 (steel) to OFF wf γAC 13448 (orange) to AI γAC 4943 (red) to rod BCs 469 (shown, magenta) and 8586 (not shown). C: OFF CBC 172 to OFF wf γAC 13448 ribbon synapse. D: Giant conventional synapse from OFF wf γAC 13448 to AI γAC 4943. The image is the fusion of two adjacent slices. E: Small conventional synapse from AI γAC 4943 to rod BC 469. F: Ribbon synapses from rod BC 8586 to AI γAC 4943. G: Motif C4 diagram. Conventions as in Fig. 1. Scale bars = 50 μm in A; 1000 nm in A, inset, C–E; 500 nm in F.
Figure 9
Figure 9
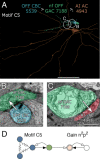
Motif C5. A: AI AC 4943 (orange), the target of motif C5 cells OFF CBC 5539 (steel) and nf OFF GAC 7188 (green). B: Ribbon synapse from OFF CBC 5539 to nf GAC 7188. C: Giant conventional synapse from OFF nf GAC 7188 to AI γAC 4943. D: Motif C5 diagram. Conventions as in Fig. 1. Scale bars = 50 μm in A; 500 nm in B; 1000 nm in C.
Figure 10
Figure 10
Motif CR, dual rod‐cone inhibition through a single γAC. A: Rod BCs (285, 464, magenta) presynaptic and postsynaptic to a γAC process (20299, orange) that is also presynaptic and postsynaptic to an array of ON CBCs (286 steel, 71935 cyan, 483 and 431 not shown). B: A serial section run showing ON γAC 20299 postsynaptic to ribbon synapse (z236), both presynaptic and postsynaptic (z237), and presynaptic (z238) to rod BC 285. C: A serial section pair showing a synaptic ribbon from ON CBC 71935 to ON γAC 20299 (z296) and the extensive PSD of ON γAC 20299 (z298). D: ON γAC 20299 presynaptic to ON CBC 286. E: Motif CR. Conventions as in Fig. 1. Note that the gain is symmetrical. Scale bars = 10 μm in A; 1000 nm in B–D.
Figure 11
Figure 11
Motif R1. A: Path through a rod BC (471, magenta) presynaptic to an AII AC (514, gold, synapse not shown), in turn coupled to an ON CBC (1724, green). ON wf γAC 23512 (yellow) is postsynaptic to ON CBC 1724 and presynaptic to a patch ON CBCs through CBC 170 (copper). B: A gap junction (arrowheads) between AII AC 514 and ON CBC 1724. C: Parallel section through a ribbon synapse from ON CBC 1724 to ON wf γAC 23512. D: Synapse from ON wf γAC 23512 to ON CBC 170. E: Motif R1. Conventions as in Fig. 1. Note that the gain is increased by a factor of n over C motifs due to the additional bipolar cell synapse, and modified by the resistive coupling gain c. Scale bars = 50 μm in A; 500 nm in B–D.
Figure 12
Figure 12
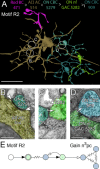
Motif R2, the glycinergic variant of motif R1. A: Path through rod BC 471 to AII AC 514, coupled to ON CBC 5279 (cyan), then presynaptic to ON nf GAC 5282 (yellow green) which is ultimately presynaptic to ON CBC 909 (blue). B: A gap junction (arrowheads) between AII AC 514 and ON CBC 5279. C: Parallel section through a ribbon synapse from ON CBC 5729 to ON nf GAC 23512. D: Synapse from ON nf GAC 23512 to ON CBC 909. E: Motif R2. Conventions as in Figs. 1 and 11. Scale bars = 50 μm in A; 500 nm in B–D.
Figure 13
Figure 13
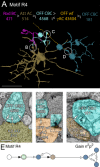
Motif R4, the OFF variant of motif R1. A: Path through rod BC 471 to AII AC 514, presynaptic to OFF CBC 4568 (cyan), then presynaptic to OFF wf γAC 43404 (orange) which is ultimately presynaptic to OFF CBC 181 and patch of coupled OFF CBCs. B: A glycinergic synapse cluster (arrows) between AII AC 514 and OFF CBC 4568. C: Dot ribbon synapse from OFF CBC 4568 to OFF wf γAC 43404. Inset, dot ribbon synapse enlarged 2.5×. D: Synapse from OFF wf γAC 43404 to OFF CBC 181. E: Motif R4. Conventions as in Fig. 1. Scale bars = 50 μm in A; 500 nm in B–D; 200 nm for the inset in C.
Figure 14
Figure 14
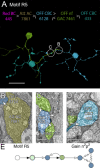
Motif R5, the glycinergic variant of motif R3. A: Path through rod BC 445 (not shown) to AII AC 7861 (not shown), presynaptic to OFF CBC 6128 (blue), then presynaptic to OFF nf GAC 7461 (green) which is ultimately presynaptic to OFF CBC 433 (cyan). B: A glycinergic synapse between AII AC 7861 and OFF CBC 6128. C: Ribbon synapse from OFF CBC 6128 to OFF nf GAC 7461 (green, lower segment); conventional synapse from OFF nf GAC 7461 (green, upper segment) to OFF CBC 6128. D: Synapse from OFF nf GAC 7461 to OFF CBC 433. E: Motif R5. Conventions as in Fig. 1. Scale bars = 50 μm in A; 500 nm in B–D.
Figure 15
Figure 15
Motif R3, the rod variant of motif C1. A: Path through rod BC 5563 (magenta) to ON wf γAC 18282 (orange), presynaptic to a large collection of ON CBCs, exemplified here by ON CBC 332 (cyan). B: A ribbon synapse from rod BC 5563 onto ON wf γAC 18282 and AII GAC 7050. C: Conventional synapse from ON wf γAC 18282 to ON CBC 332. D: A ribbon synapse from ON CBC 332 onto ON wf γAC 18282. E: Motif R3. Conventions as in Fig. 1. Scale bars = 50 μm in A; 500 nm in B–D.
Figure 16
Figure 16
Motif R25, the ON‐OFF variant of motifs R2 and R5. A: Four monostratified ON‐OFF GACs (906, 5497, 7134, 7568) and CBa2 478. B: Stratification of GAC 906 compared to rod BC 518, CBa2 478, CBb3 90 and CBb5 593. C: Glycinergic synapse from AII AC 22634 to OFF CBC 478. D: Ribbon synapse from OFF CBC 478 to GACs 906 (class 1) and 7568 (class 4). E: Synapse from class 1 ON‐OFF GAC 906 to ON CBC 307. F: Axonal ribbon from CBb6 ON CBC 4570 to GAC 906. G: Conventional synapse from GAC 906 to ON CBC 4570. H: Gap junction (between arrowheads) between ON CBC 4570 and AII AC 3257. Motif R25. Conventions as in Fig. 1. Scale bars = 20 μm in A; 10 μm in B; 1000 nm in C; 500 nm in D‐F,H.
Figure 17
Figure 17
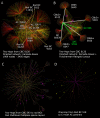
Tulip visualizations of the complete RC1 annotation set using different layout algorithms. Dataset of 1.25M annotations, 12274 nodes, and 18690 edges. Color rules are associated with different cell classes and are dominated by red γAC edges. A: Random node display. B: The bubble‐tree hierarchical layout places heavily connected nodes at the hubs of circles and children on the rim. C: The Frutcherman‐Reingold algorithm using force‐directed layouts. D: The Frutcherman‐Reingold layout with bundling of related edges into single cables. E: A fast multilevel multipole (FMM) layout uses a force‐directed approach with partitioning to achieving faster solutions. The node neighborhoods are surrounded by tracts of edges. F: By reducing the number of nodes and edges to those associated with a single rich node, a simple layout is achieved.
Figure 18
Figure 18
Crossover network discovery using Tulip. A: Two‐hop AC paths (pale yellow) between C1 motif ON CBC 6120 and four rod BCs (5923, 11044, 9183, 52257). Kamada‐Kawai force‐directed layout. B: Frutcherman‐Reingold modification of panel A showing the key ON CBC hubs to which CBb 6120 is connected (white edges) and two major targets it drives with heavy synaptic ribbon contact (green edges). The ON CBC → AC → rod BC hops are embedded in the intervening mesh (magenta). C: Sparse two‐hop network (excess unrelated cells pruned) based on ON CBC 593 using the FMM layout and edge bundling. ON CBC → AC → rod BC paths to 14 rod BCs (magenta squares) are exposed. D: Sparse one‐hop network (excess unrelated cells pruned) based on Rod BC 518 using a stress‐majorization layout and edge bundling to reveal 11 connected CBC‐driven (non‐AI) ACs (large bright icons).
Figure 19
Figure 19
Complete RC1 datasets displayed as a bubbletree with successful 2‐hop motif test paths in pale yellow edges. A: Class C1/C2 ONC CBC motifs (CBb → AC → rod BC). B: Test for OFF 2‐hop motifs (CBa → AC → Rod BC) exposes one candidate. Upon analysis this proves to be an annotation error. C: Test for OFF 2‐hop motifs (CBa → AC → AI γAC) exposes multiple complete candidate paths, all validated. D: Test for ON CBC feedback paths (CBb → AC → CBb) that reveal hubs for CBb3 (pale blue), CBb4 (pale green) and CBb5 (pale red) cells.
Figure 20
Figure 20
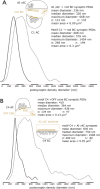
Histograms of PSDs associated with conventional inhibitory synapses. Ordinate: Peak normalized frequency. Abscissa: PSD diameter in nm A. Comparison of AI γAC and motif C1 synapse PSDs onto rod BCs. P‐value for the Kolmogorov–Smirnov nonparametric test is 3.1 × 10⁻²². B: Comparison of motif C4 synapse PSDs onto AI γACs and OFF CBCs B. P‐value for the Kolmogorov–Smirnov nonparametric test is 9.66 × 10⁻²⁴. Datasets available as Table_S2.pdf.
Figure 21
Figure 21
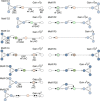
Summary of rod‐cone crossover motifs. Key: white rod BC, pale blue ON CBCs, dark blue OFF CBCs, pale red ON wide‐field γACs, pale red double ring AI γACs, dark red OFF wide‐field γACs, pale green ON narrow‐field GACs, pale green double ring AII GACs, dark green OFF narrow‐field GACs, resistors denote coupling, solid arrows are glutamate synapses, open arrows are GABA/glycine synapses. Gain n denotes glutamate steps starting from the photoreceptors and ignoring polarity; gain p denotes inhibitory steps; gain c denotes coupling.
Figure 22
Figure 22
Summary diagrams of spatial motif features. Each target BC is surrounded by fields of inhibition. A: Motifs C1 and C2. Each rod BC is inhibited by both wide‐field γACs and narrow‐field GACs driven by patches of coupled ON CBCs. B: Motif C3. Each field of rods is inhibited by a bistratified ON γACs driven by OFF γACs and GACs. C: Motifs C4, C5, C6. Each field of rods is inhibited by cognate ON AI ACs that are themselves inhibited by wide‐field OFF γACs and narrow‐field OFF GACs, and directly driven by CBb6 BCs. D: Motif CR. A wide‐field ON γACs is driven by and inhibits both rod and cone BCs. E: Motifs R1 and R2. Each patch of ON CBCs is inhibited by wide‐field γACs and narrow‐field GACs whose drive originates in displaced rod / AII GAC complexes. F: Motifs R4 and R5. Each patch of OFF CBCs is inhibited by wide‐field γACs and narrow‐field GACs whose drive originates in displaced rod / AII GAC complexes. G: Motif R3. Each patch of ON CBCs is inhibited by a wide‐field γAC driven directly by a rod BC.

References

    1. Aguilar M, Stiles WS. 1954. Saturation of the rod mechanism of the retina at high levels of stimulation. Opt Acta (Lond) 1:59–65.
    1. Alpern M. 1978. The eyes and vision In: Driscoll WG, Vaughn W, editors. Handbook of optics, 1st ed. New York: McGraw‐Hill; p 12–21.
    1. Anderson JR, Jones BW, Yang J‐H, Shaw MV, Watt CB, Koshevoy P, Spaltenstein J, Jurrus E, UV K, Whitaker R, Mastronarde D, Tasdizen T, Marc RE. 2009. A computational framework for ultrastructural mapping of neural circuitry. PLoS Biol 7:e1000074 - PMC - PubMed
    1. Anderson JR, Grimm B, Mohammed S, Jones BW, Spaltenstein J, Koshevoy P, Tasdizen T, Whitaker R, Marc RE. 2011a. The Viking Viewer: Scalable multiuser annotation and summarization of large connectomics datasets. J Microsc 241:13–28. - PMC - PubMed
    1. Anderson JR, Jones BW, Watt CB, Shaw MV, Yang J‐H, DeMill D, Lauritzen JS, Lin Y, Rapp KD, Mastronarde D, Koshevoy P, Grimm B, Tasdizen T, Whitaker R, Marc RE. 2011b. Exploring the retinal connectome. Mol Vis 17:355–379. - PMC - PubMed

Publication types

MeSH terms