. 2016 Jul 22:7:12230.
doi: 10.1038/ncomms12230.

Nuclear receptor NR5A2 controls neural stem cell fate decisions during development

Affiliations

Nuclear receptor NR5A2 controls neural stem cell fate decisions during development

Athanasios Stergiopoulos et al. Nat Commun. .

Abstract

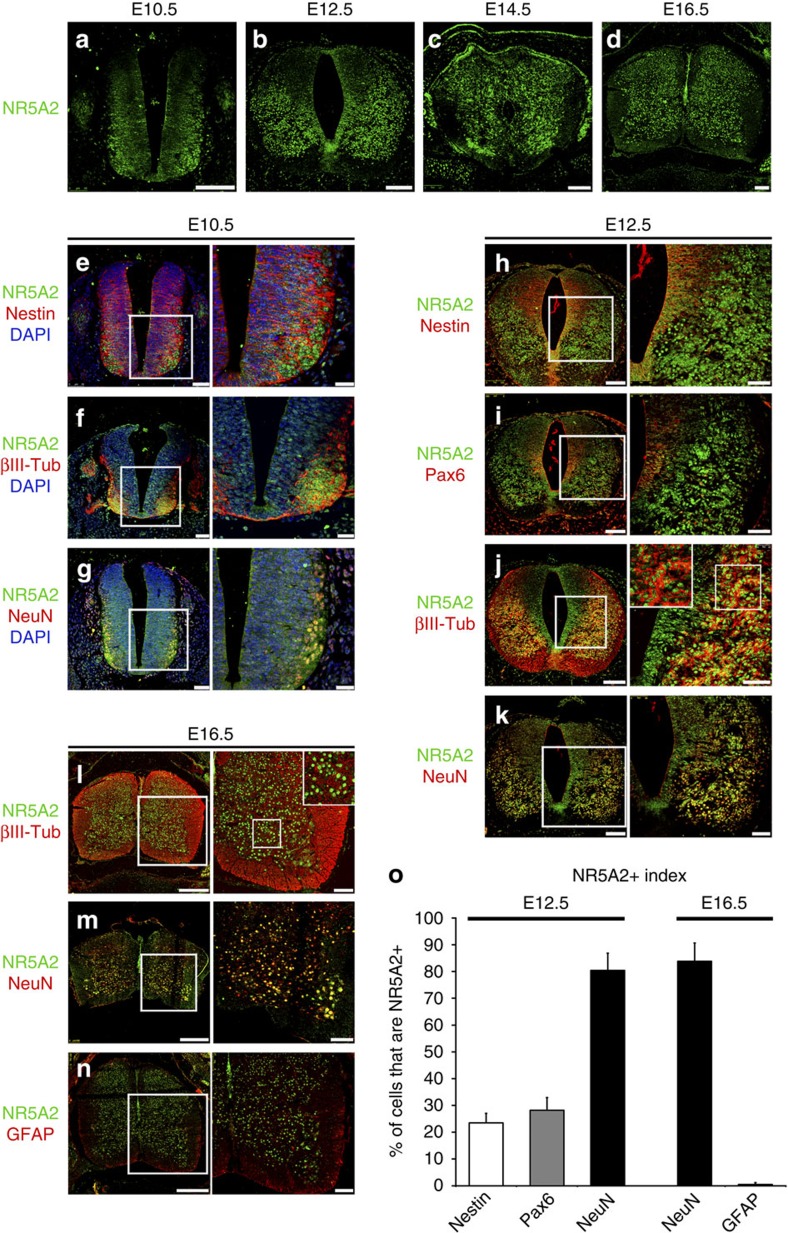
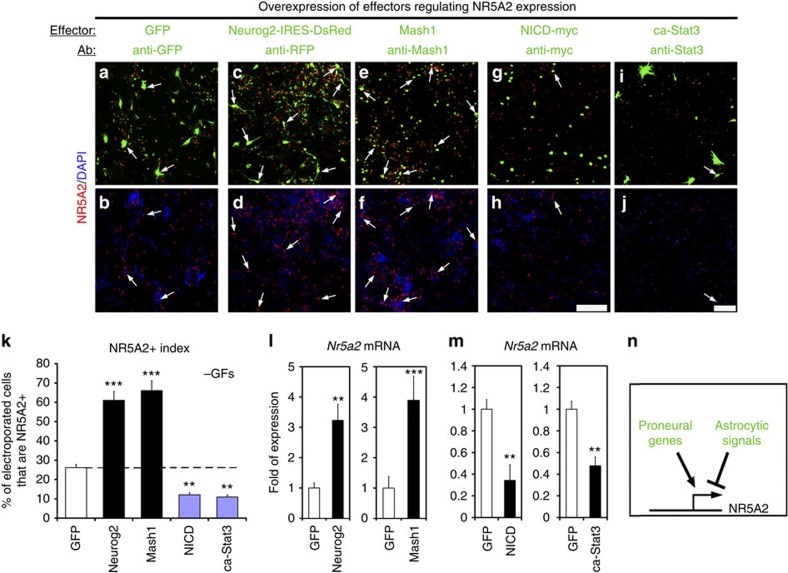
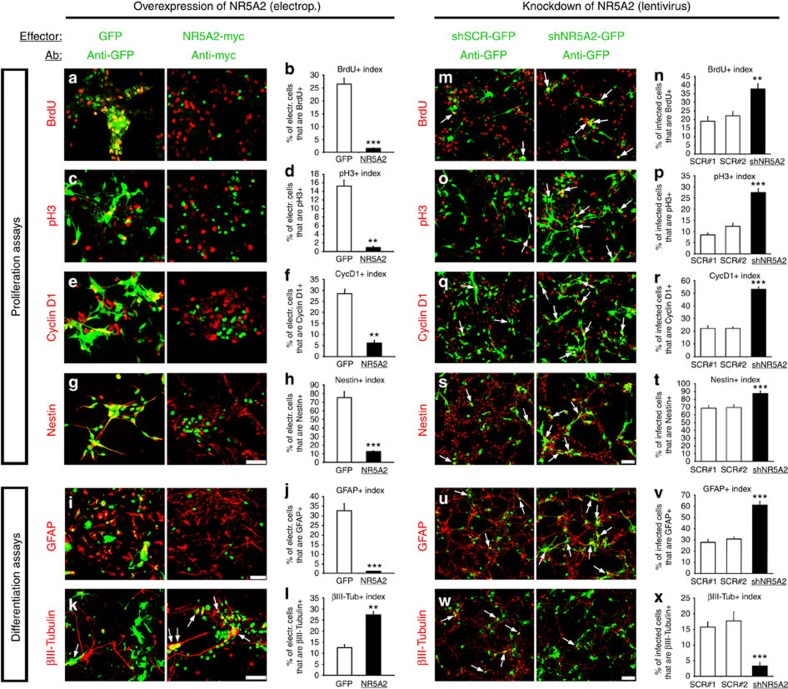
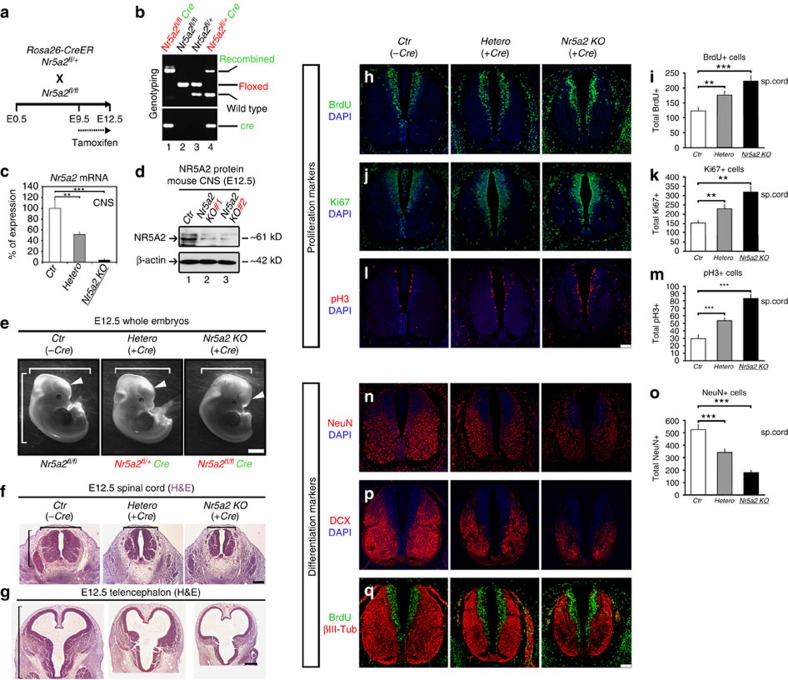
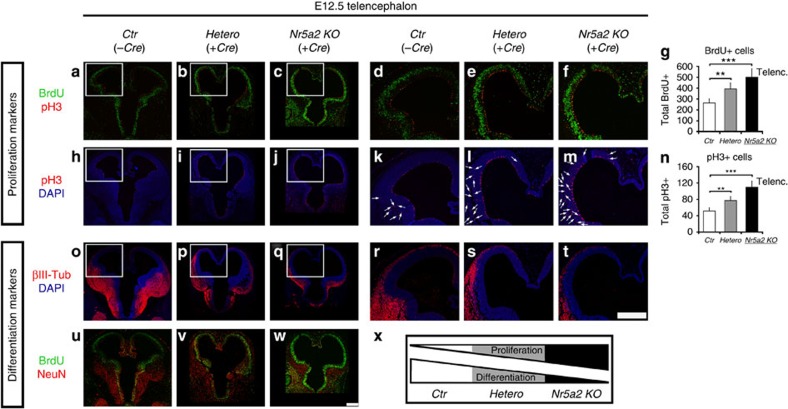
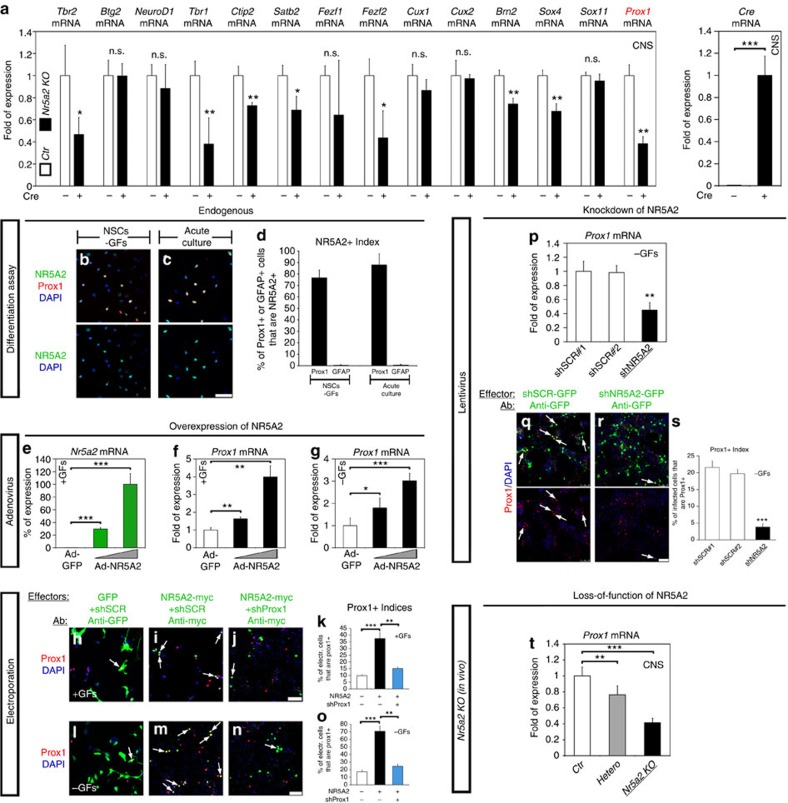
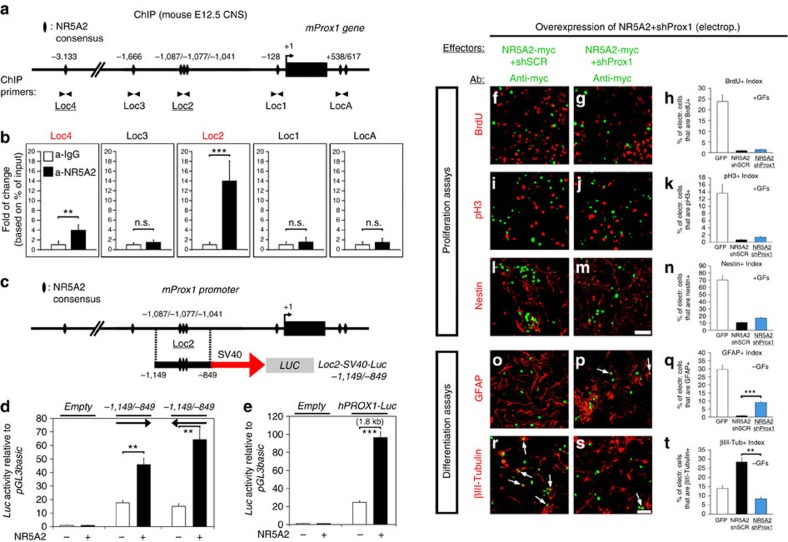
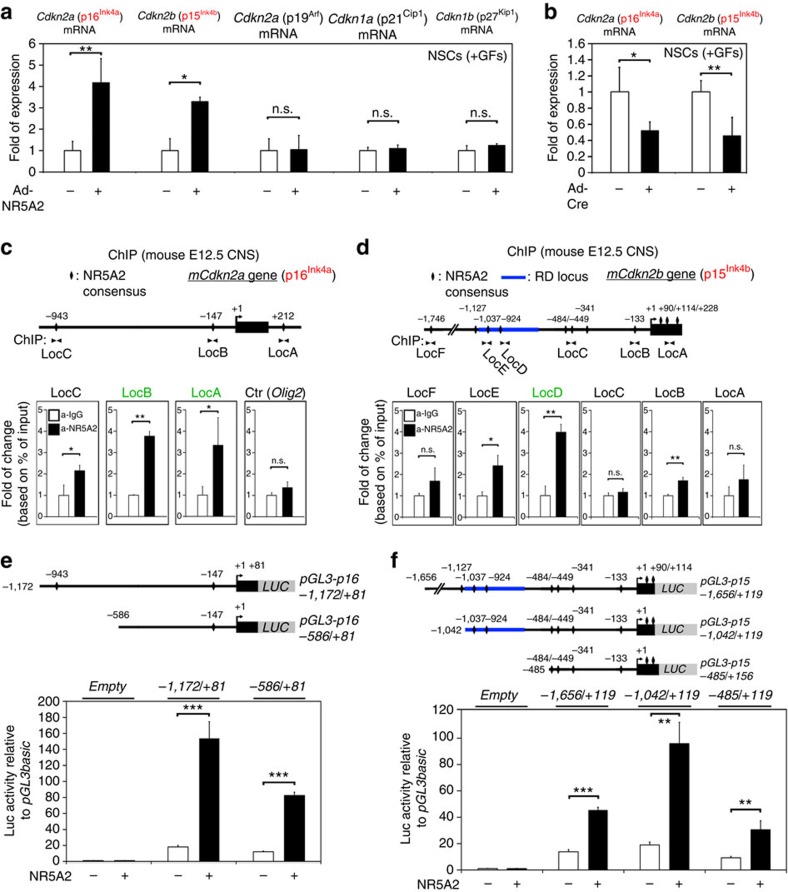
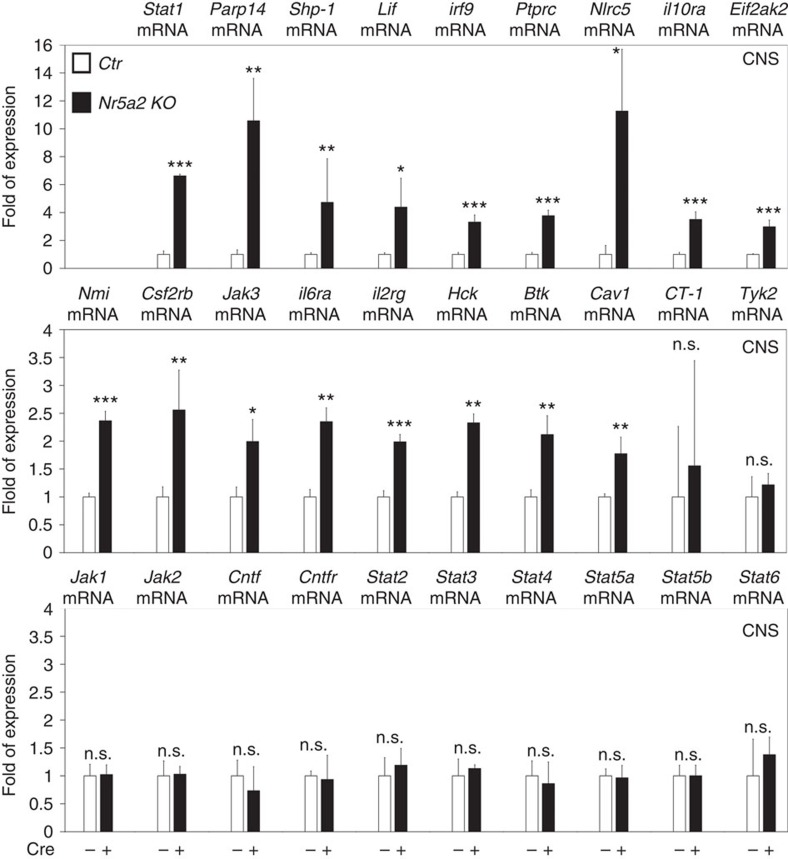
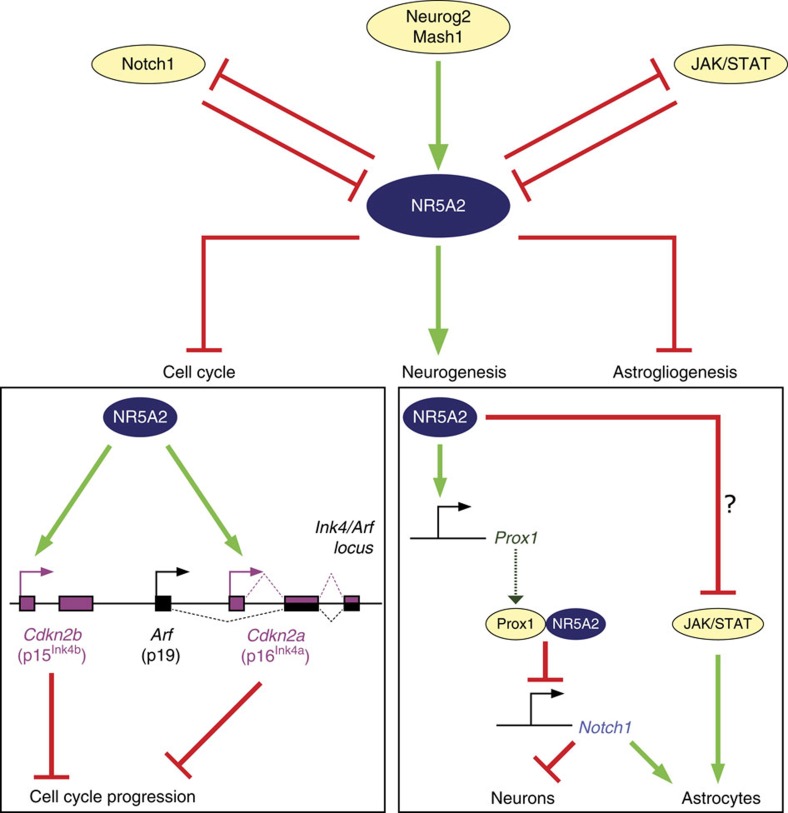
The enormous complexity of mammalian central nervous system (CNS) is generated by highly synchronized actions of diverse factors and signalling molecules in neural stem/progenitor cells (NSCs). However, the molecular mechanisms that integrate extrinsic and intrinsic signals to control proliferation versus differentiation decisions of NSCs are not well-understood. Here we identify nuclear receptor NR5A2 as a central node in these regulatory networks and key player in neural development. Overexpression and loss-of-function experiments in primary NSCs and mouse embryos suggest that NR5A2 synchronizes cell-cycle exit with induction of neurogenesis and inhibition of astrogliogenesis by direct regulatory effects on Ink4/Arf locus, Prox1, a downstream target of proneural genes, as well as Notch1 and JAK/STAT signalling pathways. Upstream of NR5a2, proneural genes, as well as Notch1 and JAK/STAT pathways control NR5a2 endogenous expression. Collectively, these observations render NR5A2 a critical regulator of neural development and target gene for NSC-based treatments of CNS-related diseases.


Conflict of interest statement

The authors declare conflict of interests.

Figures

Figure 1
Figure 1. NR5A2 expression pattern is correlated with neuronal lineage during spinal cord development.
(ad) Immunostainings of NR5A2 (green) on transverse paraffin sections from E10.5 (a), E12.5 (b), E14.5 (c) or E16.5 (d) mouse spinal cord. (en) Double immunostainings of NR5A2 (green) with Nestin (e, h), Pax6 (i), βIII-Tubulin (f, j, l), NeuN (g, k, m) or GFAP (n) (all red) at E10.5 (eg), E12.5 (hk) or E16.5 (ln) mouse spinal cord, as indicated. Control immunofluorescences without primary antibody showed no staining. Inlets in the right panels of j and l represent larger magnifications of the areas included into the square shapes of the corresponding images. (o) Quantification of the cell populations that express NR5A2 (% of marker+; NR5A2+/total marker+). Values represent the mean±s.d. of four animals (n=4). Scale bars, (ad), 100 μm; (eg), 50 μm, 25 μm; (hk), 100 μm, 50 μm; (ln), 250 μm, 75 μm.
Figure 2
Figure 2. NR5A2 expression is regulated by proneural and astrogliogenic signals.
(aj) Double GFP/NR5A2 (a,b), RFP (Neurog2, pseudo-colored green)/NR5A2 (c,d), Mash1/NR5A2 (e,f), Myc(NICD)/NR5A2 (g,h) or Stat3/NR5A2 (i,j) immunostainings of NSCs electroporated with various constructs, as indicated. Arrows mark representative cells that co-express the transgenes (green) and NR5A2 protein (red). Cell nuclei were visualized with DAPI staining (blue). (k) Quantification of electroporation data shown in aj (% of transgene+; NR5A2+/total transgene+). (l,m) RT–qPCRs showing the quantification of Nr5a2 mRNA levels in differentiating NSCs, electroporated with GFP, Neurog2, Mash1, NICD-myc and ca-Stat3, as indicated. (n) Schematic representation of the upstream signals that regulate NR5A2. In every case, arrows indicate representative electroported cells that co-express each marker. The results are shown as mean±s.d. **P<0.01, ***P<0.001 (Student's t-test). Scale bars, 100 μm.
Figure 3
Figure 3. NR5A2 regulates self-renewal and differentiation properties of NSCs.
(al) Double immunostainings of Amaxa-electroporated NSCs with GFP or NR5A2-myc (green, detected with myc) and various markers (all red), as indicated (ak). Quantifications of the indices of the above markers are shown in b, d, f, h, j and l, respectively (% of GFP+ or NR5A2-myc+; marker+/total GFP+ or NR5A2-myc+). (mx) Double immunostainings of GFP with the same markers, as indicated. Cells were infected with lentiviruses expressing control-scrambled sequences (shSCR#1-GFP, shSCR#2-GFP) or one potent shRNA targeting mouse NR5A2 (shNR5A2-GFP). All vectors co-express GFP from independent promoters. Quantifications of the indices are shown in n, p, r, t, v and x (% of GFP+; marker+/total GFP+). In every case, arrows indicate representative GFP+ or NR5A2-myc+ cells that co-express each marker. The results are shown as mean±s.d. **P<0.01, ***P<0.001 (Student's t-test). Scale bars, 50 μm.
Figure 4
Figure 4. Temporal deletion of NR5A2 affects mouse CNS development.
(a) Schematic representation of the knockout strategy. (b) Assessment of recombination of the floxed Nr5a2 locus by genotyping PCR in CNS tissue, as indicated. Note the efficient recombination of the floxed Nr5a2 alleles in the presence of a single allele of CreER (lane 1). (c,d) RT–qPCR (c) and western blot (d) analyses in E12.5 CNS of Ctr, Hetero and Nr5a2 KO animals for the detection of Nr5a2 mRNA and protein levels, respectively. (e) Stereoscopic views of E12.5 Ctr, Hetero and Nr5a2 KO whole-mouse embryos. The white arrowheads depict the forebrain of each embryo. Note the large difference in the size of the forebrain of Nr5a2 KO mice (right panel). (fg) Histological sections of E12.5 spinal cords (f) and E12.5 telencephalons (g) of Ctr, Hetero and Nr5a2 KO littermates, stained with haematoxylin & eosin. Note the substantial size reduction of both structures (square brackets) in Nr5a2 KO embryos and to a lesser extent in Hetero embryos. (hq) Phenotypic analysis of Hetero (centre panels) and Nr5a2 KO (right panels) spinal cords, compared with Ctr (left panels), in relation to various proliferation (hm) or differentiation (nq) markers, as indicated. Note the ectopic proliferating cells (BrdU+, Ki67+, pH3+) that are localized outside the VZ and do not express neuronal markers (for example, βIII-Tubulin). Quantifications of BrdU+, Ki67+, pH3+ and NeuN+ cells are shown in i, k, m and o, respectively (total marker+/spinal cord section). All values represent the mean±s.d. of four animals (n=4). **P<0.01, ***P<0.001 (Student's t-test). Scale bars, (e) 250 μm; (f,g), 250 μm; (hq), 75 μm.
Figure 5
Figure 5. Cre/LoxP-mediated temporal deletion of NR5A2 affects telencephalon development.
(aw) Phenotypic analysis of Hetero (center panels) and Nr5a2 KO (right panels) experimental E12.5 telencephalons, compared with Ctr (left panels), in relation to various proliferation (an) or differentiation (ow) markers: immunofluorescence images of representative sections depicting the double BrdU+ (green)/pH3+ (red) (af), pH3+ (hm), βIII-Tubulin+ (ot) and BrdU+ (green)/NeuN+ (red) (uw) cells. df, km, rt micrographs are larger magnifications of the square shapes depicted in ac, hj, oq, respectively. Quantifications of BrdU+ and pH3+ cells are shown in g and n, respectively (total BrdU+ or pH3+/telencephalon section). Arrows in representative pictures (km) indicate the ectopic pH3+-proliferating cells that are localized outside the VZ. (x) Schematic representation of the effects of NR5A2 deletion on proliferation and differentiation markers in the telencephalon of E12.5 mouse embryos. All values represent the mean±s.d. of four animals (n=4). **P<0.01, ***P<0.001 (Student's t-test). Scale bars, 250 μm.
Figure 6
Figure 6. NR5A2 enhances the expression of Prox1 gene.
(a) RT–qPCR analysis in E12.5 CNS of Ctr and Nr5a2 KO animals, as indicated. Values represent the mean±s.d. of four animals (n=4). (b,c) Double immunostainings of endogenous NR5A2 (green) with Prox1 (red) in differentiating NSCs (b) or acute cultures of E14.5 spinal cord tissue (c). (d) Quantification of the Prox1+ or GFAP+ cells that express NR5A2 (% of marker+; NR5A2+/total marker+). (eg) RT–qPCRs showing the quantifications of Nr5a2 (e) and Prox1 (fg) mRNA levels in proliferating (e,f) or differentiating (g) NSCs, infected with Ad-GFP or Ad-NR5A2 viruses. (hj, ln) Double immunostainings of GFP or myc (green) with Prox1 (red) in NSCs co-electroporated (Amaxa) with GFP+shSCR (h,l), NR5A2-myc+shSCR (i,m) or NR5A2-myc+shProx1 (j,n) transgenes and cultured in the presence (hj) or absence of GFs (ln). Arrows indicate representative double positive cells. (k,o) Quantification of Prox1 index in +/− GFs, respectively. (ps) RT–qPCR (p) and double GFP (green)/Prox1 (red) immunofluorescence analysis (q,r) indicating the downregulation of Prox1 mRNA and protein levels, respectively, in differentiating NSCs infected with shNR5A2 compared with shSCR lentiviruses. Arrows indicate representative double GFP+/Prox1+ cells. Quantification of Prox1 index is indicated in s (% of GFP+; Prox1+/total GFP+). (t) RT–qPCR quantification of Prox1 mRNA in E12.5 CNS of Ctr, Hetero and Nr5a2 KO mice. The results are shown as mean±s.d. NS, not significant. P>0.05, *P<0.05, **P<0.01, ***P<0.001 (Student's t-test). Scale bars, 50 μm.
Figure 7
Figure 7. NR5A2 regulates Prox1 expression via direct activation of Prox1 promoter.
(a) Schematic representation of mouse Prox1 gene locus. (b) ChIP analysis for the binding of NR5A2 to Prox1 gene in chromatin prepared from the CNS of E12.5 mouse embryos. (c) Schematic representation of the luciferase-reporter constructs containing the mouse DNA sequence of Loc2 (−1,149/−849) in both orientations (Loc2-SV40-Luc (−1,149/−849)→/←). (d,e) Transcriptional assays in N2A neuroblastoma cells with mouse (d) or human (e) Prox1 promoter constructs, as indicated. (ft) Double immunostainings of myc (green) with various markers (red) in NSCs co-electroporated with NR5A2-myc+shSCR (f, i, l, o and r) or NR5A2-myc+shProx1 (g, j, m, p and s) expression vectors, respectively. Arrows indicate representative NR5A2-myc+ cells that co-express GFAP (o,p) or βIII-Tubulin (r,s). Quantifications of the indices of all markers are shown in h, k, n, q and t (% of GFP+ or NR5A2-myc+shSCR+ or NR5A2-myc+shProx1+; marker+/total GFP+ or NR5A2-myc+shSCR+ or NR5A2-myc+shProx1+). The results are shown as mean±s.d. NS, not significant. P>0.05, **P<0.01, ***P<0.001 (Student's t-test). Scale bars, 50 μm.
Figure 8
Figure 8. NR5A2 regulates the Cdkn2a (p16Ink4a) and Cdkn2b (p15Ink4b) genes of the Ink4/Arf genomic locus.
(a) RT–qPCR quantification of various Cdki genes in NSCs infected with GFP- or NR5A2-expressing adenoviruses. (b) RT–qPCR quantification of p16Ink4a and p15Ink4b genes in Nr5a2fl/fl NSCs derived from spinal cords and transduced with Ad-GFP or Ad-Cre (Supplementary Fig. 14). (c,d) Schematics of the organization of mouse Cdkn2a (c) and Cdkn2b (d) gene loci (upper panels). The lower panels present ChIP analyses for NR5A2 binding in chromatin prepared from E12.5 CNS. (e,f) Schematic representation of a number of luciferase-reporter constructs containing various fragments of the mouse p16Ink4a promoter (e) or p15Ink4b promoter (f). The lower panels present transcriptional luciferase-reporter assays in N2A cells, as indicated. The results are shown as mean±s.d. NS, not significant. P>0.05, *P<0.05, **P<0.01, ***P<0.001 (Student's t-test).
Figure 9
Figure 9. NR5A2 represses JAK/STAT signalling.
RT–qPCR analysis in E12.5 CNS of Ctr and Nr5a2 KO animals for the detection of mRNA levels of a number of genes involved in JAK/STAT pathway, as indicated. All values represent the mean±s.d. of four animals (n=4). NS, not significant. P>0.05, *P<0.05, **P<0.01, ***P<0.001 (Student's t-test).
Figure 10
Figure 10. Schematic representation of our proposed model for the central role of NR5A2 in NSC fate specification.
NR5A2 is upstream regulated by the major neuronal and astrocytic pathways including proneural genes (Neurog2 and Mash1), Notch1 and JAK/STAT signalling. On the other hand, NR5A2 regulates proliferation and differentiation of NSCs via direct regulatory effects on Ink4/Arf locus (p16Ink4a and p15Ink4b), Prox1 as well as Notch1 and JAK/STAT.

References

    1. Martynoga B., Drechsel D. & Guillemot F. Molecular control of neurogenesis: a view from the mammalian cerebral cortex. Cold Spring Harb. Perspect. Biol. 4, a008359 (2012). - PMC - PubMed
    1. Krylova I. N. et al. Structural analyses reveal phosphatidyl inositols as ligands for the NR5 orphan receptors SF-1 and LRH-1. Cell 120, 343–355 (2005). - PubMed
    1. Lee J. M. et al. A nuclear-receptor-dependent phosphatidylcholine pathway with antidiabetic effects. Nature 474, 506–510 (2011). - PMC - PubMed
    1. Benod C. et al. Structure-based discovery of antagonists of nuclear receptor LRH-1. J. Biol. Chem. 288, 19830–19844 (2013). - PMC - PubMed
    1. Burris T. P., Busby S. A. & Griffin P. R. Targeting orphan nuclear receptors for treatment of metabolic diseases and autoimmunity. Chem. Biol. 19, 51–59 (2012). - PMC - PubMed

Publication types

MeSH terms

Substances